►
Description
Speaker: J.B. Langston
Company: DataStax
I’ll give a general lay of the land for troubleshooting Cassandra. I’ll show you what to look for in the logs, what Cassandra, Java, and Linux commands are useful for troubleshooting, and touch on a few common performance bottlenecks and how to check for them.
B
A
Just
going
to
go
over
some
things
to
keep
in
mind,
while
you're,
troubleshooting
and
I'm
going
to
briefly
touch
on
supporting
some
job
tools,
that
will
be
useful
and
then
really
the
meat
of
the
presentation.
That's
going
to
be
a
deep
divers
lost
things
to
look
for
in
the
system
log,
what
a
start
with
just
polishing
process
from
support
engineers
perspective.
A
First,
you
need
to
ask:
what's
changed
to
be
in
terminus
at
problems
for
we're
booked,
three
need
fine
and
understand.
Here's
very
curry.
On
the,
for
example,
bottlenecks,
53
bras
and
six
to
take
corrective
action
now
I'm
going
to
get
a
focus
today,
I'll
just
134
and
their
tools
of
Cassandra
continue
to
do
that,
step,
5
and
6,
or
between
kind
of
the
hard
part.
A
A
You're
troubleshooting
definitely
try
to
just
change
one
thing
in
return:
some
guys'll
agent
variables-
and
you
know,
what's
working,
what's
not
so
nice
to
the
we're
talking
about
something
that
processes
eccentric,
uses
to
do
its
job
and
see.
If
we
keep
these
in
mind
when
we're
going
through
what
one
system
logs
cherry
types
of
the
startup
process
and
the
foreground
process
is
mainly
coordinating
requests
and
then
certain
have
local
reads
and
local
rides
from
disk.
A
When
there's
a
bunch
of
background
processes
and
synergies,
missing,
got
flushes
compaction,
starters
collections,
gossip
and
in
hand
off
and
repair
and
hopefully
messier
familiar
with
most
of
those
things
come
I
see,
hit
Shogun's,
okay,
well,
I'm,
going
to
explain
a
lot
of
stuff
as
I
go
along,
but
I
don't
have
time
in
our
presentation
to
do
your
life.
A
really
in-depth
reviews
of
the
the
audience
for
this
I
kind
of
the
same
would
have
experience
with
the
center
see
how
it
goes.
A
The
system
resources,
the
standard
pieces
or
another
thing:
you're
mine
and
you're
the
same
resources
of
any
application.
You've
got
cpu
and
when
we're
talking
about
CP,
you
should
keep
in
mind
letting
all
the
most
important
sensation,
because
there
are
certain
processes
in
the
senator
and
a
blank
check.
Pakya
dining
table,
for
example,
that
are
inherently
single
thread,
and
so
the
speed
of
the
single
core
is
still
important
for
this
processes.
B
A
A
B
A
And
limits
like
file
handles
processes
and
just
going
to
sort
of
do
a
review
of
the
Linux
monitoring
commands
that
I
find
are
the
most
helpful,
hopefully
a
lot
of
eerily
familiar
with
these
already
top
4
cpu
utilization
and
previews
/
process
top
dash
gauge,
which
will
give
you
the
CPP
equalization
for
thread
and
that's
really
important
with
standard,
because
it's
a
heavily
multi-threaded
process
and
you're
just
looking
at
the
cpu
utilization
in
the
overall
process,
that's
pretty
peg!
So
in
order
to
understand
what's
really
going
on
with
the
center,
you
can
look
at
mrs.
A
B
A
A
Also,
some
java
monitoring
stands
first
Jay
stack,
which
gives
you
a
status.
Tax
rates
and
spreads
toggle
process
got
Jay
manflesh
system,
which
will
give
you
a
disagreement
with
all
the
objects
that
you
have
underneath
jmac
dash.
He
which
will
show
you
the
size
usage
of
each
Jonathan
generations,
Jay
stab
the
dash
of
G
C
cause
I,
really
like
this
one.
A
It
showed
you
a
percentage
of
it
should
be
the
percentage
of
each
generation,
how
much
as
you
eyes
and
tells
you
the
cause
of
each
garbage
collection,
and
so
it's
kind
of
what
you're
too
much
blogging,
but
without
having
to
enable
it
starts
across
most
next.
When
you
need
to
bring
out
the
big
guns,
you've
got
a
GF
dash
dump,
which
will
take
it.
A
You've
done
that
you
can
employ
them
to
like
your
Clips
memory,
analyzer
for
post-mortem
analysis
to
see
exactly
what's
consuming
your
memory
so
now,
you're
30,
attic
them
getting
to
the
immediate
of
resin
tation
and
just
want
to
give
you
a
preview
of
the
medical
teams
and
I'm
going
to
talk
about
which
ones
are
currently
she's
or
my
job
status
or
rate
gives
you.
The
overall
cluster
status
info
will
be
D
status,
memory,
usage
and
cash
information
for
single
node,
TV.
A
Give
you
some
tistic
about
incredible
on
a
single
node.
Cm
stats
is
going
to
give
you
summary
statistics
for
all
the
tables
on
particular
node
CF
histograms
are
giving
more
detailed
statistics
about
a
particular
voluntarily
proxy
histograms
is
going
to
give
you
legacy
information
for
requests
that
are
particular
note
coordinated.
So
these
are
you
know
when
a
client
to
next
in
them
that
becomes
the
coordinator
is
not
necessarily
the
know
that
that's
certain
the
day
off.
A
Yes,
so
that's
the
difference
between
rocks
compaction,
stats,
initiating
the
number
of
actions
and
the
protections
that
she
had
a
progress.
Net
stats
is
network
activity
which
includes
strings
for
things
like
her
peers,
this
rap
and
so
on,
reverb
ears
and
then
you're
employed,
and
that
the
coordinator
has
been
sent
to
other
nodes
in
this
waiting
for
response
from
so
looking
at
notable
status,
I'm
just
going
to
sort
of
get
through
and
explain
what
each
of
these
things
are.
So.
B
A
A
A
The
load
is
the
amount
of
data
that's
stored
on
a
node
and
if
it's
normal
for
the
load
to
vary
somewhat
from
meadow
Dakota,
it
doesn't
necessarily
indicate
a
problem.
But
if
you
have
like
a
huge
variance
and
I'm
talking
percentage-wise
rather
than
absolutes,
because
once
you
get
a
lot
of
data,
you
know
making
a
gigabyte
doesn't
really
isn't
that
much
of
material
ID.
So,
but
if.
A
B
A
Is
usually
256
and
the
next
is
the
ownership
percentage?
This
is
the
percentage
of
the
total
token
ring
that
this
is
responsible
for
and
I
want
to
bring
your
attention
to
the
note
at
the
top,
which
says
an
ownership
information
does
not
include
apology.
What
that
means
is
that
if
you
just
run
my
tool,
bring
your
mental
status
without
writing
a
teen
space
center
doesn't
know
what
replication
tracker
to
use,
and
so.
B
A
Going
to
show
this
information
this
evening
that
you're
triggered
the
strategy
and
that
you
have
a
replication
factor
one.
So,
if
you're
running
this
command,
Monta
met
with
multiple
data
centers,
sometimes
you
need
to
just
take
that
on
her
ship
with
a
grain
of
salt,
unless
you
actually
provided
a
key
space
so
that
it
knows
what
replication
factory
actually
another
thing
is
with
vinos
tokens
are
randomly
distributed
to
the
nodes,
and
so
it's
normal
with
denotes
for
there
to
be
making
one
or
two
percent
white
difference
between
nodes.
A
But
overall
I
should
be
roughly
the
same.
Here
you
get
your
host
ID,
and
this
is
just
a
unique
identifier
for
the
note
it's
used
with
the
medical
remove.
None
of
you
can
also
log
for
some
businesses
and
then
finally
got
Iraq
and
the
idea.
What
Rex
is
that
you
can
avoid
single
points
of
failure,
because,
typically
the
physical
Rack
is
going
to
share
power
supplies
going
to
share
a
network
switch
and
so
you're
you're
really
wanting
to
put
different
images
of
the
same
data
onto
a
different
track.
A
But
I
will
say,
unless
you're
using
demons,
rats
are
really
more
trouble
than
they're
worth,
because
they
impose
really
strict
requirements
on
how
we
can
expand
your
cluster,
and
so,
if
you're,
not
even
if
you're,
not
using
me,
always
having
all
the
nodes
in
st.
right,
if
you're
using
Thanos,
it
becomes
much
easier.
A
The
only
restriction
we
have
to
keep
in
mind
is
that
the
same
rumor
moves
within
interact,
ensure
any
data
distribution
and
then
finally,
I
just
want
to
highlight
that
line,
which
is
that
it's
down
in
murray,
if
you're
trying
to
figure
out
which
system
log
you
need
to
look
at
here's
the
here's
the
place
that
I
would
start
looking
mostly
just
want
to
mention
noticeable
Raven
quickly.
It's
an
older
way
of
getting
the
status
and
it
shows
the
same
information
as
medical
status,
except
it
also
shares
their
token.
A
A
B
A
In
mind
that
if
the
garbage
collection
hasn't
run
recently,
the
amount
of
evening
use
may
include
a
are
this
actual
environment.
So
if
you
want
to
see
how
much
he
minimum
number,
how
team
that
you
really
are
anything,
you
would
have
to
force
the
garbage
collection
on
the
jmu
and
in
the
offing
memory
that,
as
I
mentioned
before,
there's
a
lot
of
data
structures
that,
in
the
hospital.
A
A
Exceptions
are
always
synonymous
with
errors,
but
they're
close
enough.
This
is
a
really
good
metric
and
you
start
see
this
number
go
out
and
probably
in
trouble
check
it
out.
Then.
Finally,
we've
got
statistics
about
the
key
cash.
You
know
your
size
and
your
capacity,
the
sizes
of
the
amount
of
key
captions
actually
being
used
and
a
capacity
is
the
amount
that
you've
specified
in
standard
by
camel.
If.
A
Your
cash
is
too
big,
so
you
may
want
to
reduce
it.
The
other
hand
you've
got
your
key
cash
hits
and
number
of
requests
and
hit
rate
if
you're
in
rate
is
low
and
the
size
is
close
to
capacity
na
keiki
captions
too
small.
So
you
may
want
to
infinitely
increase
that
and
watch
this
number
until
you
kind
of
gives
the
point
of
diminishing
returns
and
that's
how
to
sort
of
annoying
side
vision
cash.
A
This
is
the
same
periods
die
periodically
Cassandra
bull,
saving
the
contents
of
the
key
cash
to
disk
so
that
when
you've
restarted
it
in
real,
oh
definitely,
yes
and
you're,
not
starting
to
cash
rohtash.
You
have
the
same
information
as
you
use
your
key
cash,
but
row.
Cash
is
really
only
useful
for
really
really
really
Ariel
set
of
use
cases,
and
it's
so
narrow,
in
fact,
that
it's
almost
not
even
worth
the
time
to
see
if
Rome
caches
they
get
idea.
So.
A
B
A
Rules
that
Sandra
Jesus
is
taught
to
do
those
tasks
that
I
was
talking
about
earlier,
certain
certain
rights,
coordinating
requests
and
I'm
going
to
just
go
through
what
the
calls
being
first
and
then
I'll
talk
about
some
of
the
more
important
thread
fold.
So
first,
we've
got
a
full
name,
which
is
obviously
it's
a
description
of
what
hold
on,
and
then
you
got
the
number
of
active
request.
These.
B
A
The
number
of
god
bless
their
cute
waiting
waiting
through
threads
and
free
up,
so
they
can
serve
them,
and
the
limit
for
this
is
typically
around
two
billion,
but
you're
going
to
run
out
and
everything
like
with
work.
You
ever
hit
that
women
have
that
request.
A
high
number,
including
request,
generally
in
case
that
your
head
is
not
keeping
up
with
demand,
and
so
probably,
if
you
see
this
consistently
it's
time
to
expand,
professor,
the
number
of
completed
request
is
simply
coming
hard
lesson
needed,
since
the
medicals
last
restarted.
A
B
A
A
fundamental
part
of
its
architecture
so
that
if
it,
if
a
request
is
longer
than
the
time
specified
in
standard
I
handled
those
are
blessed
will
be
drawn,
and
so,
when
you
see
a
bunch
of
drop
request
again,
that's
usually
an
indication
that
your
note
is
over.
Would
either
your
digits
can't
handle
it
or
your
CPU
can
handle
it,
but
generally
the
best
approach.
When
you
see
that
start
to
happen,
do
some
tuning
is
simply
the
basic
investigation.
B
A
Is
the
one
that
handles
local
breeds,
so
local
reads
would
be
actually
blowing
the
day
off?
Yes,
their
particular
replica
island.
The
number
of
reads,
the
number
of
threads
active
dress,
is
controlled
by
the
current
rate,
setting
in
your
standard,
a
camel
and
at
the
bottom
you'll
see,
we've
got
the
various
types
of
green
messages
that
are
handled
by
the
late
stage.
A
Next,
we
got
mutation
stage.
This
handles
local
rights,
for
which
this
node
is
a
replica
again.
This
is
local
writing
to
get
not
coordinating
requests
to
other
nodes
and
again
at
the
bottom.
You
have
three
different
types
of
rites
there
in
one
stage
and
then
finally,
we've
got
a
request-response
thing,
and
this
is
the
one
that
actually
handles
coordination,
so
you're
playing
next
to
that.
A
That
is
a
coordinator
for
decoration
request
and
it
runs
that's
based
on
your
consistency
level,
the
number
of
meds
that
you
that
you
specified
asks
for
the
data
wait
for
it
to
come
back.
So,
while
it's
sent
out
data
registers,
a
call
back
of
this
request
response
state
and
once
the
day
comes
back
or
call
back
is
triggered,
and
that's
what
this
stage.
A
A
You
have
a
lot
of
east
case
from
ashes,
which
the
only
two
real
use
cases
for
badges
is
analog.
Fact,
when
you
want
to
guarantee
atomicity
for
a
particular
set
of
Records
eager
they
all
an
inserter,
they
all
fail
and
then
another
log
that
it's
really
only
useful.
If
you're
inserting
records
with
the
same
partition
feet,
you're
not
doing
one
of
those
two
things,
then
it's
better
to
use
your
drivers
asynchronous
query
execution.
It
is
pipeline
request
to
ram
Robin
around
the
cluster
rather
rather
than
sending
enjoy
fashion
coordinator.
That's
going
to
promote
plus
runner.
A
The
number
of
active
threads
is
governed
by
M
tables,
Russian
writers
say
your
standard,
I
camel
and
then
number
ending
tasks
is
governed
by
plus
Q,
sauce
and
centre-back
narrow.
An
important
thing
to
know
about
this
is
that
if
you
run
out
of
available
flesh
riders,
that
note
is
going
to
stop
searching
reads
and
tell
another
flush
writer
becomes
available.
The
flesh
riders
are
responsible
for
writing
in
tables
to
disk,
so
the
right
comes
in
here.
No,
it
gives
it
the
milton
able
to
guess
it
with
nick
log,
when
a
min
table
gets
full.
A
The
flesh
rider
rising
two
discs.
If
they
can
write,
it
is
because
all
of
a
plus
runner
from
taken-
and
it's
not
safe
for
the
damage
except
price,
your
rides-
are
going
to
back
up
and
see
you're
going
to
see
pending
rights
come
back,
and
so,
if
that's
the
case,
that
means
they
hear
that
your
disk
is
not
keeping
up
with
the
rate
at
which
the
writing
data
to.
A
Disk,
if
your
orientation,
we
need
to
switch
SSDs
and
an
additional
gifts
to
your
gigai
configuration
or
a
break,
also
help.
But
if
that
doesn't
help
or
that's
not
an
option,
then
to
probably
at
net
notable
CS
fats
is
the
summary
statistics
for
all
of
it:
common
families
on
a
particular
note,
and
they
can
keep
in
mind
all
of
these
numbers-
apply
to
that
home
family
only
on
them.
A
B
A
That
this
particular
rep
is
certain.
Yes,
this
is
the
latency
for
reason
for
local
reads
and
writes
they're
being
served
to
the
disk,
and
then
this
is
the
number
of
pending
tasks,
so
the
task
leaves
off
valve
in
the
TP
stats.
This
is
the
number
of
those
tasks
they're
affecting
this
particular
table
here.
B
A
B
A
Have
the
amount
of
memory
consumed
by
avi
data
structures?
This
is
the
same
number
that
should
be
shown
in
that
tool
inflow
and
then
the
bottom
you
have
it
broken
out
by
particular
data
structure.
Your
blade
filters,
your
index
number
of
depression,
that
a
bit
here
you
have
your
stats
on
the
min
table.
It's
currently
active
for
this
table
and
it's
got
a
cell
count
which
remember
columns
that
are
currently
stored
to
move
to
table,
as
well
as
the
number
of
bytes
in
their
table
and
then.
A
Way
for
the
standard
of
determined
letter
to
cure
SS
table
owns
a
piece
of
data,
so
they
can
avoid
going
and
inspecting
every
table
on
dizzam
and
so
your
false
positive
ratio.
The
bloom
filters
will
never
return
false
negative,
but
they
may
return
a
false
positive,
in
which
case
the
net
has
good
action
time.
A
Checking
that
fine
11
is,
and
so,
if
your
is
also
positive
ratio
too
high
that
can
affect
your
reading
performance,
they
want
to
increase
the
fall
spot
open
chance
setting,
which
is
a
perfect
setting,
also
the
suspect,
used
at
the
bottom
of
that
sort
of
the
other
side
of
the
coin.
The
higher
end
it
be
set
to
false
positive
chance,
the
water
I'm,
sorry
the
lower.
He
said,
multiple
chance,
the
larger
culture
becomes
of
memory,
and
so.
A
The
bottom
we
have
in
the
group.
We
have
statistics
about
the
partition
sizes
and
this
is
calculated
whenever
partition
is
compacted
sand.
That's
why
system
Patrick
partition,
but
you've
got
the
minimum
size
of
average
slides
the
maximum
size
of
different
partitions
that
have
been
encountered
on
your
dev,
and
you
know
like
at
a
huge
maximum
size.
That's
way
bigger
than
average
that
could
indicate
have
a
huge
partition
which
would
generally
gloss
problems
with
data
distribution.
Your
methods
could
become
uneven,
wear
one
that
has
a
lot
more
data.
Another
also.
B
A
Really
large
partitions
and
then
finally,
you
have
statistics
about
the
average
live
cells
versus
tombstones
that
have
been
scanned
through
last
in
the
last
five
minutes
and
tombstone
certain
markers
for
delays
right
and
so,
when
you're
doing
a
query,
if
you're
scanning,
through
partitions
and
most
of
the
day
of
his
team,
sounds
you're
just
generating
garbage
you're
wasting
CPU
cycles,
while
while
the
chicken
cheese
through
all
this
to
lead
it
there.
And
so,
if
you
see
this
in
the
team,
spin
ratio
is
very
high
compared
to
live
cells.
B
A
It
was
doing
queries
against
this
table.
The
more
SS
tables
already
has
to
hit
the
slower
it's
going
to
be
Mariah.
What's
going
to
occur,
the
partition
size
again
is
going
to
show
you
distribution
of
the
data
as
far
as
the
size
of
your
partitions,
and
then
this
is
going
to
show
you
number
of
columns
that
you
have
court
issues
and
way.
Did
you
read?
This
is,
on
the
left
hand,
side
each
one
of
these
forms
of
bucket,
and
so
the
bucket
goes
from
the
previous
line,
not
inclusive
to
the
current
one
inclusive.
A
B
A
A
You're
counting
partitions
and
then
it's
also
important
to
pay
attention
to
the
units
that
are
used
for
the
budgets
you're
using
your
buckets
are
the
number
of
SS
tables
and
first
played
in
the
first
example
by
some.
The
second
insulting
turn
here,
just
another,
an
example
of
how
you
would
read
this.
This
tells
unit
approximately
fourteen
point,
five
thousand
partitions
contained
2771
and
912.
A
A
The
time
shown
here-
or
they
may
include
the
time
that
it
took
for
the
network
traffic
to
go
from
the
coordinator
to
the
other
records,
confirm
number
of
number
of
relevance
for
apply
to
meet
your
consistency
level
when
actually
on
the
notable
compaction
stats.
It
shows
you
the
number
of
any
compaction
and
then
beneath
that
we
showed
you
this
progress,
reactants
factions
and
so.
A
Here
order
to
determine
what
data
is
in
sync
and
what
man
is
how
to
sing
now,
you've
got
your
keys
basic
table
name,
you've
got
the
bikes
completed
in
the
number
of
double
bites.
Action
is
going
through
here.
You've
got
a
car,
that's
in
here
at
the
bottom
of
you
have
an
action
remaining
time.
This
is
just
an
estimate
and
I.
Don't
find
it
typically
very
useful
because
it
doesn't
include
the
time
of
tasks
or
intake.
So
as
soon
as
the
exact
test
is
finished,
you
have
set
up
for
waiting.
So
looking
at
this
member.
B
A
A
We
prepared
a
number
prepared
attempted
and
the
number
of
action
of
mismatches
that
were
found,
and
then
here
are
the
coordinator
statistics,
which
will
be
the
number
of
demands
and
coordinator
sent
out
responses
received.
So
that's
a
new
tool
and
the
other
half
of
the
picture
is
gonna
come
from
the
system
that
long.
So
this
is
a
long
is
located
by
default
on
our
blog
and
the
configuration
file
is
located
at
cbse.
A
Cassandra
is
a
lot
for
a
certain
amount
properties,
the
important
settings
in
the
configuration
file,
our
location
and
so
it's
possible
to
change
where
the
blog
is
stored
and
you
don't
find
a
location
in
check
your
configuration
Albert's
corrected
to
also.
This
is
probably
the
most
important
thing
that
you're
going
to
do
if
you
normally
believe
this
at
info.
But
here,
if
you're
trying
to
die,
has
a
difficult
problem,
you
don't
have
enough
information.
You.
B
A
A
A
A
A
Time,
which
is
pretty
self-explanatory,
but
I
do
want
to
point
out
how
critical
it
is
to
look
at
the
date
correlating
its
multiple
nodes
in
the
notice.
You
have
a
source
bottom
of
the
line.
Number
just
want
to
point
out.
This
is
being
in
the
case
of
an
exception.
This
would
be
the
source
of
my
member
Nick,
hot
blog,
the
exception,
not
necessarily
for
the
exception
occurred
and
so
on.
That
topic
is
going
to
want
to
talk
about
exceptions
per
minute
to
the.
B
A
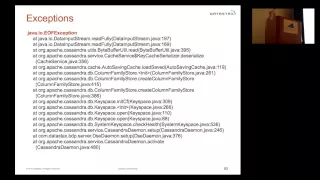
I
want
to
sort
of
break
it
down
the
way.
As
for
engineering,
okay,
you
got
your
exception
at
the
top,
but
that's
not
particularly
useful
without
any
context,
and
so
the
context
is
provided
on
inspect
races.
Is
you
do
all
of
text
that
the
most
important
thing
to
understand
is
at
the
top?
You
have
the
ear
most
function
that
was
running
on
the
inception,
avert
the
bottom.
You
have
any
other
ones,
and
so
now
I'm
going
to
kind
of
break
it
down
into
what
the
individual
components
are
and
what's
important
to
look
at.
A
So
where
is
you
got
your
organization,
and
this
is
basically
whose
fault
was
the
exception?
You've
got
Java,
which
indicates
that
it's
a
part
of
java
class
library
got
word
Apache
Cassandra,
which
is
the
center
of
open
source
project.
Independent
you've
got
combat
a
snack
stock,
which
is
the
datastax
enterprise
product
and
in
addition
to
the
organization,
you
will
typically
also
see
a
part
of
the
package
that
concerns
the
subsystem
that
was
affected
by
rail
section
and
so.
A
B
A
A
A
The
important
things
thing
to
know
is:
if
you're
going
to,
if
you're,
going
to
give
source
code
I
is
that
the
lot
of
members
can
often
you
change
between
versions.
So,
if
you're
going
to
go,
look
at
the
code,
you
need
to
make
sure
like
you're
on
github,
and
you
select
the
appropriate
version
from
the
drop-down
we
spend
time.
Looking
at
another
inception
illustrates
a
few
other
things
you
got
caused
by,
which
indicates
a
nested
exception,
and
it's
common
in
Java
or
one
piece
of
heaven
thrown
exception.
A
Another
piece
of
catch
it
rabeteh
exception,
and
another
exception
is
great.
That
other
exceptions.
So
if
you're,
just
looking
at
the
outer
exception,
that
may
not
give
you
the
whole
picture.
So,
in
a
case
that
you
see
these
caused
by,
you
need
to
look
at
both
exceptions
in
order
to
figure
out
what's
really
going
on.
The
other
thing
here
is
the
error
message
which,
when
you
throw
an
exception,
you're
giving
your
getting
a
free
form
field
in
order
to
drive
more
details
about
here.
A
So
this
tells
us
that
the
type
of
socket
exception
that
occurred
was
caused
by
a
connection
reset,
and
then
why
would
have
this
up
here?
A
few
more
examples
of
organizations,
organ
that
acrylic
is
a
separate
potential
projects
that
you
were
going
to
look
at.
How
thrifty
would
you
look
at
that
project
rather
than
Sandra,
and
then
again
some
of
the
subsystems
you
got
transported
server
rift.
So
we
do
that
thriftless,
like
beautiful
way
of
interfacing,
with
et
cetera.
A
A
The
individual
elements
so
that
people
treats
them
as
a
whole.
This
is
especially
important
with
a
mirror
message
which
might
convert
them
into
multiple
words.
Anyone
that
error
message
to
be
found
for
mayor
they
use
the
site
feature
on
google
to
limit
your
search
to
relevant
websites,
and
some
of
the
most
useful
ones
for
Cassandra
would
be
mailing
list
getting
zero,
weird
bug
the
file
and
then
stack
overflow
and
forsook
overflow.
A
You
would
probably
also
include
the
keyword
to
sandwich
so
that
you're,
finding
things
that
are
right
to
the
snare
group
and
then
finally
be
prepared
a
narrow
or
broaden
your
search
as
necessary.
This
is
more
of
an
art
than
a
science,
and
so,
if
you
find
a
ton
of
results,
you
may
want
to
add
some
traditional
methods
and
classmates
arrow
down.
You
don't
find
any
results.
Experiment
with
taking
some
up
now
hungry,
don't
don't
include
the
source,
the
source
file
of
the
liner
number,
because,
as
I
mentioned,
the
line
members
also
change
between
versions.
A
A
B
A
A
Ok,
so
this
quickly
to
go
through
some
of
the
things
that
Center
tells
you
at
startup.
That
can
be
useful
logging
in
issue
I'd.
That
verbatim
spring
is
the
first
thing
that
ever
gets
log
restart
the
Sandra.
So
if
you've
changed
some
some
parameters
or
something
you
may
wanna,
you
may
want
to
exclude
anything
from
the
log
that
was
before
the
final
restart.
A
It
will
tell
you
the
version
of
DSE,
as
well
as
all
the
major
components,
Cassandra
silver
spar
wut
having
and
then
it
will
tell
you
the
configuration
file.
That
is
loading.
The
settings
from
this
is
important
with
this
configuration
files
are
pulled
out
of
your
class
path
and
it's
possible
for
a
configuration
file
accidentally
speak
into
your
class
path
somewhere,
where
you
expect
it
to
be
in
some
of
the
same
cases
where
someone
was
using
configuration
settings
that
were
totally
different
from
what
they
thought
very
easy.
A
A
If
they
are
on
Tintin,
your
heart,
JD
and
vendor
and
version,
you
don't
want
to
make
sure
that
you're
using
Oracle
jpg
I
JK,
because
the
Oracle
JK
is
what
this
entrance
is
testing
years,
also
make
sure
that
you're
using
one
of
the
more
recent
versions
of
what
I
per
person
for
every
figure
for
your
version
of
Sandra,
that's
usually
going
to
be
counted.
17
and
then
on
finally.
B
A
Sure
that
you're
using
6450
next
you've
got
some
useless
information,
both
the
overall
team
and
the
size
generations.
This
is
good
just
to
verify
your
settings
and
also,
if
you're,
looking
at
the
system
logs
per
annum,
that
you
don't
have
direct
access
to
the
Settings
button,
and
this
tells
you
what
this
thing's
worth
the
glass
panel.
If
you
get
some
sort
of
weird
like
a
class
not
found
exception
or
a
no
such
a
method
exception.
This.
A
A
year
missing
a
jar
file
where
you
have
a
long
version
in
your
file,
so
you
know
look
at
that.
I
make
sure
the
version
that
are
listed
or
the
ones
that
are
brokerage,
leverage
to
Stanford
and
then
finally,
JK
and
blocked
all
successful.
You
want
to
live
with
this
verbatim,
and
if
that's
not
your
system,
that
log,
then
you
don't
have
je
na
installed
properly
and
that
can
cause
a
problem
because
center
uses
that
library
or
event
itself
from
being
swapped
out
for
a
few
other
things
like
that
are
taking
efficient
snapshots.
A
A
A
A
With
the
cute
and
the
beginning
of
the
right,
they
started
the
unique
environment,
a
part.
That's
my
line
up
here
and
then
you're
going
to
correlate
the
beginning
in
that
the
actual
flush
using
the
predator
and
then
some
other
information
is
useful.
This
shows
you,
the
serialized
and
modifieds
number
of
operations
that
were
in
them
table
serialized.
A
A
This
is
the
name
of
the
SS
table
that
the
men
table
generated
when
it
was
flushed
the
size
of
that
as
table
and
I
can
actually
be
smaller
than
what
you
saw,
because
this
compression
and
then
finally,
once
a
mid-table
is
fleshed
disk.
That
data
is
safely
stored,
SS
tables,
so
you
no
longer
need
the
clock
segment.
That
course
wanted
to
that.
People
in
in
table.
B
A
A
B
A
Table
the
number
of
going
into
the
tech,
compassionate
commonality,
compaction,
a
lot
of
the
percentage
reduction
in
size
and
you're
going
to
have
the
amount
of
time
actually
cooking,
as
well
as
the
rate
of
the
compaction
in
a
glass
per
second
and
so
considerate
models
and
actions
in
order
to
limit
the
disc
I
out
of
the
thick
generate
and
allow
rates
and
rice
to
be
served
quickly.
And
so,
if
your
detection
took
a
really
long
time,
you
may
want
to
look
at
whether
your
discs
actually
handle
a
higher
rate.
A
Got
the
total
number
of
rows
spread
across
all
of
the
SS
tables
and
how
many
of
those
rows
we
need,
and
then
you
go
to
the
merge
accounts
which
were
this
is
in
the
format
x.
Colon
library
account
x
is
the
number
of
SS
tables
that
a
particular
row
was
spread
across
before
compassion,
and
why
is
the
account
of
rows
that
was
spread
across
that
I
also
want
to
point
out.
A
If
you
see
something
like
this
during
compaction,
that
means
you
have
a
wide
row
that
was
too
large
to
be
compacted
the
memory,
and
so,
if
you're,
trying
to
figure
out
what
what
row
in
your
database
is
alive
room
looking
at
the
system,
double
all
you're.
Looking
for
messages
like
this
can
can
tell
you
which
row
it
is
so
that
you
can
address
it
and
it
will
show
you
your
name
of
the
East
base
intently
and
then
the
partition
key
for
that
road,
and
it.
A
Garbage
collections
are
the
bane
of
any
type
of
application
anytime.
Well,
there
are
two
types
of
garbage
collections.
There
are
ones
that
can
run
concurrently
with
your
application
and
everyone's
that
stop
everything
running.
Stop
the
world
collections
means
the
Cassandra
can't
serve
a
wreath
right.
It
can
toss
it
with
the
other.
Nodes
is
basically
dead
until
that
compaction
complete
the
only
connection
to
the
considerate
logs
part
of
the
stock
broking
actions,
so
you'll
see
they're
the
type
of
the
compassion
you're,
even
though
that
says
incurring
marks
week.
A
That
is
actually
a
stop
the
world
confection,
because
what
happened
was
that
the
concurrent
compactor
to
keep
up
with
the
rate
of
your
garbage
collections
generated
so
that
you
fill
up
it
has
thought
the
application
and
compact
the
heat
down
before
a
lot
of
mt.
So
you
see
the
amount
of
time
here
that
was
actually
91
seconds,
that
compassion
ran
for
action,
that
garbage
collection,
and
so
that
is
going
to
wreak
havoc
on
your
cluster
right.
A
A
Faction
that
was
pretty
bad.
You
typically
want
to
avoid
actions
that
are
over
like
500
milliseconds,
but
it's
not
that
bad.
But
what
you
also
want
to
look
at
is
the
number
of
the
actions
that
occur,
but
this
particular
have
a
period
of
time,
because
even
if
the
individual
I
keep
saying
connections.
A
Occurs
in
is
still
over
seventy-five
percent
full
after
the
collection,
then
you're
going
to
get
a
bring
log.
That's
the
enos,
the
certain
percentage
bowl
is
that
happened.
He
need
to
start
looking
at
live
in
this
pool.
You
may
want
to
take
it
down.
Look
at
let's
go
get
up,
take
corrective
action,
whether
you're
remove
its
tweak.
Some
settings
move
data
to
a
different
note
of
what,
if
you
have
to
I,
also
just
want
to
point
out.
This
message
is
part
of
this
morning.
It
says:
adjust
the
flush
Marcus
and
in
tables
at
threshold.
A
A
B
A
A
With
your
network,
what's
going
in
the
end
of
when
a
nobody
has
up
and
down
this
hard
like
slapping,
it's
bad
when
I
know
is
down
the
coordinator
that
was
going
to
send
data
to
that
graphic.
It
will
store
it
hint
for
it.
When
the
never
comes
back,
a
coordinator
of
the
syndicate
doesn't
miss
right,
it
was,
and
so
having
a
handoff
occur,
puts
extra
load
on
the
coordinator.
That's
actually
what's
going
up
and
down,
so
this
is
necessary
to
help
maintain
consistency,
but
it's
not
something.
A
A
At
your
first
thing
you
want
to
see:
is
this
unique
ID
for
your
repair
session?
That's
going
to
tell
you
that
all
these
messages
are
from
the
same
repair
when
you
start
over
here,
you'll
see
in
the
session
message.
Nice
thing
that
message
also
tells
you
that
it's
syncing
with
the
ranges
of
tokens
that
is
sinking
and
the
keyspace
of
content
was
missing.
A
A
A
For
every
minute
they
requested
one
from
their
repairs.
Gonna
hang
at
that
point,
so
you
need
to
go.
Look
at
the
other
heads
logs
figure
out
is
the
compaction
still
running?
Was
there
a
network
here?
Why
didn't
this
remember
treaty
I
will.
Thank
you
faxed
in
them.
That's
this
request
of
it
once
it
gets
purple
trees
and
it
does
a
comparison.
It's
either
going
to
tell
you
that
the
replicas
are
consistent
or.
B
A
It
a
certain
number
of
ranges
are
out
of
sync.
If
they're
out
of
sync,
then
it
will
start
doing.
The
screening
prepare
tell
you
it's
performing
straight
over
here
at
this
man
ranges,
and
then,
after
that
stream,
please
you'll
see
the
screaming
task
succeeded,
and
so
that
is
your
indication
that
that
scream
was
successfully.
A
Finally,
once
all
of
the
leading
right
is
it,
you
have
either
been
verified
would
be
in
sync
or
the
screen
to
finish.
You'll
see
the
message
that
that
particular
table
is
policing
and
then
finally,
you
should
see
the
message
that
says
that
the
session
completed
successfully,
if
you
see
a
new
session
message
in
your
logs
with
a
particular
session
ID-
and
you
don't
see
the
corresponding
session
completed
successfully,
never
bear
didn't
finish,
need
to
look
more
closely
at
the
intermediate
messages
between
in
order
to
figure
out
water
appears
rail
or
why
I
still
work.
A
So
that's
pretty
much
in
bringing
it
full
circle.
I
just
wanted
to
remind
you
of
the
steps
that
I
talked
about
next
time.
You're
trying
to
do
this
just
keep
in
mind
some
of
the
resources
that
you
Center
give
you
to
give
you
these
things.
Are
the
nodal
output
system
dog
and
take
a
look
at
these
things,
and
it
will
help
you
formulate
a
much
better
question
if
you're
asking.