►
From YouTube: C* Summit EU 2013: Performance: It's All About the App
Description
Speaker: Michael Masterson Director of Strategic Business Development at Compuware APM
Even with the fastest Cassandra cluster beneath the hood, it's the app that ultimately governs performance. Learn from customer examples on how to address the root cause of slow performance.
A
And
more
importantly,
when
we
talk
about
performance,
often
you
might
feel
like
you're
trying
to
find
a
needle
vacation
right,
you're
looking
and
try
out
a
bunch
of
things
that
might
might
work.
You
may
have
read
about
it
on
a
blog.
You
may
you
know,
be
an
expert
and
actually
think
that
you've
got
the
right
answer,
but
I'm
here
to
share
it
couple
stories
around
I
can
really
get
insight
minute
and
you
into
your
application
really
running
on
top
with
the
sandbur
or
we'll
take
a
quick
look
at
MapReduce
as
well.
A
So,
if
you're
dabbling
in
to
do
perhaps
you're
running
MapReduce
on
top
of
beta
stacks,
which
happens
to
add
that
layer
of
a
common
center
will
give
you
some
insights
and
some
best
practices
and
how
to
take
that
holistic.
You
and,
at
the
end
of
the
day,
what
we're
seeing
with
no
any
Santa,
no
sequel
database
even
to
do
it's
a
level
of
complexity
that
you're
adding
it.
Some
of
you
may
be
working
on
a
brand
new
project
towards
you
know
pure
python
and
Cassandra.
A
But
guess
most
of
you
are
are
adding
a
sander
into
an
existing
application.
Maybe
you're
looking
to
kind
of
take
an
expensive
transactional
system
and
reduce
costs,
increase
efficiency
with
something
like
Cassandra
so
the
other
day
you're
looking
at
you
know
that
there
needs
to
cut
pull
together
different
views
in
a
transaction.
Well,
it
may
end
up
in
your
Cassandra
cluster,
probably
started
somewhere
else,
so
getting
insight
into
where
things
really
come
from
the
complexity.
A
That
is
probably
reducing
the
visibility
of
your
app
and
how
do
you
close
that
gap
that
you've
got
so
that
end-to-end
you
into
what
really
happens
in
in
what
matters
I
know.
There's
a
couple
of
you
hear
that
are
just
getting
started
and
I'm
not
going
to
try
to
pigeonhole
Cassandra
in
one
slide,
but
I
want
to
kind
of
from
a
perspective
of
performance
of.
A
Discussion
today
around
our
our
kind
of
case
tens
cassandra
is
great.
When
you
talk
about
something
that
provides
you
a
fast
read,
access
or
fast
right
answers
right,
you
don't
necessarily
want
to
read
and
write
or
write
and
read
exact
same
time.
You
know
at
the
exact
transactional
level,
but
it's
great
and
taking
those
those
core
concepts
scaling
them
horizontally,
as
you
saw
Jonathan
earlier
today
to
a
really
great
linear
scaling.
So
you
can
add
more
servers.
A
It's
really
a
patient
through
the
course
of
WOD
a
high-availability
built
in,
but
it
also
needs
you
to
have
some
best
practices
and
some
patterns
built
into
your
design.
You
want
to
make
sure
that
you've
got.
You
know
fairly,
even
distribution
of
data.
That
way
when
you
request
them
into
the
cluster
you're,
not
seeing
you
know
largely
different
response
times
via
double
reads
and
writes.
We
also
want
to
make
sure
that
you
have
applications
that
have
made
you
a
poor
pattern
of
access.
A
For
example,
you
know
a
single
request:
remand
application,
triggering
4,
5
10
requests
to
the
database
into
Cassandra.
You
want
to
know
about
that,
because
it's
not
necessarily
a
standard
issue
is
more.
Is
your
application
doing
the
right
thing
so
have
you
get
insight
into
what
your
apps
were
really
doing?
A
We
think
about
a
bachelor
flow
versus
a
transaction
workload
specifically
little
things
that
you
know
go
wrong,
get
really
wrong
as
they
start
to
scale
across
the
cluster.
So,
of
course
the
dude
was
great
at
up
and
that's
what
you
can
do
good
general,
but
we'll
talk
about
MapReduce
since
MapReduce
does
run
on
top
of
data
stacks
enterprises.
You
can
leverage
that
data
that
resides
within
your
cassandra
cluster.
What
works
well
and
what
are
some
of
the
challenges?
A
You
know
specifically
things
like
distribution
of
data
within
within
MapReduce
wasting
resources
when
you
think
about
what
sufficient
what's
not
efficient.
We've
got
a
case
study
with
an
application
that
one
line
of
code
loading,
a
stream
library
to
prepare
data
objects,
had
a
massive
impact
on
performance,
something
you
would
never
think
about
the
development
perspective
until
you
actually
see
the
the
impact
morning
in
production.
So
it's
it's
those
types
of
things
that
really
give
you
inside
to
do.
A
How
are
people
really
building
an
application
that
runs
on
my
cluster,
runs
on
my
environment
and
then
best
decision
for
miss
tuning
scale
in
your
database
from
there?
Let's
start
with
one
of
our
ad
tech
customers
in
New
York.
So
this
is
a
company
that
believe
there's
even
a
couple
of
you
that
are
the
the
ad
tech
business
here
as
well
serving
a
bad
looking
to
find
the
best
match.
A
You
know
those
seconds
matter
here,
because
you're
going
to
need
to
decide
whether
it's
worth
you're,
my
client
pain
ex,
you
know
cents
per
per
million
impressions
with
that
in
front
of
the
investor.
The
request
comes
in
from
you
know:
browser
through
an
exchange
ultimately
hits
somebody
who's
in
charge
of
selling
and
brokering
ads
on
behalf
of
their
customers,
and
then
that
analysis
takes
place
very
quickly.
So
the
use
case
of
high-speed
availability
on
that
type
of
data,
the
impression
the
graphic
and
the
targeting
is
really
what
we're
looking
at.
A
Of
course,
there
are
some
things
in
place
that
you
know
really
drive
whether
you're
going
to
win
and
make
money
for
you
know
yourself
or
your
customers,
and
that's
all
about
how
fast
you
know,
file
that
user
coming
in
against
the
data
set.
Did
you
know
about
it?
So
it
shows
Cassandra.
For
a
couple
of
you
know
a
couple
of
reasons:
one
high
speed,
low
latency
access.
A
They
wanted
to
make
sure
that
when
the
request
came
in,
don't
wanna
be
certain
the
same
at
the
same
person,
so
you
want
to
keep
track
of
everything
that
you
previously
serve
about
that
person's
those
you
can
get
the
most
interactive
type
of
participation,
but
you
also
want
to
you
know
kind
of
be
able
to
segment,
then
try
certain
offer
certain
products
so
a
fairly
typical
you
space
in,
of
course,
level
agency.
In
this
case
they
had
about
100
millisecond
SLA
with
the
brokerage
meeting.
A
If
they
don't
respond
within
milliseconds,
they
lose
then
chance
to
today.
This
isn't
a
database
requirement.
This
is
end-to-end
system.
100
milliseconds
is
really
the
operating
window.
So
when
I
looked
at
the
center
I
said
well,
we're
going
to
you
know,
try
to
follow
best
practices
when
we
build
out
this.
This
beta
schema
because
that's
important
Cassandra
was
the
right
fit,
but
also
they
have
the
right
data,
so
they
said
well,
it's
mostly
schema
lists.
A
They
know
the
type
of
data
they're
going
to
be
expecting
they're
going
to
do
mostly
rights
because
they're
going
to
see
all
the
requests
that
are
coming
in
when
they
need
to
read
it's
going
to
be
outside
of
the
realize.
Now
we're
going
to
be
a
transactional
or
waiting
to
kind
of
get
back
to
bid.
We
just
wrote
in
the
Cassandra
optimizing
around
different
types
of
puddin
get
never
doing
a
scan
across
the
data.
A
So
when
you
start
to
tune
your
cluster,
there's
some
best
practices
that
you
can
find
you
can
go
through
and
you
know,
d
normalized
data
is
one
that
you'll
hear
make
sure
that
you've
got
your
multi-column
keys,
set
up.
You'll,
have
distribution
across
different
nodes
and,
more
importantly,
you'll.
Try
things
like
well,
this
compression
help
or
hurt
is
it?
Does
it
make
a
difference
whether
I've
actually
got
it
enabled
and
depending
on
your
use
spaces,
it's
going
to
vary
and
also
the
type
of
goals?
A
If
you
have,
as
far
as
you
know
how
much
data
is
actually
actually
in
there
and
there's
variety
of
just
cash
settings
that
can
be
said
and
in
general,
you
know
it's
kind
of
a
trial
and
error
process
for
a
lot
of
people
figuring
out.
Well,
does
this
work,
and
so
this
particular
customer
rule
and
tried
a
bunch
of
things,
but
at
the
end
of
the
day
they
still
ran
into
a
few
problems.
Cashing
didn't
necessarily
solve
the
problem.
A
Mem
tables
and
everything
that
they
try
to
do
in
front
of
other
parts
of
their
applications
still
left
them
with
some
critical
things,
one
they
were
missing
some
bits
so
that
hundred
millisecond
SLA
we
talked
about.
They
still
didn't
know
exactly
why
they
get
you.
Don't
hundred
intend
350
milliseconds
on
some
of
those
requests.
They
can
see
them
coming
and
see
the
requests
coming
in
out
of
cluster,
but
it
didn't
necessarily
give
them
inside
him
too.
Well,
I've
got
more
than
just
the
request
with
Santa
know.
A
They've
got
some
processing
that
happens
in
flight
before
things
come
in,
so
they
need
to
get
visibility
into
really
from
the
request
that
came
in
to
make
change
throughout
their
system
into
the
cluster
and
figure
out.
Why
will
those
occasional
bids
getting
this
everything
they
designed
is
supposed
to
be
ultra
efficient?
They
saw
their
query
times,
go
for
most
grace
in
the
you
know,
10
to
20
millisecond
range
so
relatively
fast,
and
what
you
would
think
would
be
enough
buffer
for
the
other.
17
milliseconds
of
everything
else
happens
within
the
system.
Occasionally
they
failed.
A
A
A
You
might
look
at
you
know
from
an
off-center
using
datastax
enterprise
to
try
to
see
that
ballistic
view
of
how
is
my
cluster
doing
it
and
nothing
really
jumped
out
out.
They
read
the
blogs
they
try
to
do
their
own
investigation
of
the
web.
What's
the
the
type
of
tuning
that
I
can
do
and
can
I
look
at
specific
gmx,
metrics
I.
Look
at
requests
per.
Second.
A
Can
I
look
at
the
number
of
column,
families,
an
employee
and
trying
to
sort
of
do
that
that
triage,
but
still
looking
inside
the
cluster,
which,
as
it
turned
out,
wasn't
necessarily
the
only
only
story
to
look
at
because
as
much
as
you
think,
it's
the
database
fault
right.
The
reality
is,
it's
not
always
the
case
and
how
you
access
and
really
how
you
built
your
application
patterns,
determine
a
lot
on
on
the
end
and
performance
and,
of
course,
as
I'm
here
today,
you
should
all
be
deploying
you
know
to
dot
0
2
into
production.
A
It
always
gets
better
and
faster,
but
reality
is
there
are
regressions
and
there
are
things
that
you
need
to
check
out.
So
just
because
you've
got
to
over
200,
200
or
202,
because
it
means
it's
going
to
be
the
best
fit
for
your
application,
so
being
able
to
bench
line
between
releases
is
important
and
so
having
a
process
in
place.
Unless
you
actually
measure
and
know
whether
it's
it's
effective
to
field
roll
out,
so
they
started
to
look
outside
of
the
center
box
because
they
felt
like
they
doesn't
tuning.
A
They
felt
like
they
had
kind
of
pushed
as
far
as
they
could
in
to
optimize
at
the
center,
even
though
they
knew
there
was
some
discrepancy
in
a
between
request
time
and
some
outliers,
where
things
will
just
be
slow
occasionally,
so
we
tried
to
look
outside
and
say
all
right:
can
we
take
the
transactions
that
are
coming
into
Cassandra
and
local
listing
buddy
and
the
end?
You
know
essentially
looking
for
that
black
sheep
that
they
knew
was
out
there.
A
That
was
causing
problems
somewhere,
but
they
had
gaps
and
they
were
trying
to
close
that
gap
in
visibility
between
was
actually
happening
in
their
entire
application,
all
the
way
out
to
the
de
Santa
Fe.
So
as
you
look
at
kind
of
taking
that
view
of
what's
actually
coming
in,
there's
some
general
pet
best
practices
that
you
can
apply
from
the
management
and
say
what's
the
overall
response
time
and
then
to
start
to
bring
down
each
tier
so
that
you
can
understand
within
your
application.
Where
are
the
bottlenecks?
A
A
Is
that
affecting
things
because
I
might
have
you
know
data
that's
not
as
evenly
distributed
and
certain
nodes
have
different
characteristics.
The
running
in
different
data,
centers
they're
running
on
a
different
hardware,
software,
a
different
network
in
between
so
looking
at
data
access
patterns
and
I
mentioned
earlier,
the
consistency
level.
You
know
we
didn't
think
we
were
accessing
things
with
consistency
equals
all.
But
if
you
are,
how
do
you
know?
Have
you
find
those
to
make
sure
they're?
A
I
didn't
get
my
request,
sir,
because
you
know
returned
in
120
milliseconds
so
start
there
understand
what
you're,
either
in
user
or
in
client
looks
like
the
data
is
coming
in.
Make
sure
that
if
you
have
any
third
party
requests
in
this
case
as
part
of
the
transaction
flow,
while
they
weren't
hitting
a
facebook
login
screen-
and
this
is
something
where
we
couldn't
get-
that
we
can
share
all
their
proprietary
details
and
how
they
built
the
system.
A
A
Are
there
other
pieces
of
data
that
are
coming
and
going
and
that,
in
the
end
view
of
your
application,
you
probably
mob
with
it
when
you
built
it,
it's
probably
on
a
white
board
somewhere,
but
it's
probably
different
when
it
actually
lives
in
code,
so
getting
insight
into
what's
really
happening
inside
your
app
is
going
to.
Let
you
then
explore
what
really
contributes
to
that
and
end
transaction
time
and
then,
finally,
of
course,
once
you
understand
where
my
tattoo
point
is
into
Cassandra,
I
can
start
to
look
and
say.
A
So,
starting
to
calculate
that,
looking
at
purely
Becky
Sanders
side,
the
access
pattern
is
important,
so
we
mentioned
a
little
bit
around
understanding.
How
is
your
application,
interacting
with
Cassandra?
You
can
do
things
like
you
know,
instrumenting,
each
call
to
say:
I've
got
a
certain
IP
address,
calling
a
cluster
you
can
build
up.
You
know,
sort
of
your
own
view,
there's
also
tools
in
place
that
give
you
this
kind
of
disability
out
of
the
box
so,
depending
on
on
you
know
how
you're
looking
to
kind
of
instrument
your
cluster
there's
lots
of
different
ways.
A
Some
provide
a
great
fit
for
kind
of
rolling
your
own
others
can
give
you
a
view
that
really
show
you
based
on
each
transaction,
comes
in
how
many
times
am
I
kidding
each
service
and
we'll
go
in
a
little
bit
more
detail
around
this
particular
pattern.
Where
we
saw
some
interesting
me
gauge
or
something
that
was
completely
unexpected
from
from
their
application
and,
as
you
start
to
look
inside
of
a
call
in
data
center,
you
know
it's
important.
A
You
saw
today
there's
some
tracing,
that's
now
built
in
where
you
know,
and
maybe
an
offline
or
non
production
environment.
You
can
start
to
trace
individual
calls.
That
starts
to
give
you
some
insight
into
what's
actually
happening.
I
can
see
where
the
day
is
being
pulled
from
where
the
coordinator
is
sending
each
request,
and
it's
going
to
give
you
that
level
down
to
be
able
to
say,
starting
with
you
know,
what's
the
quarry
that's
being
executed?
A
Where
is
the
note
that's
going
to
supply
the
data
for
it,
and
then
you
know
things
like
consistency
level,
making
sure
that
you
check
and
the
behavior
that
you're
expecting?
Is
it
actually
with
you
what
you
intended
so
a
starting
point
is
to
say:
what's
the
quarry
coming
in
and
the
associated
characteristics
behind
it?
A
A
Again
data
access
patterns,
all
this
kind
of
contributes
to
your
understanding
of
the
application
running
on
the
top
of
the
center.
So
what
we
found
looking
inside
is
in
this
particular
case.
The
transaction
coming
in,
even
though
is
one
outside
transaction,
was
generating
about
five
calls
into
the
cluster
four
of
those
were
coming
back
at
15.
Milliseconds
of
about
is
expected,
but
there
were
a
couple
of
them
that
were
averaging
50
to
80
milliseconds.
A
So,
if
you're
trying
to
achieve
100
milliseconds,
you
know
having
something
like
this
happen,
occasionally
is
going
to
completely
break
your
application.
It's
still
going
to
return,
but
you're
not
going
to
be
able
to
serve
the
needs
of,
in
this
case,
of
a
real-time
bidding
system
so
being
able
to
understand-
and
it
gives
that
point
where
you
have
isolated
in
this
case
some
external
dependencies
that
might
have
been
contributing
where
you're
calling
a
third-party
service
inside
the
cluster
you've
got
four
out
of
five
that
are
working
well,
but
one
particular
node.
In
this
case.
A
A
I
can
look
at
those
particular
nodes
and
say
really
what's
what's
driving
the
difference
between
cory's,
what
data
is
extracted
from
note,
3,
vs,
note,
4
or
the
other
ones
in
getting
inside
to
say
now
we're
one
level
down
or
in
the
node
and
trying
to
understand
whether
it's
tracing
whether
it's
creezy
another
tool?
What
exactly
is
causing
that
a
TMO
second
mark
versus
1500
seconds
and
being
able
to
get
inside
the
job
and
say
you
know,
here's
what's
actually
happening.
Is
it
reading
and
writing
from
disk?
Is
it
waiting
on
memory?
Is
it?
A
Is
it
contending
for
some
type
of
buckles
it's
in
there,
but
getting
to
that
next
level?
Down
of
really
what's
happening
behind
the
scenes,
something
that
is
relatively,
you
know,
can
be
relatively
complex
click
you
can
isolate
the
issue
and
know
where
that
performs
pain
is
coming
from
you're
going
to
have
the
ability
to
you
know,
debug
it
yourself
to
go
to
your
vendors,
providing
support
and
say
here's
what
we're
seeing.
How
do
we
work
through
this
issue,
but
isolating
exactly
where
that
pain
is
exactly
what's
contributing
to
that?
A
Latency
is
truly
the
secret
to
most
performance
endeavors
and
how
long
it
takes
you
to
get
their
courses.
How
long
you
spend
working
through
the
debugger
issue
in
this
case
we're
seeing
a
couple
of
odd
things
where
113
millisecond
latency
on
certain
calls
you
know
driving
in
in
in
those
calls
that
was
attributed
to
really
waiting
time
waiting
on
memory
to
be
allocated.
A
It
wasn't
disk
I/o,
it
wasn't
young
computational,
so
those
types
of
carriage
characteristics
that
say
you
know
this
is
something
that
might
get
configuration
parameter
can
be
tuned
if
I'm
just
waiting,
there's
often
a
a
brand.
That's
you
know
available
to
tweak
in
tune
a
cluster
or
an
application
to
super
solve
that.
And
then,
if
you
have
a
little
bit
deeper
insight,
you
can
actually
start
to
see
some
hot
spots
across
the
cluster.
You
can
say
by
large
are
my
request
largely
found
by
memory,
bio
or
is
there
something
in
between?
A
Are
we
waiting
on
certain
data
as
he
returned,
so
this
type
of
analysis
lets?
You
know
that
cluster
that
was
returning,
80
milliseconds.
Maybe
the
disk
is
slowing
down.
If
there's
something
happening
or
if
you're
running
on
a
managed
service,
then
you
need
to
provision
more
I
ops.
For
just
that
particular
note.
A
It's
also
helpful
to
look
across
your
cluster
and
look
at
some
basic
things
like
when
is
garbage
question
running
when
is
in
passionately
and
if
you
can
start
correlate
that
time
in
which
you
know
passionate
running
with
some
of
your
transactions.
Sometimes
that's
an
immediate
hit.
You
can
do
things
like
tune,
your
garbage
collection
object.
So,
instead
of
running
you
know
every
so
often
and
really
impacting
that
the
cluster
you
can
run
on
a
more
regular
basis.
A
Likewise,
the
compaction-
you
can
schedule
when's
the
right
time
to
actually
to
make
sure
that
you,
during
your
critical
time
periods,
if
you
avoid
those
those
things
so
getting
some
high-level
views
into
your
cluster
again.
Some
of
these
are
out
of
box
when
you
think
about
that
that
few
of
the
in
death
cluster
others
are
a
little
bit
tougher
to
get
to
me
of
getting
inside
the
individual
transactional
understanding.
When
this
read
request
from
cluster
3
takes
50
milliseconds,
it's
a
little
tougher
to
get
to
that
little
detail.
A
But
this
type
of
view
is
it's
a
great
starting
point
and
gives
you
that
that
broad
level
view
of
what's
happening
over
time
over
time
to
panic,
luster
and
then
you'll
start
to
see
things
like
well,
you
know,
there's
an
inning
pattern
here.
We
see
something
like
garbage
collection,
giving
us
a
lot
of
memory
back,
but
it's
a
pretty
big
shot.
Not
a
very
you
know,
linear
stare
stuff
here
and
it
looks
like
it's
happening
on
a
fairly
sequential
basis
and
also
we're
seeing
you
know
other
patterns
that
you
wouldn't
would
necessarily
want.
A
You
know
a
very
large
brother
collection
running.
It
was
about
two
o'clock
and
in
the
afternoon
on
the
cluster.
Likewise,
a
real
spike
in
requests.
So
is
there
a
behavior
in
my
application?
That's
driving.
You
know,
sort
of
that
instant.
You
know
hammering
of
Cassandra
for
some
particular
reason
again,
not
by
design,
but
things
happen.
Other
things
we're
going
to
get
your
cluster
and
perhaps
those
other
traffic
a
quarry
that's
coming
into
at
report.
A
So
when
we
get
a
had
a
chance
to
kind
of
do
this
end
analysis
with
the
client
we
found
a
couple
things
emerge.
You
know
the
reason
that
we
were
missing
some
of
the
SLA
requirements
around
bidding.
First,
there
was
a
read
time.
Aggradation
that
had
occurred.
There
was
a
fair
amount
of
data
that
had
been
written
over
and
over
to
the
same
row,
which
was
extending
the
real
size
and
causing
that
road
to
span
multiple
system
tables
over
time,
and
as
some
of
that
data
was
deleted,
tombstones
ended
up.
A
Down
data
access
for
certain
customers
and
certain
requests,
so
not
a
guaranteed
pattern
to
happen.
There's
there's
lots
of
you
know
ways
that
you
can
experience
that
type
of
behavior,
but
it
happened
to
be
one
of
the
root
causes
that
they
discovered
was
well
a
few
of
those
data.
Access
approaches
in
those
long
reads
across
rows,
as
well
as
the
the
delete
operations
they
didn't
realize
they
were
doing
on
a
regular
basis
were
causing
some
of
those
requests
to
just
take
title
bit
longer.
A
Second,
one
was
around
some
of
the
coordination
and
I
mentioned
that
consistency
level.
They
discovered
that
you
know,
despite
what
they
thought.
There
were
some
consistency
levels
of
consistency,
all
that,
as
those
nodes
were
queuing,
those
requests.
They
would
slow
down
and
eventually
time
out
that
type
of
time
now,
of
course,
going
back
ends
up
failing
and
giving
them.
You
know
of
a
block
so
to
speak
on
our
ability
to
deliver
that
that
bidding
request.
A
In
this
case,
they
discovered
that
while
they
thought
a
node
was
actually
down,
in
fact,
it
was
just
timing
out
and
in
some
cases
it's
better
for
a
note
to
entirely
fail,
so
be
aware
of
tough
environments
where
you
might
actually
want
the
node
to
be
killed
when
it
when
it
has
that
type
of
a
behavior.
And
you
know
if
you
can
model
your
application
or
modern.
Some
of
your,
your
monitoring
to
look
for
those
patterns,
kill
the
node
entirely.
A
Let
it
come
back
up
and
don't
have
it
sort
of
sit
there
in
limbo,
holding
up
requests
and
then,
lastly,
the
data
sets
that
they
were
returning.
They
saw
that
some
of
those
access
patterns
when
they
were
retrieving
requests
were
retreating
at
a
much
larger
data
set
than
expected.
So
again,
it
kind
of
comes
back
to
it's,
not
always
a
culprit
within
the
application
or
within
the
database.
But
when
you
put
those
two
together,
you
can
see
why
the
behavior
applications
is
really
tied
closely
to
the
end
and
performance
of
the
system.
A
It's
a
great
question.
I,
don't
know
in
their
case
how
large
the
actual
size
I
do
know
that,
depending
on
the
type
of
request
they
were
serving,
they
were
keeping
track
of.
Every
request
was
served
to
a
particular
user
and
type
in
their
environment.
I'm,
not
sure
I,
don't
know,
but
I
do
know
they
were
pending
the
ropes.
They
were
adding
data
onto
the
road
and
letting
I
bro
bro
additional
rows
or
having
some
type
of
of
maximum
value.
So
off
the
cuff
I'm,
not
quite
sure
they
were
a
little
there's.
A
Some
specifics
here
that
we
couldn't
share
the
full
details
they
in,
like
those
transaction
flows,
are
close
to
to
what
their
application
was
doing,
but
they're
not
very
exact,
topology
and
and
their
exact
discussion.
So
great
question:
there's
probably
some
experts
in
the
room
that
would
tell
you
what's
the
biggest
growth
side,
you
should
be
dealing
with
or
how
many
times
to
attend,
but
I'm
not
sure
what
would
be
the
that
practice
and
I
hate
to
to
guess
at
that.
A
Ok,
the
next
application
is
one
that
actually
that
we've
developed
internally,
that
one
of
our
other
division
runs
that
it's
basically
watching
around
the
world
for
outages
and
saying
anytime,
there's
an
outage
can
lead
to
figure
out
who
are
some
of
the
downstream
dependency.
So,
for
example,
when
Facebook
authentication
login
api's
go
out
how
many
other
third-party
services
are
affected,
and
so
it's
kind
of
keeping
track
around
the
world
which
gives
you
some
insight
when
you're
using
your
own
application.
A
If
you're
seeing
you
know
a
problem
with,
you
know,
page
load,
you
can
quickly
say
well.
Is
this
a
third
party
am
I
using
a
third-party
ad
login,
you
know
type
of
services.
Constructing
your
page
front
end,
and
you
know
trying
to
understand.
Are
there
multiple
dependencies
that
could
be
in
player,
something
that's
out?
There
happens
to
use
a
bunch
of
technology.
A
In
the
background,
including
the
do
including
to
sandra's
or
to
sample
that
data
twitter-
desperate
for
long-term
analysis
and
to
give
some
trending
and
recording
so
that
we
can
tell
you
how
long
over
the
last
month
was,
you
know
particular
authentication
api
down.
As
we
know,
the
weather
is
a
very
dynamic
place
and
it's
often
surprising
to
look
at
how
many
times
there
is
a
short
outage
that
you
don't
really
you
may
not
be
aware
of,
but
depending
how
you
build
your
application
if
it
could
be
directly
impacted
by
it.
A
So
we
looked
at
this
and
said:
okay,
we
built
this
and
it's
basically
running
every
night
and
every
hour
a
set
up
a
new
job,
so
basically
MapReduce
across
the
data
set,
and
so
we
looked
at
internally.
What's
the
behavior
of
our
cluster
and
it
seemed
these
are
some
of
the
patterns
that
they
jumped
out
right
away.
A
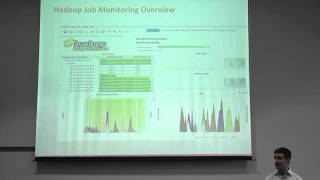
As
we
looked
at
that
high
level
view
of
the
cluster
a
couple
things
to
notice
when
you
look
at
the
top
left,
CPU
spikes
like
that,
if
you're
used
to
any
type
of
kind
of
massive
parallel
processing,
you
don't
necessarily
want
lots
of
peaks
and
valleys
you'd
like
to
have
things
fairly
normally
distributed.
So
let
you
know
I'm
using
as
much
CPU
bandwidth
and
disk
as
possible.
That's
kind
of
a
high-level
view
into
the
efficiency
of
is
my
stuff
working
well
in
a
transactional
system.
A
Maybe
that's
okay,
you're
going
to
have
peaks
and
valleys
depending
on
and
use
your
load,
but
if
you're
running
in
a
batch
processing,
you
really
want
that
to
be
maximizing
the
capacity
of
that
Parker.
So
that
looks
a
little
bit
off
looking
at
some
of
the
network
and
disk
I/o,
a
few
spikes
in
there
that
are
a
little
concerning
to
see
a
relatively
consistent
blown
on
disk,
but
every
down
and
things
get
backed
up,
which
probably
correspond
to
some
of
the
work
love
it
that's
running
on
there
and
yeah
overall
cpu
spikes
memory.
A
Maybe
it's
what's
been
written,
maybe
it's
just
tuning
of
the
cluster
itself,
so
a
couple
of
things
jumped
out
at
that
high-level
view,
but
it
didn't
really
give
you
insight
into
what
was
happening
within
the
jobs
of
themselves
in
a
produce
which
is,
you
know,
taking
essentially
a
application
and
distributing
parts
of
it
to
run
across
the
cluster
understanding
what
those
pieces
are
doing
as
they
run
as
they're
tying
a
cluster
gives
you
insight
into
know.
Is
that
hi
Cory,
you
know
poorly
written?
A
A
What's
really
going
on
behind
the
scenes,
getting
a
view
of
who's
actually
using
your
cluster
there's
a
couple
projects
that
lets
you
do
that
white
elephant
from
LinkedIn
gives
you
an
ability
to
kind
of
see
the
jobs
that
are
running.
There's
also
other
tools
that
they
give
you
that
end-to-end
view
and,
in
addition
to
a
cluster
view
that
can
help
you
drive
into
a
week.
A
They're
running
you've
got
a
batch
environment,
so
jobs
scheduled
they
run,
and
they
finish
so,
if
you're
looking
at
kind
of
a
performance
view
of
it
start
with
your
biggest
consumer,
you
know
don't
start
with
the
guy
who's
wearing
a
job.
You
know
once
a
day
once
a
week
start
with
somebody
who's
really
utilizing
a
good,
we'll
get
the
most
bang
for
your
buck
so
to
speak
in
and
try
to
optimize
what
they're
dealing
with
in
the
jobs.
Try
to
understand.
You
know
how
much
time
are
you
spending
mapping,
shuffling
and
reducing?
A
That,
of
course,
is
the
need
to
optimizing
something
like
mapreduce
understanding,
where
your
time
is
being
spent,
how
much
data
you're
having
to
move
between
those
and
ultimately
back
to
our
kind
of
original
thesis.
Why
are
we
seeing,
as
such,
you
know
kind
of
peaks
and
valleys
within
within
the
jobs
if
you
can
identify
inside
particular
area,
so
I
understand.
A
That
means
part
of
the
shuttle
phase
things
that
I
noted
here
is
that
as
we
analyze
the
job
and
looked
at
CPU
disk
and
network
utilization,
there's
a
third
tier
in
there
called
wait,
and
that's
your
classic.
Now,
you're
waiting
for
memory
allocation,
you're,
basically
waiting
for
the
infrastructure
to
come
back
and
what
we
found
during
the
shuffle
phase
was
that
there
was
a
relatively
large
amount
of
time
spent
waiting
for
memory
to
be
allocated.
A
Now
what
that
means,
as
you
start
to
diabetes
once
you
can
understand
where
that
waits
occurring,
you
can
say
all
right
in
this
case
we're
starting
to
see,
wait
on
the
shuffle
task
and
I
think
one
more
detail
here.
We
pulled
it
out
in
these
routines,
drop-top,
shuffle
of
the
input
buffer
memory
bites
and
parallel
copies.
Once
you
understand
where
that
that
weight
is
occurring,
then
you
can
say
in
fact
you
know.
A
Sometimes,
once
you
get
that
little
detail,
you
can
google
that
to
put
method
and
say
input
buffer
bites
and
you'll
find
a
lot
of
feedback
from
here's.
What
things
are
set
by
default,
but
depending
how
jobs
are
constructed,
we
know
if
defaults,
you
don't
always
work
and
once
you've
narrowed
down.
Where
that
that
weight
is
occurring,
then
you
can
say
all
right.
A
Well,
in
this
case,
maybe
I
should
increase
the
buffer
size
logically
been
waiting
on
memory
in
this
particular
party
application,
increasing
the
buffer
size,
or,
in
this
case
increasing
the
overall
memory
allocation
for
this
step
should
help.
If
you
recall,
we
looked
at
the
overall
memory
utilization,
the
cluster
we
saw
it
was
around
thirty
forty
percent
plenty
of
room,
just
a
matter
of
figuring
out
which
not
to
attune
to
get
inside
there.
A
By
doing
that,
there
was
about
a
sixty-five
percent
reduction
in
the
shuffle
time,
because
we
were
taking
away
that
memory
contention
so
little
tuning
little
tweaks
and
environments
that
are
heavily
vaginal
rings
with
like
mapreduce.
It
make
a
big
difference
once
we
have
moved
beyond
applebees
and
his
next
time
up
to
look
at
the
matching
face
in
this
case,
it's
one
of
those,
the
first
steps
that
runs
to
really
crunch
the
data.
A
That's
in
there
we
found
again
there
was
a
little
bit
of
weight
time,
not
as
bad
as
before,
but
a
relatively
large
amount
of
CPU
time
and
again,
diving
into
another
place
where
the
mapper
was
essentially
waiting
for
memory
allocation.
We
found
the
spilling
thread
and
schooling
buffer
was
ultimately
contributing
to
it,
so
by
increasing
that
buffer
size
and
giving
it
a
little
more
room
that
eliminated
the
weight
cycle,
so
little
configuration
tuning
in
this
case,
another
fourteen
percent
dropped
out
of
the
of
the
math
time.
A
Just
by
adjusting
the
buffers
once
we
realize
the
behavior
of
the
job
again,
you
know
context.
What's
my
application
doing,
a
Duke
is
certainly
different
and
that
reduces
different
than
a
pure
cassandra
note
access,
because
you're
running
a
lot
more
code
in
in
each
particular
and
each
particular
note.
So
after
these
first
two
other
fixes
that
were
more
configuration
tuning,
we
found
a
couple
of
things.
One,
the
cpu
allocation
looks
a
lot
better.
A
That's
going
to
run
out
there
so
we're
looking
at
some
of
us
it's
running
and
we
see
that
one
it's
using
the
most
amount
of
time,
which
is
a
good
thing.
It
means
we're
not
you
know,
wasting
much
recycles
on
a
framework,
but
rather
the
code
that
we've
written
is
consuming
the
time
and,
more
importantly,
it's
also
CPU
bound.
A
So
if
we
look
at
those
three
colors
again
when
the
cpu
one
was
waiting
and
the
other
words
diskin
and
network,
I
am
so
kind
of
understanding
the
behavior
of
our
application
running
a
plus
across
the
cluster.
Let
us
then
start
to
dive
in
it
and
understand.
Well,
where
was
spending
spending
time?
I
mentioned
that
in
this
case
there
were
a
couple
methods
that
were
queuing
up
most
of
the
cycles,
and
this
happens
to
be
a
whole
string
algorithm
that
splits
data.
A
So
as
you
go
in
and
write
code
that
it's
processing
a
parallel
string
processing
on
that
data,
it
is
pretty
common.
Sometimes
the
decisions
where
you
use
a
particular
library
end
up
chewing
a
lot
of
cycles
in
this
case
about
thirty
percent
of
our
timeless
was
spent
splitting
strings
which
doesn't
really
make
sense,
and
so,
as
you
look
at
where
that's
for
that
string,
split
is
occurring
and
what
function
you're
using
you
can
then
make
an
assessment
to
say
well.
A
Is
this
the
right
way
to
do
it
and
see
what
what's
really
happening
behind
the
scenes?
The
second
one
we
looked
at
and
again
this
was
about
a
look
at
the
overall
kind
of
and
added
about
another
seventeen
percent
of
the
total
group
with
the
job.
So
each
one
of
these
chunks,
because
you're
starting
at
the
most
expensive
part,
taste
a
pretty
good
cut
at
the
overall
overall
experience.
A
The
last
piece
of
pig
look
at
was
again
we're
now
to
a
point
where
we're
seeing
you
know
a
lot
of
cpu
utilization,
which
is
a
good
thing
from
a
performance
perspective.
Anytime,
you
have
high
cpu
utilization
small
code.
Changes
can
make
a
big
impact.
I
think
recursion
think
things
that
are
just
really
impactful
for
an
application,
so
understanding
we're
still
cpu-bound,
not
network
bound
or
just
bound,
is
a
good
thing
and
then
moving
on.
In
this
case,
we
had
one
other
string
kind
of
routine.
A
That's
comparing
dates
and
in
this
case
we're
using
a
resource
bundle
to
look
up
and
compared
to
to
date,
formats
back
and
forth,
and
that
that
date
compare
happened
to
load
a
fantasy
for
resource
bundles,
which
is
part
of
localization.
So
it
was
doing
a
date.
Compare
based
on
you
know
the
specific
geography
or
whatever
was
was
associated
to
the
jvm
that
was
in
a
very
expensive
way
to
pair
to
date,
objects
so
by
understanding.
Here's
a
inefficient
way
to
compare
days.
A
Is
there
a
better
way
that
preloads
any
locale
specific
information
that
little
change
added
about
a
70
production
to
the
reduced
base?
In
this
case
again,
knowing
where
to
look
understanding,
what's
tying
up
your
cycles
and
then
making
a
adjustment
from
it?
So
overall
and
we
started
off
before
we
look
at
our
own
coat
with
a
cluster
profile
approximately
like
this
again,
we
knew
CPU
usage
was
pretty
good.
A
Once
we
fix
the
buffer
issues,
we
knew
that
we're
still
running
in
about
six
and
a
half
hours,
and
there
were
still
some
behavior
where
our
overall
average
Willie
dropped
off
in
the
end
to
drop
down
to
just
about
three
and
a
half
hours
so
same
Hardware
sing
jobs
and
configuration
tuning
and
two
code
changes
to
some
string.
Algorithms
made
a
significant
difference.
You
could
have
tried
to
throw
more
hardware
at
the
problem,
increase
the
number
of
clusters.
A
If
you
were
running
on
cloud,
sometimes
that
works,
sometimes
it
doesn't,
and
it
kind
of
brings
me
back
that
scenario
of
what
are
you
going
to
try
first,
and
do
you
have
some
insight
into
where
performance
issues
actually
come
from
so
I've
known
as
well?
Some
of
the
particular
areas
that's
six
times
faster,
reduce
phase
so
you're,
not
always
looking
at
percentage
gains,
sometimes
you're.
Looking
at
order
of
magnitude
gains
more
important
on
a
distributed
system
like
mapreduce,
where
little
changes
you
know
affect
the
entire
cluster,
but
certainly
inside
of
a
sander
as
well.
A
A
You
have
different
components,
but
if
you
can
get
a
view
in
your
system,
you'll
understand
what
really
contributes
to
the
end
application.
Sometimes
it
is
a
database
configuration
issues.
Sometimes
there
are
challenges
within
the
Cassandra
cluster
other
times.
It's
really
attributed
to
the
pattern
that
has
evolved
over
time
in
accessing
or
how
that
date
has
been
distributed.
A
So
you'll
find
that,
as
you
work
more
and
more
with
newer
technologies,
there's
always
things
that
get
discovered
and
fixed
and
something
this
is
you
start
to
really
understand
what
your
usage
of
patterns
look
like
you'll,
be
able
to
to
either
improve
or
be
able
to
go
back
to
your
vendor
and
say:
here's
where
things
are
going
wrong.
Can
you
help
me
to
nor
working
helping
fix
this?
This
particular
access
problem
not
specific
than
just
the
sander.
A
If
you're
looking
at
a
no
sequel
database,
you'll
you'll
know,
as
you
start
to
use
some
of
them,
make
sure
you
pick
the
right
right
technology
for
the
right
job
and
the
different
profiles
that
you
have.
If
transactional
either
breed
right
based,
you
know
you'll
figure
out
which
ones
have
the
best
performance
for
environment
Sandra.
Facts
would
be
a
great
fit
for
a
lot
of
use
cases.
A
It's
not
perfect,
for
everything
doesn't
mean
you
should
get
rid
of
post
gray
or
my
sequel
entirely,
but
for
the
right
nice
case
it
can
be
extremely
performing
figure
out
and
likewise
in
the
MapReduce
world,
understanding
understanding
when
things
run
in
a
distributed
environment.
It's
a
little
bit
different
and
if
you've
got
developers
that
are
just
starting
to
learn
that
kind
of
parallel
framework,
you
know
the
impacts
that
they
may
not
be
able
to
see
on
stop
when
they
were
on
their
job
might
actually
end
up
being
quite
a
bit
different
out
in
production.
A
So
little
optimizations
can
make
huge
impacts
when
you
run
across
a
and
strew
different
get
map
reduce
or
for
other
parallel
environments.
With
that
I
want
to
kind
of
open
it
up
to
a
few
questions.
I
know
it's
been
a
bit
of
a
broad
view
here,
to
both
no
sequel
as
well
as
to
do,
but
any
particular
questions
or,
more
importantly,
make
any
insight
that
anybody
would
like
to
share
with
the
audience
here.
Obviously,
there's
some
experts
in
the
room
and
some
people
that
are
just
getting
started.
Some
of
the
products.
A
A
You
mean
ability
to
go
in
and
stitch
together
their
transactions
so
that,
when
you
drop
in
happy
agent
face
so
think
of
it
as
a
JVM
library
that
loads
on
each
node
in
the
application
and
then
it
discovers,
the
application
exceeds
you
that
had
deep,
deep
profiling
capability,
there's
a
pretty
wide
segment
of
a
tool
Navy
and
market
there's.
You
know
things
that
have
been
built.
A
I
spent
ten
years
that
I
did
building
software
it
and
never
used
anything
tool,
because
the
one
we
haven't
had
a
house,
it
just
wasn't
even
to
use
a
developer
spective.
It
was
very
heavy
to
instrument
the
company
that
I
joined,
actually
has
best
funny
tool,
and
so
what's
been
really
interesting,
is
to
see
the
ability
to
kind
of
drop
in
discover
an
application
profile
via
text
and
our
cluster
or
a
leaf
cluster,
and
really
get
that
same
insight
that
you
know
you
used
to
running
on
a
desktop
profiler,
converting
the
temp
Russian
environment.
A
Quick
poll
how
many
people
have
written
and
have
a
cassandra
or
no
sequel
application
running
in
production
or
maybe
coming
into
certain
production
by
say
the
next
three
to
six
months,
a
couple:
oh
good,
hands
all
right,
and
what
about
on
them
to
do
the
MapReduce
side
to
do
this
well,
a
little
bit
and
what
about
using
MapReduce
on
top
of,
say,
datacenter
price
on
your
standard?
Is
anybody
started
to
do
that
yet
a
little
bit
and
what's
been
your
experience
so
far?
Is
that
working?
Is
it
something?
That's
that's
valuable?