►
Description
Speakers: David Haines, Head of Front Office Development & Aleksa Vukotic, Head of Platform Development at Noble Group
Noble Group, a market-leading global supply chain manager of energy products, metals, and minerals uses Cassandra to power a decision-support system to assist the traders and analysts in ever-changing market conditions. In this talk, Noble will explain data modeling and querying techniques they employ to ensure high throughput and high performance data access using Cassandra.
A
David
haynes,
I'm
head
of
front
office
development
at
noble
group
and
I'm
joined
by
my
colleague,
alexis
vocotick
who's.
The
head
of
platform
engineering
we're
here
today
to
talk
to
you
about
how
we
deal
with
time.
Series
data
at
noble,
noble
group
is
a
commodity
trading
outfit.
It's
primarily
a
global
supply
chain
management.
Firm
we've
had
explosive
growth
since
1987
with
a
bunch
of
diversified
businesses,
we've
had
a
general
historic
I.t
strategy
of
buying
off-the-shelf
third-party
products
and
then
figuring
out
how
to
integrate
them
within
our
estate
and
we.
A
A
A
We've
got
a
bunch
of
other
we've
got
10
trading
systems
in
play,
we've
got
20
different
systems
around
risk,
credit
market,
etc
trade
flows,
rooting
each
system
is
responsible
for
managing
its
own
data,
so
we've
got
a
lot
of
duplication
and
a
very
difficult
time
managing
all
of
that
data.
On
behalf
of
the
business.
A
So
the
main
vision
that
we
had
was
really
to
consolidate
all
of
this
data
and
put
together
a
strategy
around
that
to
find
some
common
ground
around
what
that
data
is
what
it
looks
like.
What
is
the
nature
of
it,
and
so
we
had
a
massive
group
wide
or
firmware
effort
around
how
we
store
data,
how
we
manage
it
and
how
we
query
it
and,
as
a
result,
we
built
out
this.
We
started
to
evolve
this
global
data
platform
internally.
We
call
that
stratus
and
it's
built
on
top
of
a
microservices
architecture.
A
It's
dealing
with
what
we
refer
to
as
polyglot
persistence,
where
we
look
at
again,
as
mentioned
earlier,
the
nature
of
the
data.
So
we
look
at
time
series
we
look
at
objects
and
reference
data
and
we
have
different
data
channels
and
underlying
technologies
to
support
those
so
for
time,
series
which
we'll
be
talking
about
during
today's
session.
A
A
So
today,
again,
as
mentioned
we'll
be
talking
about
our
our
time
series
db,
we
deal
with
a
lot
of
different
types
of
time
series
data
we
deal
with
prices
with
flows
with
weather
data,
fundamental
data
supply
and
demand
and
yeah.
This
will
lead
us
into
what
the
sort
of
requirements
that
we
had
in
this
channel.
A
We
had
to
include
observations,
forecasts
and
again
across
all
different
classes
of
of
data.
We
needed
to
ensure
that
we
had
responses
within
a
maximum
of
200
milliseconds
and
that
we're
able
to
write
an
awful
lot
of
data
through
this.
So
from
our
perspective
at
the
moment,
we're
writing
one
million
points
per
day
and
that's
growing
and,
lastly,
we
needed
the
ability
to
version
data
version
data
that
was
of
interest
to
be
versioned
for
various
business
needs.
B
Okay,
as
david
said,
the
key
thing
we
wanted
to
achieve
with
storing
time
series
data
is
have
a
simple
and
unified
data
model.
With
that
in
mind,
we
started
to
think
what
is
the
minimum
data
model?
We
need
to
store
any
any
time
based
data
information,
and
this
is
what
we
came
up
with.
This
is
a
cql
schema
of
our
column,
family,
and
it
is
very
simple
and
very
self-describing.
Really
we
have
a
symbol
and
curve
which
defines
the
row
key.
B
We
have
a
timestamp
as
a
column
key,
and
then
we
have
a
double
value,
which
is
the
number
that
we
observed
for
that
particular
time
series.
While
the
key
has
two
components,
we
realize
that
a
lot
of
data
we
have
contains
an
instrument
and
target
of
what
we
are
observing
or
recording,
and
also
a
variable
of
that
that
can
be
different,
but
also
need
to
be
linked
somehow
to
the
original
target.
B
As
an
example,
you
can
think
of
a
weather
station,
let's
say
london,
and
then
you
can
measure
different
things
in
london
temperatures
max
temperature
mean
temperatures
precipitation,
wind,
wind
direction.
Anything
like
that.
In
that
sense,
london
would
be
a
symbol
or
the
target
of
observation
and
the
temperature
or
anything
will
be
the
variable
of
what
we
store
would
would
be
stored
here
in
the
in
the
curve
element
of
this
model,
and
this
can
apply
to
anything
else
as
well.
B
So,
if
you
think
about
the
prices,
you
can
have,
I
know
brand
crude
as
an
instrument,
and
then
you
observe
different
kinds
of
prices,
open,
close,
ask
beta
settlement
and
so
on,
and
so
on
and
and
also
applies
to
any
other
type
of
data
that
we
have
so
very
simple,
very
easy,
taking
whether
as
an
example,
we
have
keys
are
quite
encoded
for
us,
because
that's
how
you,
our
users,
understand
them.
So
if
you
see
here,
this
is
our
station.
B
Egl
is
a
common
weather
code
for
heathrow,
for
example,
and
our
users
would
know
that.
So
that's
why
we
include
that
in
the
key
rather
than
just
saying
heathrow-
and
the
data
looks
like
this-
it's
very
simple:
it's
a
time
series
data,
you
have
a
timestamp,
you
have
a
temperature,
and
these
observed
temperature
minimum
temperature
heat
row
during
this
period
of
of
this
year,
and
we
can
do
whatever
we
want
for
that
data.
B
B
When
you
talk
about
forecast,
you
have
an
additional
time
component
that
comes
into
place.
The
forecast
timestamp
so
have
a
forecast
timestamp,
and
then
you
have
the
actual
value
timestamps,
which
are
which
are
what
the
forecasts
are
for.
So,
for
example,
today
you'll
make
a
forecast
on
a
six
hourly
basis
for
the
next
two
weeks
and
then
you'll
do
the
same
thing
this
evening
and
then
again
the
same
thing
tomorrow,
all
for
the
same
same
stations.
B
So
the
question
was,
then:
what
do
we
do
with
this
data?
How
do
we
store
this?
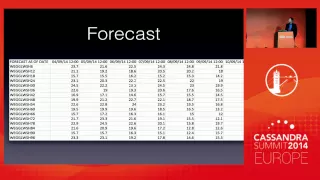
This
is
how
the
data
looks.
Like
you
see
the
forecast
dates
here
and
then
the
actual
forecast
times
in
the
column,
headers
and
then
the
the
observed
these
are
the
temperature
temperatures.
I
guess
I
think
this
also
forecasts
for
for
heathrow,
but
for
a
bit
more
summery
or
warm
september
time
earlier
this
year.
B
B
In
addition
to
the
symbol
and
curve
which
would
be
heat,
throw
and
temperature,
we
can
add
the
forecast
timestamp
to
the
row
key
and
then
have
the
forecast,
the
timestamps,
the
value
timestamps
as
columns
and
all
the
rest
will
be
the
same,
and
this
this
would
work.
It's
basically
pretty
natural
description.
So
it
looks
something
like
this.
This
is
a
bit
bit
simplified,
but
you
have
a
your
station,
then
you
have
a
forecast
date
as
part
of
your
key
and
then
you
have
time
stamps
up
up
there
for
for
all
the
values.
B
The
problem
we
had
with
this
is,
if
you
want
to
fetch
any
piece
of
information
from
cassandra,
you
have
to
know
the
row
key
and
in
this
sense
you
would
have
to
know
the
timestamp
of
the
forecast,
which
is
not
something
we
always
know
that
hansel
will
have
to
have
manage
it
somewhere
else
to
map.
What
are
all
the
forecasts
for
this
particular
station
forecasts
are
not
uniform;
they
don't
come
in
the
same
periods.
They
always
sometimes
they
run
10
past
an
hour,
sometimes
a
half
a
past
hour.
B
So
it
will
be
quite
cumbersome
to
manage
all
that.
So
we
said:
okay,
let's,
let's,
let's
try
not
to
do
that,
there's
something
simpler.
We
can
do
so.
The
idea
came
if
you
look
at
this
table,
which
is
how
you
would
see
forecast
what
about,
if
you
just
pivot
it,
if
you
just
replace
columns
with
rows
and
rows
with
columns,
you'll
get
something
like
this.
B
It's
the
same
data,
it's
the
same
table,
so
how
about?
If
you,
if
you
look
at
the
cassandra
table
like
this,
so
to
have
the
forecast
date
as
a
value
as
a
key
column
key
and
then
encode
the
actual
value
dates,
but
encode
them
in
such
a
way
that
you
can
semantically
easily
reconstruct
them
and
understand
them,
and
that's
actually,
when
we
talked
about
to
our
users
of
this
data
that
that's
actually
how
they
see
this
data,
they
see
it
as
a
set
of
offsets
from
a
different
diff
from
a
certain
timestamp.
B
So
we
could
do
this.
In
that
case,
station
and
variable
stay
is
our
symbol
and
curve,
and
then
we,
what
we
add
to
the
row
key,
is
the
forecast
offset
so
it's
six
hours
h6
for
six
hours,
for
example
in
this
example
here
and
use
the
the
timestamp
of
the
when
the
forecast
was
actually
made
as
the
column
key.
B
So
the
keys
are
now
look
like
this,
so
this
is
still
heathrow
understandable
to
anyone
who
understands
the
weather
data
and
it
has
addition
of
h6,
which
means
six
hours
ahead,
so
have
h12,
and
you
have
a
very
well-defined
semantical
model
that
you
can
actually
easily
read
what
this
actually
means.
So
you
can
also
have
d1,
which
is
a
day
ahead
or
we
w1
for
week
ahead
or
any
kind
of
offsetting
or
horizon
format.
You
want.
B
B
So
you
can
easily
get
data
like
this,
which
is
basically
how
the
in
this
example
six
hour
ahead
twelve
hour
ahead
and
a
ten
hour
head
data
forecast
is
moving
through
time,
but
what
we
lost
in
this
model
is
the
visibility
of
the
actual
forecast
on
a
given
date.
This
is
something
that's
used.
I
guess
a
bit
less
often
than
the
data
that
how
we
showed
it
here,
but
nevertheless
what
we
also
needed
is
to
be
able
to
easily
give
to
the
user.
Give
me
the
forecast
for
the
6th
of
september.
B
In
cassandra
this
means
the
slice
query
again
against
a
range
of
row,
keys
which
are
semantically
understandable,
so
you
can
easily
construct
them
and
then
do
this
and
that's
exactly
what
we
did.
We
built
something
that
user
would
easily
get
this
kind
of
information
as
well-
and
this
would
look
like
this-
these
are
the
screenshots
from
our
actual
tool,
which
they
will
talk
about
a
bit
later
briefly,
but
this
is
what
the
user
would
have
to
know.
They'll
have
to
know
their
station
code.
B
B
B
Anything
of
that
sense
of
that
sort
would
fit
into
this
model
and
what's
also
nice,
also
the
price
data,
which
is
another
big
class
of
data
that
we
deal
with
also
fits
into
this
model.
So
if
you,
if
you
anyone
of
you
comes
from
finance,
you
might
recognize
this.
So
these
are
brand
crude
contract
futures
closing
prices
on
a
different
days
in
november.
B
These
are
monthly
contracts,
so
these
here
are
actually
codes
used
in
finance
for
the
described
month.
So
this
is
january.
This
is
february.
This
is
march
in
2015.,
so
so
brent
for
delivery.
In
january
2015
the
price
is
106
dollars
and
so
on
and
so
on.
But
what
what
typically
people
would
like
to
get
from
when
they're
doing
finance
analysis
for
pricing?
They
would
like
to
see
what
they
call
the
forward
curve
of
a
brand
contract,
a
forward
curve
for
brand
contract.
B
Is
this
one
vertical
slice
of
the
data
which
is
very
similar
to
the
vertical
size?
We
did
we
seen
when
we
did
the
show
the
forecast
before
so.
In
order
to
get
this
information,
you
would
actually
use
exactly
the
same
function
and
exactly
the
same
code.
We
did
to
pull
the
forecast.
You
could
use
the
different
symbol,
obviously,
because
this
is
a
symbol
for
brent.
This
is
the
variable,
the
close
price,
and
this
is
the
forward
curve
of
brand
as
of
two
days
ago,.
B
So
what
we
got
with
this
model
is
a
very
simple
and
unified
was
most
important
model
that
we
can
rely
on.
It's
one
single
table,
one
single
column,
family,
simple,
key,
simple,
simple
row,
key
simple
column,
key
and
and
just
double
values,
and
that
applies
to
everything
we
want
to
store.
So
we
can
handle
all
every
user's
needs
for
time
varies
the
time
series
data
based
on
this
very
easily.
It's
also
very
performant,
we'll
touch
that
in
a
second,
but
it
does
work.
There
are
a
few
drawbacks.
B
Obviously
nothing
is
without
them,
and
I'll
just
mention
two
here.
One
is
that
if
you
actually
need
a
forecast
for
a
particular
date
or
this
forward
function
as
you
want,
you
have
to
read
multiple
rows,
which
is
obviously
slower
than
if
we
did
it
the
original
way,
where
you
can
read
only
single
row
and
get
it
that
way.
B
What
is
another
drawback
potential
is
that
you
have
now
limited
the
number
of
rows
you
have
for
a
forecast,
but
the
rows
will
become
wider
and
wider.
The
more
forecast
we
store
the
roads
will
be
wider
and
wider,
which
is
generally
not
a
problem.
Let's
say
you
take
a
forecast
on
an
hourly
basis,
that's
what
24
hours
a
day
times
30
times
365!
That's
not
that's
still
not
too
much.
B
When
we
started
this,
we
said
the
goal
was
to
store
at
maximum
one
minute
ticks
for
one
minute
takes
of
prices.
For
example,
that's
what
60
ticks
an
hour
eight
hour,
eight
hours
a
day
of
typical
working
day,
250
trading
days.
Typically,
that
comes
about
hundred
thousand
points
a
year,
which
means
it
take
ten
years
for
us
to
get
the
million
columns
in
a
row
which
is
still
all
right,
but
it
is
something
we
are
thinking
about
and
maybe
considering
applying
some
sort
of
sharding
of
data
for
that
sort
of
volumes.
B
A
A
This
is
the
dsl
fronted
service
that
we
can
make
that
we
make
available
through
a
number
of
different
channels
through
the
through
web
apps
through
excel,
but
obviously
through
various
programming
languages,
and
this
gives
you
an
example
of
the
sorts
of
things
that
you
know.
Our
analysts
and
trainers
can
can
quickly
build.
They
can
create
these
dashboards
where
they
can
store
formulas
for
a
given
graph
and
then
quickly
assemble
through
a
very
simple
tabbed
interface.
A
B
A
But
they
can
quickly
and
easily
enter
in
a
formula
and
see
how
that
evaluates
to
the
right,
and
it
allows
them
to
again,
as
mentioned,
apply
all
of
those
functions
defined
in
the
grammar
and
operate
naturally
on
things.
So,
for
instance,
if
we're
looking
at
an
instrument
such
as
heating
oil,
h0,
that
happens
to
be
its
root
symbol.
A
A
B
Yes,
we
have
so
what
we
have
is
roughly
40
years
worth
of
data,
but
it's
that's
of
end
of
day
prices
which
isn't
in
the
end
too
much
whether
365
points
a
day.
We
also
have
for
weather
data.
Roughly,
I
think
data
from
2007
are
which
are
which
in
most
gonna
like
to
have
one
hour
forecast.
Obviously
the
more
data
you
want.
B
The
performance
you'll
pay
a
performance
hit
really.
But
what
tends
to
happen
for
analysis
purposes.
Is
that
that
if
you
want
all
of
the
data,
then
you'll,
you
accept
the
weight
for
it.
If
you
want
to
run
a
model
through
it,
but
we
have
because
we
have
a
natural
order,
is
of
column
keys.
If
you
want
the
most
recent
data
to
do
some
quick
pricing
on
the
day,
then
the
performance
there
is
no
penalty
in
performance.
You
can.
B
C
B
B
B
Yes,
yes,
so
one
of
the
reasons
we
you're
doing
it.
This
way
is
because
we
can
easily
know
what
the
roki
should
be,
because
it
is
obviously
with
every
data
set.
We
work
with
the
end
user
to
see
how
how
they
see
the
data,
so
we
can.
We
can
store
it
basically
in
the
same
way,
so
they
can
know
it
because
that's
more
important
than
than
if
we
know
it
or
not,
but
yes,
we
do.
B
B
B
A
Yeah,
as
mentioned,
I
think
we
at
the
outset,
we
we
went
through
a
number
of
different
explanations
of
different
data
models.
You
know
we
had
a
whole
bunch
of
different
ones
along
the
way
and
ultimately
we
we
felt
that
it
was
simplest
just
to
to
stick
with
one
and
so
long
as
we
I
mean,
because,
basically,
if
the
dsl
fronted,
you
know
the
the
query
path
that
simplified
the
whole
game
for
us,
but
it's
it's
not
the
dismiss.
E
B
B
Yeah,
so
so,
if
you
want,
let's
say
a
forecast
for
so
phone
observations
that
that
just
see
as
simple
as
date
range
it's
just
you
get
the
data
agent
get
the
data
for
that
date
range.
If
you
want
to
forecast
between
the
two
days,
then
then
again,
it
is
just
a
range
only
across
a
number
of
rows
that
are
defined
by
the
by
the
offset
that
we
have.
B
B
Yeah,
so
there
will
be
a
different.
There
will
be
different
rows
because
you
know
how
we
have
the
row
would
be.
I
don't
know
footsie
index,
let's
say,
and
then
you
would
have
a
different
variables
on
it.
Is
it
close
a
day?
Is
it
ask
start
opening
price
closing
price
whatever
it
is?
There
will
be
completely
different
roles
completely
separate
from
that
perspective.
B
B
E
B
So
again,
we
started
using
cassandra
because
yeah
xander
is
nice
for
time
series
what
we
wanted
to
keep
it
as
simple
as
possible.
So
we
didn't
go
any
deep
into
the
cassandra.
We
knew
what
the
model
should
look
like
and
we
wanted
to
use
that,
but
we
haven't
really
even
tried
to
optimize
it
even
further.
We
wanted
to
see
how
this
it
would
work
with
what
we
have
at
the
moment.
It
might
be
that
we
will
evaluate
see
if
we
can
get
with
different
partitions.
B
Some
different
other
features
of
cassandra,
which
we
are
really
not
using
at
the
moment.
We
get
some
something
better,
but
what
we
want
to
constantly
just
see
how
our
model
affects
all
that.
So
from
that
perspective,
we
only
we
started
with
something
which
is
very
simple,
so
random
partition
all
the
standard
settings
and
we
kept
using
it,
and
it's
still
working
for
us,
although
we
do
have
quite
a
lot
of
data
now.
So
no
answer
is
no,
so
how.
B
Most
of
the
data
we
get
is
is
a,
for
example,
end
of
day
prices
from
all
the
exchanges,
so
that
will
come
yes,
yeah
yeah,
so
we
to
be
honest,
we
don't
have
a
metrics,
we
don't
keep
them,
but
we
get
everything
as
soon
as
we
can
and
we
we
don't
have
any
complaints
about
latency
weather
data.
We
receive
them
throughout
the
day,
so
we
have
a
forecast
made
at
6
00
a.m,
where
we
get
the
data
from
the
providers,
probably
by
6
10
by
next
minute,
or
so
it's
all
available
to
our
traders.