►
Description
The third meeting of the Arlington VA Community Facilities Study Committee featured Lionel White and John Chadwick of the Arlington Public Schools discussing school enrollment and projections. Recorded on March 11 2015. For more information, go to http://commissions.arlingtonva.us/community-facilities-study/
A
Good
evening
I'm
line
a
white
director
of
facilities
planning
with
Arlington
public
schools.
Tonight
I'll
be
presenting
a
PS
enrollment
projections
and
my
colleague
mr.
Jon
Chadwick.
He
will
give
a
presentation
on
a
PS
actions
to
address
increasing
enrollment,
but
so
I'll
start
first,
of
course,
you've
seen
this
slide.
That
shows
the
difference
between
the
county's
forecast
and
the
school
enrollment
projection.
A
A
Here's
our
first
graph
that
shows
historic,
enrollment
from
1961
to
2014,
and
it's
been
the
lines
you
see
there
in
the
graph
break
it
up
in
ten
year,
increments
or
decades,
so
you'll
notice
that
in
the
60s
ApS
had
enrollment
well
above
25,000
students.
If
you
look
at
the
period
of
the
70s
that
second
bar
there,
the
second
area,
we
see
that
enrollment
declined
dramatically.
It
went
from
about
24,000
a
little
bit
below
15,000,
so
a
decrease
of
about
10,000
students
over
a
decade.
That's
huge!
Can
we
look
at
the
80s?
A
We
see
it
kind
of
flattened
out
project
the
enrollment
hovering
around
15,000
students.
Then
we
look
at
the
90s.
We
see
a
gradual
increase
kind
of
gradually
ramping
up.
Sloping
upward,
followed
by
two
a
little
bit
of
a
flat,
a
dip
around
two
thousand
seven
Great
Recession
time
and
then
explosion
extremely
rapid
growth,
and
you
can
tell,
by
kind
of
the
slope
of
that
line
when
I
think
of
a
slope
of
the
line,
I
look
at
it
and
think
of
an
amusement
ride.
A
You
know
so
you
know
the
80s
that
wouldn't
have
been
a
very
fun
amusement
park.
Ride
right,
but
if
you
look
at
2007
and
beyond
you,
it's
going
up
it's
ratcheting
up,
and
you
know
what
you
know:
we're
going
to
have
some
fun
all
right:
okay,
here's
our
total
enrollment
over
the
past
decade,
and
we
see
that
in
2004
we
had
a
little
over.
We
nearly
19,000
students,
as
of
sep
tember
30th.
The
term
we
use
for
that
is
our
official
count.
A
Each
year
on
sep
tember
30th,
the
school
system
pulls
a
snapshot
of
how
many
students
are
in
enrollment
and
we
use
that
number
year-round
pretty
much
in
all
of
the
jalapao
materials.
So
this
year,
2014,
our
official
count
was
20
4529
we're
talking
a
growth
of
almost
50
800
students
over
the
past
decade.
That's
pretty
large
growth.
A
Here's
the
same
chart
this
time,
it's
broken
up
by
school
level,
so
you
see
at
the
bottom
of
the
chart
it
pre-k
is
in
the
yellow.
Then
we
have
kindergarten
through
fifth
grade
in
the
grade
and
again
thinking
of
that
amusement
ride.
Look
at
that
slope
going
up
and
the
more
fun
the
deeper
to
slope.
The
orange
is
middle
school
and,
lastly,
high
schools
in
the
blue.
A
Alright,
here's
our
pre-k
enrollment
over
the
past
decade
started
off
with
783
in
2004
this
year,
we're
up
to
11
08
that
the
man
for
pre-k
is
very
strong
in
Arlington.
So
in
terms
of
the
enrollment
growth
of
the
pre-k,
it's
not
really
it's
based
on
really
the
ability
for
the
state
to
provide
matching
funds
for
the
VPI
program.
We
have
a
huge
demand
for
it,
but
just
not
enough
slots
quite
honestly
for
the
man,
okay,
in
terms
of
our
pre-k
programs
that
are
available.
A
There's
the
Virginia
preschool
initiative,
aka
VPI
and
that's
a
program
where
the
state
provides
a
50-50
match
of
funds
for
students
that
participate
in
that
program.
Then
we
also
have
a
Montessori
pre-k
program
where
parents
pay
a
yearly
tuition
based
on
their
annual
income
and
then,
lastly,
their
special
ed
pre-k,
and
these
are
that's
for
students
that
are
identified
with
special
needs
and
believe
you're.
A
Not
special,
ed
pre-k
can
start
as
early
as
the
age
of
two
years
old
depends
on
how
earlier
identified
and
of
course,
pre-k
is
important,
because
our
research
shows
that
it's
reducing
the
achievement
gap
for
students
that
are
economically
disadvantaged.
As
well
as
students,
and/or
students
that
are
limited,
English
Proficient.
A
Here
we
are
with
middle
school
enrollment
over
the
past
decade,
1065
more
middle
school
students
and
just
to
give
you
some
kind
of
bearing
williamsburg
middle
school,
has
an
enrollment
or
capacity
of
nine
hundred
and
nine
hundred
and
ninety
seven
seats.
So
to
give
you
some
perspective,
over
the
past
decade,
we've
grown
the
equivalent
of
a
single
middle
schooler
largest
middle
school.
A
A
A
Here
we
have
bar
chart
that
shows
our
total
enrollment
by
grade,
and
this
is
the
H
cohort
for
this
school
year.
So
we
see
our
pre-k
cohort.
We
see
our
kindergarten
cohort
at
2196
students.
Interestingly
enough
I
put
on
here
the
12th
grade
cohort
because
I
wanted
you
to
see
the
scene,
this
year's
senior
class
that's
leaving
is
1463
students.
A
Next
year's
kindergarten
cohort
is
anticipated
to
be
above
2200,
so
you
know,
demographers
use
this
term
natural
increase
and
that's
pretty
much.
You
would
subtract,
you
take
2200
subtract,
1463
and
it
says:
there's
a
natural
increase
of
800,
more
students
and
that's
a
big
number
and
if
another
interesting
thing
to
note,
if
you
look
at
kindergarten
first
and
second,
those
cohorts
are
all
relatively
large.
If
you
look
at
9th
10th,
11th
and
12th.
Look
at
this
look
at
the
differences.
So
in
terms
of
looking
at
natural
increase
over
time,
you
see
what's
coming.
A
Okay,
here
we
have
a
chart
of
2014
enrollment
by
grade
and
now
we're
comparing
it
to
2010.
So
the
the
the
purple
line
there
shows
enrollment
in
2010
and
the
top
of
the
gray.
Their
shows
you
where
we
are
today
to
give
you
some
frame
of
reference
to
how
much
we've
grown
since
2010
is
where
we
are
since
2007.
A
A
We've
had
rising
enrollment
since
2005,
and
then
we
have
what
I
call
high
growth
enrollment
since
2008
and
I
just
want
to
give
you
some
perspective
on
that
high
growth,
most
school
systems
if
they
grow
at
two
percent
a
year,
that's
considered
high.
To
give
you
some
perspective.
Last
year
we
grew
over
five
percent,
so
that
is
really
really
really
high
growth
and
I.
A
A
Of
course,
no
one
enrollment
projection
methodology
is
universal
and
works
for
everybody.
Every
community
is
different.
They
have
different
drivers,
different
economic
conditions
that
that
determine
what
model
works
best
for
them.
We
use
again
this
great
progression
ratio,
but
we
kind
of
have
added
some
extra
data
to
it
to
make
it
better
and
I'll
talk
about
that
in
a
minute
all
right,
so
the
great
progression
ratio
it
projects
future
population
by
advancing
students
from
one
grade
to
the
next
grade
and
looking
at
the
percent
change,
and
it
takes
that
percentage.
A
A
three-year
average
of
that
percent
change
to
then
extrapolate
what
enrollment
will
be
in
the
future.
The
source
of
this
data
is
our
official
count,
which
happened:
20
sep
tember
30th
each
year,
the
reliability
of
our
model.
It's
really
good
for
the
first
five
years,
however,
it
becomes
a
little
less
accurate
years,
6
through
10,
particularly
at
the
elementary
level.
We
use
the
fall
projections
for
the
superintendence
proposed
budget,
the
spring
projections,
which
will
be
released
very
soon.
They
inform
the
school
board's
adopted
budget
and
there's
in
our
process.
A
So,
depending
on
your
projection
and
this
planning
factor,
each
school
will
be
allocated
a
certain
amount
of
funds
and
resources
to
meet
the
needs
of
students
and,
lastly,
short
term.
Enrollment.
Projections
help
us
with
facility
planning
decisions,
things
like
boundary
refinements.
Do
we
need
to
make
a
minor
boundary
tweak
this
year
too,
to
balance
enrollment
between
two
schools?
Should
we
look
at
relocating
programs
or
and
or
should
we
use
relocatable
classrooms?
A
Not
the
T
word
trailers.
So
we
don't
like
that.
Word
all
right.
Long
term
uses
of
the
projections
they
feed
into
our
apps
app,
which
helps
us,
which
is
the
Alton
facility
student
accommodation
plan,
and
that
helps
us
identify
current
and
future
seat
needs
for
students.
Then
there,
of
course,
is
the
10-year
CIP
or
the
capital
improvement
plan,
and
that
gives
us
the
capital
strategies,
capital
strategies
pretty
much.
How
do
we
build
our
way
more
seats,
how
we
build
more
seats,
more
structure?
A
A
Okay,
now
I'm
going
to
get
into
the
inputs
to
the
model.
So
of
course
there
is
a
sep
tember,
30
official
count.
Would
then
we
use
this
cohort
progression
ratio
we
use
resident
live
births.
It's
important
that
word
resident
because
we
only
care
about
Arlington
resident
live
births.
If
you're
not
a
resident
of
Arlington.
We
don't
really
want
you
in
our
model
because
it
had
you'll
inflate
our
numbers
and
you
know
Arlington
serves
all
in
10
residents,
so
its
resonant
live
births,
then
of
course
projected
housing,
growth
and
Andrew
and
the
teamed
have.
A
We
worked
very
closely
with
them
on
this
piece
of
information
for
our
model
and
I'm
thankful
for
the
great
job
that
they
do
and
having
this
information
available
in
a
GIS
format,
and
we
share
it
and
talk
and
have
great
conversation.
Lastly,
is
what
we
call
our
student
generation
factors.
That's
the
last
piece
of
the
model
and
I'll
talk
about
that.
Shortly.
All
right,
we
already
talked
about
September
30th
enrollment.
We
figure
out
how
many
students
there
are
at
each
grade,
I'm
going
to
move
on
here
to
the
cohort
progression
ratio.
A
Calculation
for
all
you
math
nerds
out,
there
included
myself
you'd
like
to
see
how
it's
calculated
so
I
had
to
put
this
slide
for
you
just
for
you.
So
we
see
we
have
our
sep
tember
30th
membership,
and
this
is
an
example
for
an
elementary
school
students
advancing
from
second
grade
to
the
third
grade.
So
in
2011
there
are
99
second
graders,
one
year
later,
2012
98
second
graders.
A
This
one
year,
average
is
point
nine,
eight,
nine
most
normal
people
say:
okay,
that's
99
percent!
There
was
a
loss
of
one
students
about
one
percent
loss
of
that
cohort
right.
So
then,
if
we
were
to
take
the
three-year
average
from
2011
through
2014,
we
see
that
the
three-year
average
is
point
996.
A
A
A
That
means
the
same
kids,
pretty
much
pass
on
12
2.99.
Three!
You
can
round
that
up
to
a
one
percent
loss
in
cohort.
So
if
there
were
a
hundred
kids,
how
many
are
coming
back
next
year,
99
we're
not
losing
a
lot.
Look
at
second,
two
third
point:
nine,
eight,
seven,
two
percent
loss
and
really,
if
you
round
that
up
one
percent
loss,
third
24.99.
A
Fourth
to
fifth
point:
99
the
thing
that
really
jumps
off
the
chart
and
I
apologize
because
I've
contributed
to
this
number.
Let's
look
at
the
8th
to
9th
1.09
that
says:
there's
a
nine
percent
increase
a
student
transition
from
the
eighth
grade
to
the
ninth
grade
and
I
said:
I
contributed
my
daughter.
We
just
became
Arlington
residents.
A
week
ago,
I
enrolled
her
into
gunston
middle
school
she's,
an
eighth
grader
I
I,
do
my
part.
I
do
my
part.
So
I
have
adjusted
the
projections
by
one.
A
Well,
you
know
that's
a
really
big
double
day
and
also
you
know,
look
at
nine
to
ten
three
percent
growth.
You
know
so
we're
essentially
we're
growing
in
the
ninth
in
the
tenth
grade
and
we're
relatively
flat
in
the
other
grades,
we're
not
losing
a
bunch
of
people,
at
least
over
this
past
three
year
period.
Okay,
that's
very
important
to
know
alright.
A
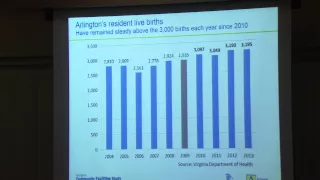
So
then
we
get
back
to
resident,
live
versus
another
part
of
our
model
and
again
these
are
children,
most
kids,
that
register
for
pre-k
or
for
kindergarten
or
five
years
old.
And
what
we
do
is
we
compare
the
number
of
kids
born
five
years
prior
to
the
current
year
and
then
compute
this?
What
we
call
birth
to
kindergarten
ratio
and
the
source
of
this
information
is
the
the
Virginia
Department
of
health.
We
get.
A
A
A
A
Nine
years
later,
our
kindergarten
capture
rate
is
seventy-five
percent.
That's
a
whopping
20
percentage
point
increase
in
the
number
of
kids
that
are
born
here
and
are
staying
here
and
you
know
that's
a
really
strong
piece
of
information.
Of
course,
Arlington
is
a
very
desirable
place
to
live
for
families,
and
that's
why
people
are
staying
here.
You
know
I've
heard
talk
of
all
your
people
going
back
to
the
suburbs.
Our
data
doesn't
necessarily
support
that
right
now,.
A
Alright,
so
then
we
get
to
projected
housing
growth
and,
of
course,
we
use
projecting
housing
growth
to
bolster
the
accuracy
of
our
long-term
projection
because
Andrew
and
the
team
they
have
all
this
wonderful
data.
You
know
that
it's
perfect,
they
tell
me
here's
the
address
and
here's
how
many
units
were
anticipating
and
then
I,
take
my
student
generation
factor
and
do
this
multiplication
and
figure
out?
Okay.
Well
this
how
many
students
we
can
expect.
A
Essentially
that's
what
we
do
on
our
process
all
right,
this
student
generation
factor
again
is
a
multiplier
and
it's
it's
a
multiplier
and
it's
based
on
the
type
of
housing
unit.
You
reside
ins.
Are
you
single
family
or
your
townhouse
or
condo
or
you
do
plex?
Are
you
garden
Department?
Are
you
elevator
and.
A
Here
are
student
generation
factors
by
housing
tight.
This
is
lashes
information
we
have
at
the
top
there.
The
housing
type
is
single-family
detached.
It's
still.
Percentage-Wise,
of
course,
is
its
number
one
fifty-five
percent
of
our
housing
stock
that
produces
students.
It's
it's.
Fifty
five
percent
come
from
single-family
detached
homes,
the
student
generation
fact
at
that
point
for
two
again:
it's
a
multiplier.
One
way
to
think
of
it
is
if
there
were
a
hundred
housing
units,
you
can
expect
42
students
from
those
housing
units.
That's
how
you
read
this.
A
So
if
single-family
detached
is
the
highest,
then
we
get
down
to
the
lowest
right
now,
which
is
condo
elevator
point
zero.
Three.
So
if
there
were
100
units
built,
not
depends,
I
know
my
people
here
in
the
county.
The
Phantom
well
depends:
is
it
affordable
or
not,
or
market
rate?
Well
right
now,
based
on
our
data
County?
What
it
would
give
us
100
units
would
give
us
three
students.
Now
this
is
a
piece
of
information,
we're
monitoring
very
closely
each
year.
A
We
need
to
know
of
that
numbers
increasing
right,
because
then,
what,
if
that
of
those?
If
the
student,
if
there's
a
change
our
student
generation
factor
at
condo,
either
elevator
or
garden
or
any
of
these,
you
know
that's
something
we
have
to
stay
on
top
of
in
order
to
give
accurate
projections
and
forecasts
or
actually
accurate
projections.
These
guys
do
forecasting
alright.
So
here
we
have
our
percent
students
by
housing
type.
It
hasn't
really
changed
that
much
over
time.
2004
51-percent
single-family
detached
students
come
from
single-family
detached
homes
last
year
about
fifty-five
percent.
A
All
right
and
here's
a
summary
of
our
enrollment
projection
inputs.
You
have
that
in
your
your
documents,
alright,
so
the
key
takeaways
are
projections,
of
course
different
than
forecast
and
that
ApS
we
actually
use
real
student.
We
use
live
verse
and
real
student
data
to
prepare
what
we
do.
We
use
three
years
of
historic
student
trends
to
anticipate
future
enrollment
change.
A
A
You
know,
thirteen
thousand
four
hundred
or
so,
and
it's
going
up
about
little
over
15
8,
almost
15
nine,
so
over
the
first
five
years
or
in
the
short
term,
where
anticipating
1500
more
elementary
students,
our
average
sized
elementary
school
now
in
Arlington,
is
about
530
seats,
1500,
more
elementary
students
by
2019
in
our
new
max
preferred
max
class
school
size,
725
seats,
that's
1500,
more
students
in
the
next
five
years,
we're
gonna
need
least.
You
know.
A
The
number
suggests
two
schools
right:
here's
middle
school
over
the
next
five
years:
approximately
1400,
more
middle
school
students,
that's
10,
art,
Williamsburg,
middle
school,
currently
largest
997
seats,
I.
Believe
the
new
preferred
max
middle
schools
about
1300
seats.
We
need
a
little
more
than
one
middle
school.
A
We
were
all
at
high
school
over
the
next
five
years:
1800
more
high
school
students,
average
high
school
around
nineteen
hundred
or
so
now
the
new
max
might
take
it
up
to
20
about
2,200
we're
saying
we
probably
gonna
need
another
high
school
notice.
I
pointing
out
the
first
five
years
because
I
could
get
into
the
last
five
years,
but
I
did
say
this
gets
a
little
more
fuzzy,
so
I
want
to
stick
with
something
that
I
feel
is
fairly
solid.
A
Here's
a
chart
that
shows
and
I
got
to
be
kidding
very
careful
when
I
say
that
this
is
our
K
through
12
countywide
projections.
This
is
one
year
you
know
from
this
year
to
the
next
year,
we're
really
good
with
our
K
through
12
one
year
projections.
The
preferred
range
is
about
two
percent.
So
ideally
we
could
be
a
hundred
percent
correct.
A
You
know
next
year,
there's
gonna
be
25
I'm,
making
up
a
number
next
year,
you're
supposed
to
be
there's
going
to
be
26,000
students,
that's
what
that's
what
happens
in
reality
and
I
should
say
it's
going
to
be
26,000
and
hit
it
dead
on.
That
would
be
a
hundred
percent,
but
that's
not
real
right
because
we
had
no
of
all
these
factors
going
on.
So
two
percent
error
is
pretty
reasonably
good.
A
So
as
long
as
we're
in
that
98
to
102
we're
in
a
safe
zone,
for
me,
I
feel
comfortable
and
say:
I
can
defend
that.
That's
respectable!
So
over
the
past
decade
our
average
pretty
much
nine
of
the
ten
years
we're
in
the
safe
zone.
We
have
one
year
yeah
barely
out,
but
our
projections
are
very
accurate,
key
takeaways.
Our
projections
are
pretty
accurate.
A
They
average
100
point
eight
percent,
which
is
saying
we're
usually
a
tad
bit
over,
but
we're
about
1%
also
about
ninety-nine
percent
accurate
over
the
past
decade
and
I've
already
showed
you
the
kind
of
the
low
and
the
high
on
that
chart
all
right
in
terms
of
enrollment
trends.
Of
course,
we're
going
to
continue,
collaborating
with
county
staff
related
to
population
and
housing
trends,
we're
going
to
pursue
collecting
more
information
from
families
when
they
register
like.
Where
are
you
coming
from?
A
And
all
these
other
questions
we're
going
to
get
that
information
as
well
as
periodically
after
your
child's
in
school?
We
need
to
follow
up
with
you
more
and
say:
hey
yeah,
another
kid
on
the
way
another
student
we
can
expect.
You
know
that
kind
of
thing.
Also.
We
want
to
I'm
collaborating
with
other
school
planners
here
in
the
greater
metro
area
and
we
all
kind
of
get
together
and
we
swap
stories
and
hey.
A
This
is
what's
happened
in
my
area
and
you
know
the
goal
is
to
network
and
try
to
improve
our
methodology
by
looking
at
other
people's
problems
and,
lastly,
we're
going
to
continue
to
use
GIS
mapping
technology
and
hopefully,
our
ability
to
map
out
things
like
housing
trends
and
different
types
of
patterns
that
will
help
improve
our
long-range
forecasting
efforts
all
right
now,
I'm
going
to
pass
it
on
to
mr.
Jon
Chadwick.
A
B
You
Lionel
your
hard
act
to
follow
I'm
Jon,
Chadwick,
I'm
assistant,
superintendent,
for
facilities
and
operations,
I'm
going
to
show
you
one
more
chart
and
then
that's
the
last
one
I'm
going
to
show
this
evening.
It's
hard
to
follow
all
of
these
charts,
so
we're
going
to
look
at
maps.
You
know
the
one
thing
that
distinguishes
Arlington
public
schools
needs
and
what
controls
us
that
distinguishes
us
from
the
county
is
that
we
are
legally
obliged
to
take
every
child
that
shows
up
at
our
doors.
B
We
have
no
choice,
who
are
in
big
trouble
if
we
don't
and
we
obviously
always
have
taken
them.
We've
been
dealing
with
growth.
You
can
see
from
these
charts
for
the
last
really
since
about
nineteen.
Ninety,
it's
been
going
up,
there's
a
little
bit
of
a
dip
in
the
Ernies
and
I
think,
but
I
think
a
lot
of
the
people,
probably
in
this
room
and
in
the
community,
haven't
been
following
it
that
long
I
certainly
wasn't
here
when
that
started
and
aren't
really
aware
of
what
we've
been
doing.
B
The
school
board
has
continuously
monitored
this
situation,
since
it
started
growing
I'm,
not
going
to
say
anything
about
the
schools
we
gave
back
in
the
70s
and
80s.
Actually,
some
of
them
we
would
love
to
have
back
again.
Some
of
them
are
really
small
and
really
wouldn't
help
us
very
much
so
we're
going
to
look
at
the
at
the
last
20
years
and
take
a
look
at
what
the
school
board
actually
did.
There's
a
key
here.
The
purple
flags
are
new
construction.
B
The
teal
colored
flags
are
reopening
with
a
renovation,
the
green,
our
renovations
and
additions,
the
orange
of
boundary
adjustments
and
then
the
reddys
program
moves
or
other
classes
and
programs.
So
in
starting
in
1994
we
completed
in
addition
and
renovation
at
taylor.
I
will
say
that
was
a
geothermal
project.
We've
just
replaced
some
of
that,
but
the
steel
film.
Our
system
is
centrally
working
and
it's
our
best
performing
School
in
the
county.
B
In
1995
we
reopened
gunston,
which
had
closed
in
1978
and
clairmont,
which
had
closed
around
the
same
time.
I
believe
the
gunston
was
used
by
the
county
and
claremont
was
a
police
training
facility
that
so
that
reopened
as
an
elementary
school
in
95
in
1998,
the
school
board,
completed
renovations
and
additions
at
key
and
tuckahoe
elementary
schools.
In
two
thousand,
there
was
a
renovation
and
addition
completed
a
Barrett
elementary
school
2001
renovations
at
Drew
and
oakridge,
and
most
of
these
renovations
added
capacity
and
we
reopened
Hoffman
Boston
with
a
renovation.
B
It
had
been
closed
as
well.
In
2002,
carlin
springs,
school
was
constructed
and
completed
next
to
kenmore,
Glen
Colin
was
reopened
after
a
renovation
as
Campbell
and
Claremont
was
reopened
again,
as
the
second
countywide
spanish
immersion
program.
We
also
in
that
year
completed
renovations
in
additions
at
Jamestown
and
Williamsburg.
B
B
There
was
a
renovation
and
addition
at
glebe
completed,
and
there
was
a
policy
change
to
create
a
neighborhood
and
cluster
school.
At
barrett
in
2005
there
was
a
policy
change.
We
move
the
CIP
to
10
years
to
align
with
what
the
county
doesn't
as
you've
seen.
Those
are
the
numbers
we
produce
in
2009.
New
construction
was
completed
at
washington-lee.
That
was
a
complete
reconstruction
of
an
occupied
building
in
multiple
phases.
B
That
school
was
designed
initially
for
1,600
students
using
the
schedule
that
was
planned
initially,
which
was
a
utilization
factor
of
using,
on
average,
every
classroom,
five
out
of
seven
periods.
During
the
day
when
we
open
that
school
or
shortly
after
it
was
opened,
the
school
board
approved
a
planning
model
or
a
scheduling
model
of
using
each
space,
six
out
of
seven
periods.
We
recently
completed
a
study
last
year
on
washington
lee
and
how
was
actually
being
used,
and
we
found
that
that
sixth
seventh
wasn't
happening.
B
A
next
September
not
this
year,
but
the
following
year,
we'll
be
able
to
accommodate
2,200
students,
we're
in
the
process
of
working
through
the
same
process
at
a
Yorktown
and
Wakefield,
and
we
fully
expect
to
be
able
to
get
with
similar
amount
of
effort.
Similar
amount
of
money,
hopefully
less
another
300
students
at
each
of
those
schools
and
that's
without
doing
any
additions.
B
B
Second
stage
was
to
look
at
increasing
class
size
and
that
I
believe
has
happened
once,
if
not
twice
since
then
other
other
models
are
to
add
relocatable
classrooms
and
then,
after
you've
gone
through
all
of
those,
then
you
make
additions,
renovations
and
new
schools
and
in
fact,
we've
been
following
that,
and
we
constantly
find
that.
Yes,
we
can
still
get
more
students
in
existing
schools
without
necessarily
overcrowding
them
or
in
any
way
diminishing
the
learning
that
goes
on
in
the
schools.
B
So
now
we're
at
2013.
I
think
this
is
wrong.
Jefferson
was
finished
earlier
than
that,
but
there
were
renovations
and
additions
to
Jefferson
and
then
again,
the
complete
reconstruction,
except
for
two
small
pieces
of
yorktown
high
school,
which,
when
it
opened,
had
a
capacity
of
about
1,900
students
and,
as
I
said,
we'll
go
to
2200
2013.
We
completed
Wakefield
same
issue
there
that
was
completed.
B
We
have
the
McKinley
renovation
and
addition
project,
which
will
add
about
240
students
to
the
McKinley
campus,
and
that
was
out
to
bid
and
is
scheduled
to
be
completed
by
sep
tember
of
2017
we
have
just
about
to
approve
the
school
would
is
just
too
about
to
approve
concept,
design
for
the
abington
renovation
edition,
that
will
add
189
seats,
but
also
do
a
major
renovation
of
the
school.
And,
as
you
know,
the
debate
continues
on
as
to
how
we
provide
the
other
seats.
B
B
Other
actions
that
we've
done
to
increase
capacity
are
several
boundary
change
adjustments.
We
relocate
a
number
of
programs
that
are
countywide
programs.
We
relocate
them
to
spaces
where
there
are
in
schools
that
are
available,
but
we
also
relocate
them
to
approve
instructions.
So
we
try
to
cluster
them
together,
so
that
the
teachers
and
the
students
can
support
one
another.
We've
added
relocatable
zwi
have
about
120
for
today
we're
beginning
to
move
them
around.
B
As
we
finish
new
seats,
we
can
take
them
away
and
put
them
in
other
locations
and
we've
increased
transportation
options
to
allow
some
schools
to
be
used
more
fully
with,
as
and
I've
also
mentioned,
we've
increased
class
sizes,
so
some
takeaways
from
that
we
have
monitored
continually,
monitor
current
and
future
capacity
and,
as
Lionel
has
shown
you
crowding
grows,
goes
through
the
schools
as
each
school
level.
As
those
cohorts
progress,
we
have
different
solutions
at
different
school
levels
and
the
issue
is
finding
the
right
combination
of
solutions.
There
isn't
any
one
solution.
B
There
are
many
solutions
to
to
this
issue.
Future
changes
are
going
to
require
boundary
adjustments.
The
only
time
that
a
school
district
doesn't
have
to
look
at
boundary
adjustments
is
when
there's
no
growth.
As
long
as
this
growth
we're
going
to
be
looking
at
gap,
boundary
adjustments
because
we've
we
build
schools,
we
have
schools,
we
have
to
fill
them
and
we
have
to
distribute
the
students
equally
equitably.