►
From YouTube: 2016-JUN-23 -- Ceph Tech Talks: OpenATTIC
Description
A detailed update on the current state of the OpenATTIC integration for Ceph.
http://ceph.com/ceph-tech-talks
A
Welcome
back
everybody
to
your
second
monthly
tech
talk
this
month.
You
get
the
bonus
one
from
sage
on
Tuesday
and
if
you
did
manage
to
miss
that
one,
it
should
be
showing
up
on
the
SEF
Tech
Talks
page
as
a
link,
as
well
as
the
SEF
Tech
Talks
youtube
channel
under
the
SEF
account
within
the
next
few
minutes
here.
So
definitely
check
that
one
out,
if
you
missed
it,
but
today
we're
here
to
listen
to
Len
screamer
from
open,
addict
talk
about
the
integration
between
SEF
and
open
addict.
So,
let's
take
it
away
all.
B
B
So,
thank
you
very
much
Patrick
for
having
me
and
for
the
invitation
to
share
a
bit
about
the
work
that
we're
doing
here.
I'm
lens
I've
joined
the
company
behind
open
ethic,
which
is
called
IT
Novem
about
almost
exactly
a
year
ago,
I
started
in
July
last
year,
I've
been
with
in
the
linux
and
open
source
space
for
quite
some
time.
I
first
started
dabbling
with
Linux.
B
During
my
studies
in
in
computer
science
in
95,
I
think
I
worked
at
souza
for
four
years
back
in
the
last
century,
I
spent
quite
some
time
with
mysql
started
there
as
an
engineer
later
turned
into
becoming
their
community
relations
manager,
yeah
stuck
with
them
through
the
acquisition
by
sun,
microsystems
and
also
oracle,
have
been
doing
basically
the
same
job
just
with
three
different
companies
yeah.
I
work
from
home
in
hamburg,
germany,
so
at
seven
p.m.
at
the
moment,
beautiful
weather
out
there.
B
B
The
subject
is
safe
and
storage
management,
with
oak
natick
I'm,
going
to
cover
the
general
storage
management
part
a
bit
more
briefly
and
then
dive
into
the
work
that
we're
doing
with
safe
management.
Okay,
so
let's
get
going
yeah,
let's
start
with
the
vision
and
maybe
also
giving
you
a
bit
of
a
context
where
we're
coming
from
malden
ethic
has
been
around
for
about
five
years.
By
now,
it's
it
started
its
life,
as
so
many
open
source
project
as
an
internal
tool
that
was
created
to
scratch
a
particular
age.
B
In
this
case,
it
was
triggered
by
the
prices
that
were
asked
by
traditional
storage
vendors
for
well
Sarge
array.
So
if
you
ask
a
net
app
or
an
EMC,
to
give
you
a
quote
for
a
storage
system,
they
charge
quite
significant
amounts
of
money
and,
interestingly,
it
also
scales
with
the
amount
of
data
you
want
to
store
in.
So
in
today's
world,
where
your
data
is
growing
at
such
a
rapid
pace
and
the
prices
were
quite
ridiculous.
B
It
novum,
the
company
is
a
spin-off
of
a
more
traditional
factory,
oriented
company
and
they
were
running
their
IT
infrastructure
and
they
are
still
doing
that,
but
they
have
also
started
outsourcing
and
doing
consulting
and
various
projects,
and
one
of
them
nowadays
is
open
attic
which
is
being
yes
marketed
as
a
storage
management
product.
So
but
they
started
creating
a
tool
arm
based
on
the
fact
that,
well,
if
you
take
a
look
at
the
Linux
distribution,
it
always
was
quite
capable
to
fulfill
storage
requirements
and
serve
various
purposes
right
out
of
the
box.
B
So
if
you
take
a
linux
distribution
nowadays-
and
it
gives
you
everything-
you
need
to
set
up
a
very
sophisticated
storage
system
be
its
using
sambhar
for
safes
or
NFS
through
the
Linux
kernel
itself,
you
have
various
file
systems.
You
can
choose
from.
You
have
I
skazhi,
fiber
Chen.
All
these
things
are
already
packaged
included
and
could
be
used
to
create
a
storage
management
system.
B
However,
the
big
challenge
really
comes
when
it
girl
gets
around
to
finding
people
that
are
actually
capable
of
managing
all
these
various
components
and
then
setting
up
these
services
in
a
scalable
and
secure
fashion
and
also
automate
things
so
that
creating
new
storage
or
new
shares
is
easy
and
can
be
done
by
basically
everybody
in
the
segment
team
and
not
just
one
guy.
So
what
you
usually
end
up
with
is
either
people
writing
their
own
shell,
scripts
or
well.
We
may
use
other
tools.
Of
course,
open
attic
is
not
alone
in
this
space.
B
Of
course,
open
etic
by
itself
is
also
capable
of
managing
multiple
nodes
in
this
kind
of
configuration.
So
if
you're
seeing
a
server
can't
host
enough
this,
you
simply
put
aside
a
second
server.
Stick
more
disks
to
it,
and
an
open
attic
will
take
care
of
them
with
with
the
senior
management
framework.
So
you
don't
have
to
install
open
attic
twice
but
Weber
the
users.
B
We
also
looked
at
things
like
cluster,
for
example,
if
that
would
be
a
suitable
match,
but
in
in
the
for
the
sake
of
simplicity
and
then
not
to
broaden
the
scope
too
much,
we
basically
set
it
down
on
using
SEF
as
the
answer
for
customers
that
exceed
the
boundaries
of
a
single
system
and
need
more
storage
space.
So
yeah,
that's
what
we
started
open
attic
itself
is
open
source
software,
some
more
details.
B
B
Since
a
year
ago,
quite
a
lot
of
things
have
actually
changed
when
it
comes
to
open
attic
and
we
are
currently
working
on
version
2
of
the
software,
which
also
started
sometime
last
year
and
along
with
the
blue
major
version
number
bump.
That's
quite
a
lot
of
change
taking
place
and
one
of
the
significant
ones
for
for
us
as
a
business
is
that
we
basically
decided
to
get
rid
of
the
previous
split
that
we
had.
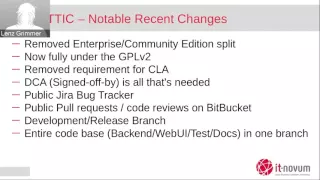
B
If
you
want
to
contribute
to
open
attic,
you
basically
were
required
to
sign
a
CLA
first
in
order
to
allow
us
to
actually
make
this
new
licensing
happening.
We
got
rid
of
all
of
that.
Open
attic
is
now
fully
another
GPL,
all
the
components
that
used
to
be
separate
or
proprietary
have
been
merged
into
one
product.
It's
just
open
attic
with
abs,
any
distinction
between
different
editions
and
the
the
business
of
course
changes
as
well.
B
So
now
the
focus
is
really
just
on
providing
the
services
and
least
these
kind
of
things
around
the
software
and
not
just
plain
selling
software
licenses,
as
it
used
to
be
the
case
along
these
lines.
We
also
try
to
be
a
good
citizen
and
not
just
create
a
piece
of
software
that
happens
to
be
an
an
open-source
license,
but
we
we
are
looking
into
generating
and
creating
a
community
of
users
around.
That
is
not
just
a
community
of
users
but
becomes
a
community
of
contributors,
so
the
essential
infrastructure
parts
that
you
need
to
have
here.
B
For
example,
it's
a
public
bug
tracker.
We
basically
opened
up
the
JIRA
instance
that
we've
had
cleaned
it
up,
rearranged
a
lot
of
things
and
made
it
visible
to
the
outside.
So
you're
now
able
to
submit
bug
reports,
you
can
comment
on
existing
issues,
give
us
feedback
in
any
way.
We
also
changed
the
way
how
the
development
process
takes
place
before
most
of
the
development
took
place
in
house,
and
the
only
result
that
you
ever
saw
was
a
new
release
coming
out
every
once
in
a
while.
We've
no
switch
to
a
monthly
release.
B
Schedule
on
the
development
takes
place
in
the
open
with
the
traditional
processes
like
pull,
requests,
public
court
reviews
with
approvals.
We
also
make
use
of
different
branches.
We
now
have
what
we
call
the
release
or
default
branch,
which
is
supposed
to
be
always
in
a
stable
state
where
all
tests
pass,
and
we
could
basically
at
any
point
in
time,
cuddle
release
and
in
submitted
by
being
pretty
confident
that
it
has
no
regressions
or
serious
issues.
Most
of
the
development
takes
place
in
the
development
branch.
B
So
if
a
new
developer
works
on
a
new
feature,
the
development
branch
is
the
one
that
he
uses
for
his
own
development
branch
and
fork
to
work
on
stuff
em,
and
we
we
have
set
up
a
Jenkins
instance
that
performs
automated
tests
on
the
code
base
and
only
if
all
of
these
tests
pass
emerged
from
development
into
the
release
branch
takes
place.
We
also
merge
the
the
code
base
previously
things
like
the
web
user
interface,
documentation
tests,
the
the
the
Enterprise
Edition
bits.
All
of
these
were
splattered
across
multiple
mercurial
repositories.
B
This
has
all
been
into
a
single
repo,
so
now
you
could
basically
create
a
new
feature,
including
their
corresponding
tests,
plus
updates
to
the
documentation
within
a
single
commit.
So
you
can
make
sure
that
all
parts
and
all
components
are
always
in
sync
and
are
synchronized
with
each
other.
So
quite
a
lot
of
internal
changes,
process
changes
that
have
taken
place,
but
then,
of
course,
also
on
the
product
side
itself
on
version,
2
shows
a
few
new
things
that
we've
worked
on.
B
So
the
protocols
I've
just
mentioned
before
NFS
ifs,
I,
skazhi
fibre
channel,
you
won't
likely
see
us
managing
containers
or
installing
an
instance
of
own
cloud
or
running
as
bit
torrent
server
in
the
background
and
things
like
that,
and
there
are
other
projects
which
are
more
suitable
for
this
kind
of
tasks.
We
want
to
keep
the
focus
on
managing
storage,
but
doing
this
job
proper
and
in
the
right
way
the
choice
of
the
GPL
means
you
really
have
no
real
restrictions
on
how
you
use
the
code
and
what
you
do
with
it.
B
In
fact,
we
really
want
to
encourage
others
to
take
a
look
at
it
and
and
use
it,
maybe
for
storage
appliances
and
do
their
own
branding
if
they'd
like
to-
and
we
are
quite
liberal
in
giving
the
code
away
and
making
sure
that
it
yeah
grows
in
adoption,
so
no
arbitrary
restrictions
and
functionality,
especially
when
it
comes
to
this
size
of
the
amount
of
storage
that
you
can
manage.
We
couldn't
care
less
how
much
disks
you
have
in
your
system,
it's
based
on
clean
Linux
and
the
tools
that
come
with
the
operating
system.
B
So
we
take
a
very
close
look
at
the
automation
of
things
and
make
sure
that
us
an
administrator
can
achieve
results
quickly
without
having
to
go
through
too
many
hoops
or
even
having
to
learn
about
command
line.
Utilities
also
may
be
unique
to
us,
even
though
it
gives
us
a
lot
of
pain.
Is
that
we
support
multiple
Linux
distributions.
We
started
with
debian
ubuntu.
This
is
where
our
roots
are,
since
last
year,
we've
added
support
adding
rel
seven,
including
derivatives
like
scent
or
scientific
linux,
and
so
on.
B
Also
at
the
end
of
last
year,
we
added
support
for
suse
linux.
Now
that
we
had
made
the
switch
to
RPM.
This
was,
fortunately
a
bit
easier
than
the
initial
part
arm,
so
we
we
think,
we've
pretty
much
covered
the
most
prominent
distributions
that
you
would
find
in
a
data
center
nowadays,
and
that,
of
course
gives
us
a
very
well-established
technology
stack
and
also
a
very
well-rounded
and
tested
solution,
especially
when
it
comes
to
hardware
support.
We
can
safely
rely
on
the
vendor
and
asking
the
customer
to
take
a
look
at
their
preferred.
B
B
Well,
it
it
was
quite
sophisticated
and
very
feature-rich,
but
it
also
was
quite
overwhelming,
so
for
a
new
administrator
trying
to
quickly
fulfill
a
task,
and
he
said
he
still
needed
to
know
the
sequence
and
the
order
in
which
he
had
to
perform
steps
to
achieve
his
goal.
For
example,
let's
take
an
example:
you
wanted
to
create
a
network
share
on
Samba.
You
would
first
have
to
create
a
logical
volume,
then
added
file
system.
B
Also
a
drastic
change
for
version.
2
is
that
we
have
added
a
restful
api
version.
1
dot
x
used
xmlrpc.
Instead,
we
hope
that
the
RESTful
API
makes
it
a
bit
more
approachable
for
developers
that
want
to
automate
their
processes
and
the
web
UI
uses
the
rest.
If
you
interface
exclusively
so
everything
it
can
be
done
through
the
web,
UI
could
also
be
performed
using
well
curl
or
a
generic
python
shell
script.
B
All
on
the
lower
levels
we
basically
use
lvm
to
manage
larger
groups
of
disks,
also
built
in
by
default,
is
synchronous
mirroring
of
devices
using
drbd.
So
the
goal
is
that
you
can
create
a
volume
or
share
and
simply
add
a
checkmark
or
maybe
select
a
host
as
a
target,
and
we
will
set
up
the
rbd
in
the
background,
so
the
volume
is
being
synchronously
replicated
to
a
second
machine
for
availability
purposes.
For
example,
as
I
said,
we
have
multi-node
support
built-in,
so
open
ethic
is
aware,
if
other
nodes
need
to
be
managed.
B
B
It
will
also
be
monitored
by
default,
so
we
create
the
respective
yes
check,
scripts
and
and
and
the
services
and
make
sure
that
now
just
takes
care
of
managing
of
monitoring
that
device
as
well
and,
of
course,
no
getting
from
away
from
traditional
storage
and
the
whole
part
about
self
management
and
monitoring
which
is
underway
yeah.
This
is
lettuce
currently
or
key
focus
of
development.
We
spent
quite
a
lot
of
time,
especially
since
the
beginning
of
this
year,
on
making
sure
that
the
safe
support
and
is
yeah
getting
better
and
increasing.
B
They
do
have
their
own
safe
distribution
and
and
they
are
looking
into
using
open
attic
as
a
potential
management
front
end
for
for
this
product.
So
they
have
dedicated
developers
now
working
with
us,
adding
more
features,
giving
us
good
feedback
and
guidance
on
what
we
should
focus
on
first
and
so
far.
This
has
really
helped
us
to
to
pay
the
long
way.
B
Right
now,
the
majority
of
the
developers
are
employed
by
IT
no
home,
so
we're
making
quite
a
significant
investment
here.
But
of
course
the
intention
is
that
we
will
manage
to
kind
of
build
a
community
of
users
around
it.
That
will
at
some
point
not
only
just
maybe
report
bugs
but
start
looking
into
the
code
and
start
contributing
smaller
improvements
and
feedback,
and
things
like
that.
But,
admittedly
we
are
still
in
the
very
early
stages
here.
B
So
maybe
I
don't
know
if
it's
an
advantage
or
disadvantage
by
the
way
we
want
to
approach
is
that
when
we
start
with
the
infrastructure
and
framework
first,
when
once
we
have
a
basic
implementation,
we
start
with
an
initial
prototype
of
how
the
UI
could
look
like
when
it
comes
to
displaying
self
information
and
once
that's
out,
we,
we
solicit
feedback
and
want
to
get
guidance
input.
If
that's
useful
of
you
should
revisit
the
UI
design
or
make
changes
accordingly
to
make
it
more
suitable
for
the
task
at
hand.
B
Getting
a
bit
more
deeply
into
the
technical
components
that
open
it
in
consists
of
the
back
end
itself
is
written
in
Python.
We
use
the
jungle,
I'm
application
server
and
using
the
jungle
rest
framework
on
top
to
provide
the
API
django
doesn't
do
any
serving
of
web
pages,
and
the
web
UI
is
a
separate
piece
of
java
script,
which
is
written
in
angularjs
using
the
bootstrap
framework.
B
So
we
use
jungle
models
to
basically
a
yet
define
the
various
storage
objects
and
their
relations
to
each
other,
and
then
at
some
point.
We
need
to
kind
of
yeah
make
sure
that
the
changes
that
we
wanted
to
make
actually
take
place
and
we
have
a
separate
process
which
is
called
open,
attic,
systemd
and
that
runs
with
root
privileges,
and
that
gets
the
information
from
jungle
and
nose
or
and
the
instructions
of
what
task
needs
to
perform.
Be
it
writing
out
a
configuration
file
or
creating
a
file
system
or
starting
or
stopping
a
service.
B
Things
like
that
I
said
nagios
or
a
singer
are
used
in
the
backend
for
monitoring,
and
we
use
the
pnp
for
nagios
extension
to
write,
em
graphs
and
install
performance
data
in
our
rd
files.
So
you
can
both
monitor
and
define
thresholds
that
that,
where
you
can
receive
notifications-
and
we
also
use
p
and
p
for
now-
use
to
create
a
nice-looking
graphs
that
you
can
take
a
look
at
yep,
so
the
web
front-end
angularjs
uses
the
REST
API
completely
fresh
design.
B
You
won't
probably
go
out
in
they
look
very
different
or
the
new
UI
looks
pretty
much
different
to
the
old
one.
It's
very
elegant
and
yeah
makes
use
of
a
lot
of
JavaScript
trickery
here.
Also
worth
mentioning
when
it
comes
to
components,
is
that
open
ethic
is
well
very
well
tested,
at
least
that's
what
we're
aiming
for.
We
have
a
strong
focus
on
on
adding
tests
and
making
sure
that
open
that
it
can
be
tested
in
a
fully
automated
fashion.
B
So,
on
the
low
end,
we
add
chitin
unit
tests
that
test
individual
python
modules.
We
have
a
dedicated
test
suit
that
we've
developed
by
ourselves
named
gattling
that
performs
rest
api
tests.
So
these
things
can
be
automated
quite
easily,
but
we
also
have
a
test
suite
based
on
protractor
the
test,
the
web
UI
itself,
so
we
basically
automate
a
web
browser
to
click
on
elements
and
make
sure
that
the
UI
returns
the
expected
results.
B
B
Here's
a
visual
presentation
of
the
architecture,
starting
from
the
top
you
have
the
web
UI
or
any
other
client
application
that
is
capable
of
speaking
rest
through
HTTP,
be
the
Python
script
curl.
Whatever
you
want,
then
you
have
the
Django
application
with
the
Django
models.
The
information
about
these
models
is
persisted
in
the
Postgres
database,
and
here
on
the
right.
You
can
also
see
how
we
are
communicating
with
a
safe
cluster
and
I'm,
going
to
elaborate
on
that.
B
Then
we
have
the
the
dreaded
OA
system,
Lee
dreddit,
because
of
the
confusing
name,
because
it
has
nothing
to
do
with
Leonard
pattering
systemd.
This
process
runs
in
with
root
privileges
and
receives
some
commands
from
the
jungle
occasion.
We
are
d
bus
and
then,
on
the
other
hand,
it
basically
issues
shell
commands,
so
it's
capable
of
running
commands
with
parameters
for
for
certain
functionality,
for
example,
when
it
comes
to
ice,
cassie
fibre
channel
and
we
make
use
of
Li
oh
and
there
python
bindings.
So
there's
a
dedicated
Python
library
that
we
use
here.
B
So
we
don't
have
to
issue
shell
commands
and
have
to
pass
out
put
that
makes
life
a
bit
easier,
but
it
always
depends
on
the
purpose
at
hand
and
right
now,
many
of
the
automation
is
done
in
system
ly.
By
simply
calling
shell
commands
and
of
course
they
are
also
tracked
in
a
log
file.
So
you
can.
If
something
goes
wrong,
you
can
take
a
look
at
the
command
log
and
see
if
there
was
an
error
from
any
of
the
tools
or
scripts
as
we
run.
B
Okay,
let's
come
to
the
key
part
of
this
presentation,
know
that
we've
covered
the
basics
and
where
we
come
from
safe
management.
So,
as
I
said,
we
came
to
the
conclusion
that
SEF
is
the
answer
for
users
of
open
ethic
that
are
looking
for
solutions
to
scale
data
across
more
than
just
a
single
machine
and
end
are
anticipating
rapid
data
growth.
It
simply
can't
be
kept
up
with
single
disk
service.
B
So
one
thing
that
we've
realized
pretty
early
on
is
that
well,
on
the
one
hand,
SEF
does
a
lot
of
things
by
itself
and
is
pretty
autonomous,
but
then
again
it
also
requires
lots
of
hand-holding
and
well
right.
Now.
Most
of
these
things
need
to
be
done
on
the
command
line
using
the
built-in
command
line
utilities,
and
it
provides
quite
a
high
level
of
complexity.
B
They
are,
of
course,
an
of
tools,
because
we
are
not
the
only
one,
realizing
that
and
others
scratch
that
itch
much
earlier
I'm,
the
de
facto
to
probably
here's
calamari,
since
it
was
developed
by
the
surf
Hawks
themselves,
Intel
started
creating
the
Intel
virtual
starch
manager
vsm
a
few
years
ago
already
and
that
one
is
pretty
full
featured
and
yeah
quite
impressive.
Other
people
have
looked
into
more
of
the
operation
monitoring
point
of
view.
Safe
dash
is
a
nice
candidate
here,
and
that
gives
you
a
web-based
dashboard
displaying.
B
There
are
the
key
performance
parameters
of
the
entire
cluster,
so
some
of
them
are
limited
in
functionality.
Others
again
you
don't
really
know
where
they're
heading
or
they
have
been
abandoned,
or
that's
just
a
single
developer
doing
that
in
his
spare
time.
So
none
of
these
really
fit
the
bill
or
were
an
acceptable
starting
point
for
us,
especially
since
we
wanted
to
have
both
the
the
safe
management
part,
but
it
also
should
have
or
needed
to
integrate
with
the
traditional
storage
management
puppet
open
and
it
provides
so.
B
So
the
goals
that
we've
defined
is
that
we
want
to
not
only
create
a
monitoring
GUI
tool,
so
not
yet
another
dashboard,
but
also
a
tool
that
allows
you
to
to
actively
manage
the
safe
cluster
in
such
a
way
that
you,
as
an
administrator,
really
want
to
use
it.
And
it's
not
getting
in
your
way.
That
is
really
one
of
the
key
design
goals
that
we
want
to
get
into
that
functionality
should
help
you
to
get
your
job
done.
B
He
should
be
able
to
quickly
drill
down
and
figure
out,
what's
actually
going
on
and
how
it
can
be
resolved.
So,
especially,
this
area
will
require
some
significant,
more
amount
of
work.
We
are
still
in
the
early
stages
here,
also
a
key
point
for
us.
You
should
still
be
able
to
run
yourself
command
line
tools
with
automatic,
getting
confused
that
basically
summarizes
it.
B
So
if
you
start
or
if
we
would
have
started
using
open
ethic
and
and
and
jungle,
as
is
the
the
first
approach
that
we
were
thinking
of,
where
we're
simply
modeling
the
entire
safe
cluster
as
django
models
in
the
database
and
persisting
all
the
information
in
Postgres,
but
considering
the
amount
of
churn
and
how
quickly
the
SF
cluster
by
itself
changes
its
face.
So
to
say,
and
we
realize
that
it
will
become
quite
tricky
to
keep
the
data
in
the
database
consistent
with
reality
and
yeah.
B
So
we
need
to
first
come
up
with
a
way
of
how
to
use
jungle
with
our
existing
infrastructure
and
still
manage
a
dynamic
thing
like
a
safe
cluster,
where
in
comparison
to
what
we
did
before,
there
is
no
automatic
instance
running
on
each
many
of
the
safe
notes,
but
also
something
that
we
don't
want
to
do.
You're
not
required
and
should
not
be
required
to
install
open
addict
on
each
machine.
That's
part
of
SF
Custer,
that's
simply
not
possible.
B
Okay,
further
research
when
it
comes
to
the
implementation
revilla
that
well,
the
first
question
is
okay:
how
do
you
manage
yourself
as
to
what
API
can
you
use?
So
we
started
looking
at
calamari,
especially
the
calamari
server
pod.
It
was
later
spun
off
and
if
you
look
at
the
architecture
of
how
calamari
is
built,
you
will
realize
that
it's
pretty
similar
to
how
open
ethic
looks
like
it's
also
a
Django
application
and
it
uses
a
separate
process
in
the
background
to
perform
tasks.
B
The
rest
api
also
meant
that
for
availability
purposes,
you
would
be
able
to
kind
of
set
up,
maybe
to
calamari
server
instances,
and
then
you
need
to
figure
out
how,
on
which
of
these
nodes
is
the
rest
api
currently
located
you,
you
will
need
to
have
a
load
balancer,
so
it
somehow
sounded
to
us
that
this
is
way
too
much
work
and
overhead,
and
we
we
drop
the
idea
pretty
later
on
and
of
course,
well,
it's
a
distributed
system.
What
kind
of
tools
are
available
to
manage?
B
Oh,
maybe
getting
back
to
the
management
API
in
first,
as
I
mentioned
before,
we
now
settle
down
on
using
liberators
and
lip
RVD
for
the
time
being.
This
gets
us
quite
hard
for
the
initial
steps
that
we
have
in
mind.
We've
defined
several
kind
of
stages
in
which
we
want
to
tackle
the
whole
self
management
tasks
and
with
liberators
and
lip
already.
We
also
get
quite
far
and
and
once
we
have
reached
or
have
accomplished
everything
that
we
want
to
implement
there.
The
next
step
is,
of
course,
okay.
B
How
do
you
work
with
the
remote
nodes?
What
can
you
do
to
make
changes
on
a
remote
system
and
of
course,
there
again
are
quite
a
number
of
tools
available
that
you
can
choose
here.
You
could
either
use
plain
as
this
agent
and
run
shall
commence
there,
and
then,
of
course,
you
have
a
wide
choice
of
deployment
toward
Salt
puppet
and
civil.
B
We
basically
decided
to
go
with
salt
in
particular,
because
this
is
something
that
Souza
work
uses
and
they
have
the
expertise
and
give
us
guidance
and
assistance
here,
but
we
still
want
to
maintain
other
options
if
possible,
but
for
now,
then
the
initial
implementation
will
be
then
using
salt.
So
anything
that
requires
remote
execution
on
any
of
the
safe
notes
will
be
performed
using
saltstack.
B
Also,
we
want
to
not
only
manage
or
monitor
the
entire
clusters
health,
but
we
also
want
to
monitor
how
the
individual
nodes
are
doing.
If
there
is
a
problem,
if
there's
a
memory
shortage
or
if
the
network
bandwidth
is
being
exceeded
or
if
a
disk
is
failing,
things
like
that,
you
need
to
have
local
monitoring
running
on
each
of
these
nodes
to
capture
this
information
and
collect
it
and
right
now
it
well.
B
We
are
using
nagios
on
the
open
attic
instance,
but
we
think
of
Nagas
of
a
bit
of
a
too
complex
and
heavy
solution
to
be
running
on
all
the
notes.
So
collect
d
is
likely
the
tool
that
we
will
be
using
here,
at
least
that's
the
the
direction
of
research
that
we're
currently
looking
into
and,
of
course,
that
whole
thing
needs
to
be
scalable.
B
So,
especially
with
monitoring
and
capturing
and
performance
data,
you
need
to
make
sure
that
you're,
not
saturating
any
node
or
or
creating
any
kind
of
bottleneck,
see
with
the
amount
of
data
that's
being
generated.
So
there
are
still
a
few
interesting
to
interesting
challenges
to
tekla
here,
and
our
first
step
when
it
comes
to
monitoring,
is
really
just
monitoring
the
safe
cluster
and
with
what
you
can
obtain
through
liberators
and
and
set
health,
basically
so
similar
to.
B
What's
F
dash
is
doing,
and
we
took
quite
a
lot
of
inspiration
from
from
what
he
is
doing
them
that
this
work
is
currently
in
progress
and
we
hope
to
have
an
initial
draft
of
the
dashboard.
Well,
maybe
you
should
bite
sometime
next
week
and
we
have
a
project
going
on
or
an
event
where
we
will
be
focusing
on
unsafe
development
I'm
going
to
talk
about
that
in
the
latest
line.
B
Oh
yes,
so
one
of
the
things
are
challenges
that
I
just
mentioned
is
that
for
consistency
reasons
we
decided
not
to
Permian
to
possess
data
in
the
local
Postgres
database,
but
we
still
wanted
to
maintain
the
possibility
of
using
all
the
nice
things
that
Django
gives
us
with
general
models
or
what
we
came
up
with.
We
dubbed
it
no
debe
models,
they
look
and
feel
like
jungle
models,
but
their
way
they
obtain
information
and
how
they
start
is
they
use
an
arbitrary
API.
B
So
this
whole
jungle
know
d,
be
back
in
architecture
and
framework
is
in
place
in
a
few
months
ago,
but
that
took
us
some
time
to
get
right,
but
now
we
have
a
foundation
that
allowed
us
to
quickly
build
on
top
of
it
and
the
open
Attic
rest
api
no
provides
a
quite
wide
range
of
em
ratos
calls
that
you
can
perform.
We
took
the
calamari
rest
api
kind
of
as
in
not
really
as
a
template,
but
you
can
see
it
has
been
inspired
by
what
what
calamari
is
doing
with
their
s.
B
B
We
can
list
ports,
Oh
SDS
and
our
BDS
and
their
various
details,
so
we
have
table
views
for
these
and-
and
the
next
step
of
course,
is
not
only
being
able
to
view
all
these
elements
but
make
changes
to
them
edit
details
create
new
ones
or
delete
existing
one.
So
these
are
the
next
steps,
know
that
we've
kind
of
the
basic
infrastructure
in
place
and
cluster
health
and
performance
monitoring
and
creating
a
dashboard.
B
So
we've
now
extended
the
the
nagios
support
that
we
have
in
our
back-end
already
so
open
ethic
is
capable
of
well
creating
arbitrary
nagas
configurations
for
things
like
disks
or
volumes,
and
things
like
that
and
we've
now
extended
it
to
create
yeah.
The
monitoring
configuration
for
the
safe
cluster
itself,
so
safe
health
will
be
tracked
and
we
also
create
rrd
files
to
keep
track
of
long
time
information.
So
you
can
take
a
look
back
and
see
the
history
of
how
your
cluster
has
been
doing
a
longer
time
ago.
B
So
far,
open
ethic
then
used
our
are
these
to
generate
PNG
images
using
our
rd
tool
and
then
just
displayed
the
static
PNG's
embedded
in
the
web.
Page
related
to
the
information
that
wants
to
display
with
the
upcoming
Seth
dashboard,
we
are
taking
a
slightly
different
approach
since
well,
let's
face
it
our
ID
to
PNG's
look
kind
of
they
came
from
last
century.
They
have
been
around
for
quite
some
time.
They
display
all
the
information
you
need,
but
we
wanted
to
make
it
a
bit
more
interactive
and
a
bit
more
modern
in
a
way.
B
So
you
get
a
much
more
interactive
display
of
these
graphs
and
you
can
dynamically
zoom
in
and
out,
and
then
you
simply
get
much
more
flexibility
with
using
javascript
in
the
browser
to
work
with
this
data,
and
one
of
the
things
that
added
early
on
is
support
for
managing
more
than
just
one
set
custom,
so
in
most
users
and
customers
likely
just
have
one.
But
in
the
case
you
have
an
environment,
there's,
maybe
a
test
or
development
in
the
production
setup.
B
B
B
As
you
see,
there
are
still
a
lot
of
blanks
aware,
but
by
no
means
fully
done
with
that,
yet,
but
all
for
each
of
these
squares.
Basically,
you
will
find
a
JIRA
issue
in
our
tracker.
That
explains
what
we
are
trying
to
accomplish
with
a
description
of
what
the
outcome
should
look
like
if
their
sign
also
have
a
web
page
on
our
public
wiki.
That
basically
summarizes
all
the
issues
and
gives
kind
of
a
roadmap
and
kind
of
a
flow.
So
this
is
what
we
are
currently
working
on
or
half
an
hour
near-term
plans.
B
So
next
thing
that
would
be
the
most
visible
change
for
likely
is
the
dashboard
that
we're
working
on
right
now,
including
performance
graphs.
So
one
of
the
design
decisions
that
we've
made
here
is
that
compared
to
some
other
dashboards,
we
don't
want
to
basically
show
full
live
data,
so
some
of
the
dashboards
basically
start
once
you
open
the
web
page,
they
start
querying
the
safe
cluster,
and
then
you
see
a
graph
slowly
building
up.
B
B
If
you're
talking
about
you
raised
your
coded
versus
replicated
in
and
what
have
not
them,
I
admit
I'm,
not
that
deeply
familiar
with
in
the
innards
of
offset
by
itself,
and
we
are
quite
grateful
that
with
suz,
we
now
have
a
partner
who
does
have
engineers
working
on
this
F
cluster
and
they'd
also
have
customers
with
large
real
life
clusters
and
real
life
problems
as
well.
That
give
us
good
use
cases
to
look
at
set
of
s.
B
Of
course,
now
that
jewel
is
out
is
a
very
interesting
aspects
that
many
users
are
interested
in
further
down,
of
course,
Radha's
gateway
management,
creating
users,
creating
buckets
and
then,
of
course,
the
whole
thing
of
not
just
managing
an
existing
safe
cluster
like
we
currently
assume
but
being
go
to
to
start
adding
more
notes
by
by
ourselves
and
configure
them,
and
this
is
where
the
whole
thing
with
with
saltstack
comes
into
play.
So
as
a
prerequisite
for
getting
started
with
that
work,
we
need
to
have
the
basic
salt
framework
in
place.
B
So
we
have
the
models
in
jungle
that
define
various
entities
and
we
well.
We
need
to
get
started
somewhere.
Maybe
we
start
with
being
able
to
start
and
stop
services
on
remote
host
or
something
like
that.
That
depends,
but
it
will
be
something
that
will
evolve
over
time
and
we
will
stick
to
our
monthly
release
cycle
and
we
hope
that,
with
each
release
you
will
see
another
bit
of
self
management
monitoring
showing
up.
B
That
gives
you
a
chance
to
take
a
look
at
it,
give
us
feedback,
and
then
we
may
take
the
next
sec
to
refine
and
hone
it
and
make
sure
that
it
works.
As
expected,
here's
the
link
to
the
public
road
map
since
I
can
share
my
screen.
I
will
quickly
switch
to
a
web
browser
to
give
you
a
glimpse
of
how
that
looks.
I
hope
that
works,
but
not
interesting,
maybe
I
have
to
stop
the
presentation
first.
Well,
somehow
I
can't
switch
to
the
web
browser.
B
Let's
continue
with
the
slides,
Oh
brilliant
sorry
about
that.
I
think
we're
right
here.
So
yes,
I'm
the
whole
self
management
roadmap
is
on
the
wiki
and
we
use
at
lation
confluence
as
the
wiki,
which
gives
us
very
nice
features
like
pointing
to
JIRA
issues,
and
once
you
resolve
your
issue,
the
wiki
page
will
also
automatically
reflect
the
state
of
that
issue.
B
Achmed
saw
the
wiki's
by
no
means
complete
yet,
but
this
is
the
action
items
that
we've
defined
here
already
gives
us
plenty
of
work
and
stuff
to
work
on
for
the
next
month.
So
this
roadmap
also
is
a
living
document
that
will
be
extended.
It
expand
it
and
also
it's
likely
that
priorities
or
all
the
sequence
in
which
real
tackle
things
might
change
depending
on
on
user
feedback.
B
Also
in
consideration
of
the
time
I
have
a
few
screenshots
for
you
to
take
a
look
at,
and
you
will
get
a
few
links,
including
a
link
to
our
a
live
demo
that
you
can
take
a
look
at
later
on.
So
if
you
log
into
open
ethic,
the
first
thing
you
see
here
is
our
storage
management
dashboard,
and
this
is
still
the
quote.
Traditional
storage
management
side
or
one
of
the
things
that
might
be
worthwhile.
B
So
all
of
the
widgets
that
you
see
here
and
you
will
be
able
to
drag
them
around
and
resize
them
and
the
webview
I
will
keep
your
selection
stored
in
your
web
browser.
So
the
next
time
you
log
in
and
the
layout
will
look
exactly
as
you've
left
it
and
we
also
think
of
maybe
creating
some
pre-configured
layouts
to
choose
from
so
you
don't
always
have
to
start
from
scratch.
B
Safe
poulos,
that's
how
it
currently
looks
like.
So
you
can
see
it's
a
table
view,
starting
with
the
name
of
the
pool,
pool,
ID,
sighs
utilization
placement
groups.
Although
of
the
various
aspects,
and
if
you
click
on
an
item
on
the
list,
you
get
more
detailed
view
underneath
the
table
here,
yeah,
that's
basically
the
initiative
you
that
we've
created
and
based
on
feedback
and
suggestions.
We
are
open
off
of
maybe
reducing
the
amount
of
information
displayed
by
default
of
rearranging
the
fields
or
maybe
we're
missing
some
information
that
you
think
is
crucial.
B
One
of
the
things
that
I
am
keen
on
adding
here
for
examples
that
you
are
able
to
sort
the
list
by
various
heading,
so
particularly
probably
by
the
amount
of
space
use.
So
you
can
click
on
it
and
you
see
this
the
pool
with
the
witch
with
the
highest
and
fill
level
right
on
top,
so
you
can
make
sure
that
you
can
do
something
about
it.
This
is
the
initial
step
at
an
OSD
list
here,
listing
the
names
of
the
OS
DS
on
the
host.
They
are
running
on
and
test
status.
B
Just
let
us
know,
but
the
thing
is
we
have
a
certain
level
of
knowledge
about
self
ourselves.
By
now,
we
do
have,
of
course,
people
at
souza
giving
us
good
guidance
and
feedback,
but
we
are
also
interested
in
hearing
more
about
practical
use
cases
and
people,
giving
open
etiquette,
try
and
and
telling
us
about
kind
of
the
gotchas
they
run
into
all
the
things
that
they
would
like
to
see.
B
So,
at
this
point
from
we
are
in
an
early
stage
which
allows
you
to
really
grow
with
us
and
then
make
sure
that
you
leave
your
impact
and
get
your
requests
in
early.
This
is
a
screenshot
of
how
the
volume
management
currently
looks
like
and
ender.
For
example.
Here
you
can
see
from
from
a
server
disk
and
the
P&P
for
novios
graphs
that
we're
using
here
using
our
rd
tool.
B
So
far
as
I
said,
the
the
open
attic
web
UI
uses
the
the
rest
interface
exclusively
to
communicate
with
the
open
attic
back
end.
And,
of
course,
if
you
browse
the
the
API
endpoint
with
the
web,
browser
itself
documenting,
you
can
click
on
on
the
various
sub
link,
so
to
say,
and
you
get
a
list
of
options
and
things
like
that.
B
But
if
you
are
a
developer
and
you
want
to
create
a
small
script
that
performs
or
automates
a
certain
task
like,
for
example,
creating
a
share
or
a
storage
volume,
or
something
like
that,
one
way
to
do
it
is
you
enable
our
API
recorder.
Then
you
perform
the
steps
that
you
want
to
get
done
by
clicking
on
them
in
the
UI
and
once
you
are
happy
with
the
result,
you
click
stop
and
the
API
ricotta
we'll
wrap.
B
B
As
I
said,
I've
just
returned
from
the
opensuse
conference,
which
takes
place
in
Nuremberg
Germany
this
week
and
immediately
afterwards,
oozer
has
scheduled
what
they
call
their
hack
week,
which
basically
gives,
through
the
employees
yeah
almost
two
weeks
of
time,
to
start
hacking
on
a
project
that
they
identified
by
themselves
and
they
can
work
on
basically
whatever
they
want.
It's
a
bit
similar
to
what
Google
used
to
do
in
the
past,
when
employees
had
a
day
in
the
week,
working
on
a
side,
project
and
Suzy,
a
quick
has
been
taking
place.
B
So
we
can
hash
out
in
a
quick
plan
before
you
submit
it
to
the
heck
week
website
and
and
then
we'll
be
around
the
entire
next
week
to
basically
coach
and
guide
you
and
yeah.
Hopefully
you
have
some
fun
and
you
learn
something
and
in
the
end,
will
come
up
with
a
piece
of
code
that
we
can
then
integrate
in
the
open
NT
code
base.
So
that's
the
plan
for
next
week.
We
look
for.
B
Here's
the
usual
link,
dump
open
ethic
dark
is
basically
the
website.
You
need
to
follow
all
the
links
from
there
are
listed
there
as
well.
The
live
demo
is
on
demo
open
ethic
dialogue.
It
is
going.
It
is
refreshed
on
the
top
of
the
hour,
so
don't
be
confused
if,
if
you're
working
on
it
and
and
all
of
a
sudden,
your
instance
is
being
restarted
and
looks
pretty
new
again
docsis,
maybe
something
worthwhile
mentioning.
We
use
some
restructure
text
and
sinks,
so
the
usual
way
of
how
documentation
is
done
in
the
Python
world.
B
We
are
not
using
get
and
use
github
and
we
are
a
mercurial
shop
and
we
are
hosted
on
bitbucket,
but
if
you
are
familiar
with
get
and
and
the
concepts
behind
it,
mercurial
shouldn't
be
a
big
hug
for
you,
yep
retweet,
we're
on
google+,
and
with
that
I
think
I
can
leave
it
open
for
questions.
If
you
have,
I
don't
know
if
that's
actually
possible
patrick,
but
if
there
are
any
questions
I'm
going
to
stop
my
screen
sharing
now.
B
B
So,
as
I
said,
we
want
to
focus
on
the
practical
things
first,
so
it's
also
helpful
guidance
for
us
if
you're
running
a
surplus
that
what
are
the
usual
things
that
you
run
into
and
where
would
you
expect
more
help
from
a
two-leg
open
attic?
So
if
you
have
ideas,
suggestions
or
if
you
think
we're
missing
something
on
the
road
map,
please
let
us
know
any
other
questions.