►
Description
What can our collaboration networks tell us about the health of our projects? From the spread of innovation to the spread of disease, the field of social network analysis has examined a dizzying array of interactions and framed them as a network. As we work together to solve problems in software, our collaboration effort can also be described as forming a network as well. In this talk, Kaylea applies network analysis ideas to the world of open source. This unlocks powerful tools for analyzing collaboration at scale. She'll be reporting results of her research to understand the relationship between collaboration network structure and whether a project is thriving or barely surviving.
A
Hello
chaos,
con
2022,
I'm
kaley
champion,
I'm
a
phd
candidate
in
communication
at
the
university
of
washington.
Today,
I'm
going
to
be
talking
about
collaboration
networks
and
project
health.
So
how
is
it
that
some
of
our
most
important
pieces
of
software
are
shared?
Digital
infrastructure
falls
into
disrepair
and
neglect.
A
Today,
I'd
like
to
give
you
an
update
on
some
work,
I
shared
with
you
at
last
chaos
con,
including
some
emerging
results
from
my
dissertation.
This
is
a
true
work
in
progress.
New
results
were
emerging
all
the
time,
I'm
eager
for
feedback,
so
we
might
hope
that
the
software
we
rely
on
the
most
would
also
be
the
best
quality.
But
that's
not
always
the
case.
Some
components
we
depend
on
can
be
neglected.
That's
a
phenomenon
called
under
production.
A
This
sketch
shows
how
we
might
think
about
underproduction,
this
relationship
between
the
supply
of
high
quality
software
and
the
demand
for
that
software
in
the
form
of
importance
when
quality
is
high,
but
importance
is
low.
We
would
call
that
overproduction,
not
a
problem
other
than
the
potential
for
wasted
effort
alignment.
We've
got
a
match
between
quality
and
importance.
That's
the
ideal
case,
and
we
have
a
particular
concern
when
software
is
heavily
used,
but
relatively
low
quality.
That's
a
problem!
That's
under
production
importance
is
high.
A
Quality
is
low,
so
this
heat
map
shows
some
underproduced
packages,
kind
of
those
at-risk
components.
I
identified
doing
a
study
of
debbie
and
linux.
Those
are
all
kind
of
at
the
bottom
here
and
what
I'll
be
showing
you
today
is
all
about
these
factors
that
seem
to
be
associated
with
this
underproduced
software,
but
I'd
be
happy
to
chat
with
you
further
about
how
I
found
these
at-risk
packages
to
begin
with
all
right,
so
we
might
have
a
few
ideas
about
how
important
software
comes
to
be
neglected
and
you'll,
see.
A
A
A
A
A
On
the
other
hand,
we
see
c
plus
plus
doing
a
little
bit
worse
than
pearl
these
days.
In
terms
of
the
how
usage
of
the
packages
written
in
this
language
compare
to
the
importance
of
those
packages,
python
and
java
seem
to
do
about
the
same
as
one
another,
but
still
a
little
bit
of
an
area
for
concern
all
right.
So
the
age
of
the
language
is
not
the
only
factor
to
consider
there's
also
when
the
package
itself
was
written
languages
change
through
time
so
to
packages.
A
So
what
we
see
is
underproduction
kind
of
characterizing
packages
that
have
been
in
debian
for
a
long
time
and
then
falling
off
as
more
recently
as
the
package
was
added
more
recently.
That
said,
some
of
these
1980s
languages,
like
pearl
c
plus,
seem
to
be
doing
relatively
rece
relatively
worse
in
recent
decade.
A
Okay,
so
another
suggestion
that
we
might
make
for
explaining
under
production
is
all
about
the
size
of
the
maintainer
community.
But
I
found
an
interesting
result
here.
If
we
just
count
the
number
of
maintainers
just
unique
entries
in
the
maintainers
field,
having
one
unique
entry
seems
to
outperform
larger
groups
and
that's
a
little
bit
concerning,
but
when
we
kind
of
divide
maintainership
into
styles,
we
see
a
couple
different
distinctions.
A
Just
taking
that
unique
approach
is
not
enough,
because
a
unique
maintainer
can
be
a
single
person
or
it
could
be
a
pseudonym
of
a
larger
group
of
folks,
maybe
a
subgroup
within
debian,
the
games
team,
the
sort
of
utilities
team,
or
what
have
you
many
different
individuals
might
be
pitching
into
the
package,
maybe
a
little
bit
willy-nilly
or
it
might
be
a
mix
of
a
group
as
well
as
some
individuals.
So
we
need
to
break
apart
these
numbers
just
a
little
bit
more
to
so
they
can
make
some
sense
for
us.
A
So
these
are
the
four
categories:
I'm
using
right
now,
solo
team
loose,
no
group
mixed,
that's
a
mix
of
group
and
individuals
and
I'm
identifying
groups
based
on
whether
or
not
it's
a
mailing
list
versus
an
individual
email
address.
That's
listed
as
the
maintainer
contact
and
that's
a
kind
of
typical
within
debian
to
use
a
mailing
list
or
use
an
individual
all
right.
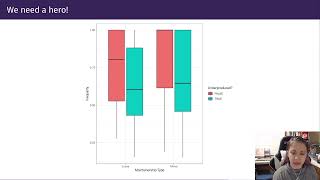
So
if
we
break
it
apart,
based
on
that
maintainership
style,
we
see
that
loose
organizat
loosely
organized
groups
do
poorly
compared
to
the
other
styles.
A
If
we
use
a
market
share
perspective
about
who's
serving
as
the
maintainer,
what
their
kind
of
duration
is
of
maintainership,
we
can
think
about
that
market
share
as
having
a
kind
of
inequality.
Maybe
somebody
kind
of
has
owned
the
package
for
most
of
its
life,
but
occasionally
other
people's
people
kind
of
pitch
in
versus
lots
of
kind
of
different
folks,
a
rotating
cast
of
characters
serving
as
the
the
maintainer,
and
what
we
see
is
that
underproduced
packages
in
kind
of
this
bluish
greenish
color
here
are
characterized
by
kind
of
more
equality
and
leadership.
A
What's
this
mean
that
means
we
don't
have
a
single
kind
of
strong
leader
kind
of
taking
the
maintainership
role
for
long
periods
of
time.
Instead,
it's
handing
off
between
different
folks
and
we
see
the
same
result
here
between
the
loose
model
and
the
mixed
model,
so
leadership
counts.
Leadership.
Matters
is
how
I
would
kind
of
conclude
from
here
next
up.
My
last
angle
of
attack
is
collaboration
networks.
So
debian
is
a
network
of
folks
who
work
together.
A
People
might
contribute
in
one
place
or
in
several
places
and
when
they
close
bugs
in
multiple
packages,
we
might
think
of
that
as
forming
a
network.
Drawing
packages
that
share
contributors
closer
together,
pushing
those
with
no
people
in
common
further
apart-
and
this
kind
of
messy
example-
is
five
packages
with
the
word
mutt
in
the
name.
Mutt
and
neo.
Mutt
right
here
are
close
together,
which
is
not
surprising,
because
one
is
a
fork
of
the
other.
A
As
a
network
lets
us
bring
out
a
lot
of
network
analysis
measures,
thinking
back
to
those
two
categories
of
struggling
packages
loose
and
mixed,
we
see
in
both
cases,
instead
of
being
helpful,
as
we
proposed
being
centrally
located
closely
related
to
other
packages
by
means
of
sharing
the
same
people
is
a
predictor
for
under
production,
and
I'm
thinking
of
this
as
a
sign
that
these
projects
are
essentially
drawing
water
from
a
shared
well,
the
more
they
share.
Folks
with
others,
the
more
we
perhaps
see
maintainers,
who,
as
individuals,
are
just
too
thinly,
spread
alright.
A
Modern
technology
helps,
but
it's
not
a
guarantee
and
some
communities
with
aging
technology
stacks
do
better
than
the
average
organizations
help,
but
individuals
can
do
quite
well
and
taking
the
lead
can
make
a
big
difference
when
many
people
are
pitching
in
unless
that
lead
person
is
spread
too
thinly.
So
what
are
my
next
steps?
I'm
continuing
to
refine
these
measurements
building
models
to
try
to
control
for
different
factors
working
to
validate
these
results
with
communities
like
you
under
sort
of
unpacking
these
sources
of
under
production.