►
Description
No description was provided for this meeting.
If this is YOUR meeting, an easy way to fix this is to add a description to your video, wherever mtngs.io found it (probably YouTube).
A
The
next
group
that
we
have
is
assessing
city-owned
properties
in
Pittsburgh.
This
group
was
led
by
dr.
David
Miller
from
the
Graduate
School
of
Public
and
International
Affairs
and
spearheaded
here
within
our
department
by
our
colleague,
Laura
Mike
cyl.
So
with
that,
this
group
has
taken
a
look
at
a
city,
a
variety
of
city,
property
information
that
currently
resides
in
a
variety
of
different
departments
and
what
the
team
has
been
able
to
do
is
to
aggregate
that
information
into
a
synthesized
database.
A
That
is
easier
to
view
and
also
has
provided
some
really
significant,
recommend
gate
recommendations
for
us
to
consider
as
department
leadership's
with
regards
to
how
we
manage
data
going
forward.
So
with
that
I'd
like
to
invite
up,
excuse
me
Rick,
Hopkinson
and
Ellie
Newman
to
present
the
assessing
city-owned
properties
in
Pittsburgh,
so
Rick
Kelly.
B
So
where
are
we?
Where
only
started?
The
city
had
a
very
fragmented
and
sort
of
decentralized
system
for
managing
its
buildings.
So
you
know:
different
departments
had
different
spreadsheets
or
websites
where
they
kept
various
information,
but
if
something
changed
in
one
department
spreadsheet,
that
information
was
not
updated
across
the
whole
city,
and
so
they
realized
that
this
was
really
holding
them
back
as
far
as
you
know,
seeing
how
they
could
reduce
energy
use,
seeing
how
they
could
operate
more
efficiently
and
things
like
that.
B
So
that's
where
we
came
in
so
our
goal
was
to
take
this
very
fragmented
system
and
create
a
integrated,
integrated
database
that
would
synthesize
all
of
that
information.
So
the
deliverables
that
we
came
up
with
one
was
the
database.
We
also
did
a
codebook
and
database
manual.
We
created
a
GIS
map
layer
and
then
we
also
did
some
preliminary
energy
analysis
and
benchmarking
report.
B
So
this
is
a
screenshot
of
my
laptop
when
I
opened
everything
that
we
got
at
the
very
beginning.
So,
as
you
can
see,
some
of
these
spreadsheets
one
of
them
just
had
fire
houses
and
the
years
that
they
were
built.
One
of
them
had
some
energy
information
and
addresses,
and
some
had
energy
information
on
a
website.
So
it
was
really
all
kind
of
you
know
all
over
the
place
really,
and
so
we
went
from
this
to
this
new
database
system.
So
this
is
just
a
snapshot
of
what
the
database
looks
like
this.
B
Here
is
one
of
the
police
headquarters
and
you
can
see
that
we
have
a
photograph.
We
actually
had
a
team
of
students
that
drove
all
around
Pittsburgh
and
took
photographs
of
all
the
buildings
that
they
could
find
so
I
think
we
have
pictures
for
something
like
150
buildings
and
then
there's
different
tabs
within
this.
So
one
of
them
has
building
usage.
So
what
departments
use
the
building?
How
many
square
feet
things
like
that?
Another
one
is
energy
information.
We
got
energy
information
from
the
city's
portfolio
manager,
energy
benchmarking
website
for
the
year
2013.
B
B
We
created
a
code
book
that
goes
variable
x,
variable
and
explains
how
we
got
the
data
where
it
came
from
any
flaws
or
any
problems
with
collecting
the
information
and
then
the
manual
pieces
that
explains
how
to
use
it.
So
if
someone
isn't
as
comfortable
with
access
and
they
want
to
just
have
a
spreadsheet,
you
can
easily
export
just
the
fields
that
you
want
and
take
it
from
there.
If
you
decide,
you
want
to
add
more
fields
or
things
like
that,
the
manual
explains
exactly
how
to
do
that
with.
C
The
energy
data
that
the
city
has
through
portfolio
manager,
which
is
a
way
to
record
their
their
energy
use
of
through
their
energy
bills,
they
create
what
they
call
on
energy
usage
intensity
and
that
is
normalized
by
the
square
footage
of
the
building.
So
it
makes
it
comparable-
and
this
is
just
a
shot
of
the
different
energy
surge
intensities
of
the
different
buildings
in
the
city
of
Pittsburgh.
C
And
then
we
also
create
a
GIS
map
that
sort
of
plots
the
highest
and
lowest
energy
efficient
buildings
in
the
city,
so
notice
up
here,
the
medic
10,
that's
pretty
high
I
think
we
put
on
the
top
5
the
top
five
biggest
energy
consumers.
We
actually
labeled
on
the
map.
All
over
bath
house,
I'm
shanley
park
skating
rink
go
ahead
in
like
le
alluded
to
most
of
our
time.
Spent
with
this
project
was
really
I'm
creating
this
database
and
creating
three
unique
identifiers
that
the
departments
can
use
to
search
for
buildings
and
compare
across
department.
C
So
you
have
the
building
code,
you
have
the
parcel
ID
number
and
the
lot
and
block
number,
but
we
also
want
to
provide
the
city
with
some
recommendations
on
what
they
can
do
to
move
forward
to.
You
know,
increase
their
energy
efficiency.
So
that's
where
sort
of
some
of
the
bench
Morgan
came
in,
so
we
looked
at
some
different
cities
across
the
United
States
who
have
already
passed
energy,
benchmarking,
disclosure
ordinances,
and
we
also
looked
at
a
couple
international
cities.
C
What
we
found
was
a
lot
of
the
cities
in
the
United
States,
although
they
have
really
ambitious
goals
that
are
admirable,
so
a
lot
of
them
want
to
reduce
their
greenhouse
gas
emissions
by
let's
say
eighty
percent
by
2050.
There's
really
no
clear
path
on
how
to
accomplish
that.
So
that's
why
we
looked
at
the
Toronto
report.
We
found
the
Toronto
report
being
the
most
interesting
they
created
in
2014
and
that
actually
they
use
what
they
term
performance-based
conservation.
C
So
what
they
do
is
they
divide
all
their
different,
publicly
owned
buildings
by
type,
so
so
they
classify
them.
So,
like
you
see
right
here,
these
are
all
the
polls
and
pull
buildings
on
this
is
for
the
city
of
Pittsburgh
and
why
they
create
these
use
classic
classifications,
because
some
of
these
buildings
I
mean
they're,
inherently
different
right.
C
You
know
the
polls
aren't
going
to
use
the
same
amount
of
or
have
the
same
type
of
uses,
let's
say
fire
halls
or
even
an
administration
building,
so
this
allows
them
to
sort
of
benchmark
these
buildings
against
each
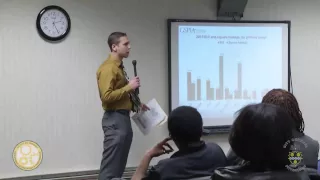
other.
Look
at
the
next
slide
and
we
also
have
fire
houses
here
too,
and
we
also
created
a
national
median
for
these
buildings.
C
As
for
the
city
sees
where
they
compare
from
a
national
standpoint,
the
so
the
Pittsburgh
median
for
firehouses
is
150
4.6
you
I
in
the
National
is
150
4.4,
so
extremely
close
and
City
Pittsburgh
student,
very
well
with
their
own
fire
houses.
But
you
do
have
these
buildings
down
here
that
are
basically
consuming
more
energy
than
you
know.
They
probably
should
so
the
next
slide,
so
what
Toronto
does
and
the
city
can
decide?
How
exactly
do
you
want
to
benchmark?
We
do
recommend.
C
You
know
these
different
use
classification,
but
Toronto
benchmarks
to
their
top
25%
of
energy
performers,
so
what
Toronto
would
want
to
do
and
with
the
city
of
Pittsburgh
might
want
to
adopt
just
try
to
get
all
of
these
firehouses
to
that
112
eui
that
last
that
last
building
over
there,
so
mainly
to
summarize
our
findings.
So
we
highly
recommend
this
performance-based
conservation,
because
for
us
it's
a
really
meaningful
way
to
benchmark
the
buildings.
It's
also
important
to
ensure
all
the
data
is
accurate.
C
You
want
to
get
them
up
to
speed
first
and
you
save
some
dollars
and
then
that
could
possibly
be
you
know
the
those
monies
could
be
segregated
into
like
a
special
revenues
fund.
The
savings
can
be
transferred
from
the
general
funds
and
that
could
possibly
fund
future
initiatives.
So
as
far
as
the
next
steps
go
for
the
city,
so
if
the
city
was
going
to
do
a
capstone
with
the
University
of
Pittsburgh
again,
we
would
recommend,
maybe
creating
a
team
to
take
a
little
bit
deeper
into
some
of
these
used
classification.
C
So
again,
I'm
going
to
talk
about
you
know
fire
houses
or
maybe
even
police
stations.
You
might
want
to
get
a
team
to
actually
go
out
and
visit
some
of
these
buildings
and
see
what
are
some
characteristics
of
the
lowest
performers
and
the
highest
performers.
You
know
you
might
find
that
the
low
performers
are
in
need
of
some
capital
improvements
or
you
might
find
that
it's
actually
behavior
or
cultural
modification
so
dislike.
C
Turning
out
the
lights
or
maybe
switching
to
LED
or
something
like
that
and
then
I
think
it
would
be
a
nice
pilot
before
that
they
do
their
full
launch
and
a
good
learning
experience
to
pick
one
department.
So
we
want
to
thank
the
city
for
the
opportunity
to
work
on
this
project
and
we
are
happy
to
answer
any
questions
that
anyone
may
have.
D
B
I
mean
the
database
is
your
tool,
so
anything
that
you
think
is
useful.
You
can
add
it's
helpful
if
you
can
add
fields
that
have
building
codes
already
attached,
because
that's
kind
of
the
the
one
thing
that
was
constant
across
all
of
these
fields,
so
we
had
2013
total
energy
use
and
energy
costs
for
the
full
year.
So
if
you
wanted
to
do
a
monthly
average
or
if
you
wanted
to
add
historical
energy
data,
that's
something
that
can
easily
be
done
in
just
a
few
minutes.
E
I
am
Kaz
Pellegrini
project
manager
of
the
architecture.
Division
in
public
works.
I
just
want
to
compliment
you
guys
on
your
project
because
of
what
I
saw
several
weeks
ago.
I
was
really
nervous
about
what
you
might
come
up
with,
because
I
thought
I
was
going
to
get
plastered
with
lots
and
lots
of
data,
but
you
did
an
excellent
job
in
making
it
visual
too,
and
it
makes
a
really
easy
job
of
my
group
pinpointing
and
Henry
kafar
DS
group.