►
From YouTube: 11-23-20 City Council Work Session
Description
Recording from City Council Work Session meeting on Monday, Nov. 23, 2020 at 7:30 a.m. Due to technical glitches, the meeting has been adjourned and the entirety of the meeting will be rescheduled. Members of the public, department directors and staff were unable to join the Zoom meeting.
Learn more: https://DSM.city/news_detail_T2_R285.php
A
A
D
Okay,
mayor
did
you
want
me
to
go
ahead,
mayor
yep,
all
right
well,
good
morning,
everyone.
So
we
have
two
topics
this
morning,
the
first
of
which
is
a
presentation
on
our
every
two
year
resident
survey,
findings,
the
etc
group.
We
have
robert
on
the
phone
with
us
here
on
the
zoom
call,
so
he'll
be
given
this
presentation.
I
want
to
thank
paul
as
well
for
helping
organize
the
survey
this
cycle
and
helping
to
put
together
the
presentations.
So
we
have
quite
a
few
questions.
D
Many
of
you
are
familiar
with
that
get
asked
every
two
years
so
that
we
can
track
how
our
performance
is
going,
not
only
in
our
own
progress
to
make
sure
that
our
trends
are
positive,
but
also
against
other
cities
because
etc
brings
with
them
a
very
large
grouping
of
communities
that
they
do.
This
similar
survey
with
so
with
that
I'll
go
ahead
and
kick
it
over
to
robert
and
I'll
be
also
available
for
questions.
At
the
end,
robert.
E
E
As
was
alluded
to,
btc
has
a
large
footprint
and
has
been
doing
community
surveys,
different
types
of
surveys,
community
surveys,
business
surveys,
employee
parks,
surveys,
you
name
it
all
over
the
country
for
more
than
35
years
for
just
the
last
14
years,
or
so.
We've
surveyed
more
than
2.2
million
people
in
900
cities
in
49
states.
E
That's
the
agenda
for
the
presentation
this
morning
I'll
try
to
go
quickly,
but
I
do
also
want
to
make
sure
we
take
enough
time
to
delve
into
some
some
of
the
points
that
we've
talked
about
with
your
staff
that
are
particularly
important
and
impactful
to
your
community.
So
we're
going
to
go
over
the
purpose.
The
methodology
bottom
line
up
front
the
major
findings
summary
and
then
open
for
questions
next
slide.
E
E
Methodology
here
is,
is
quite
detailed.
I'm
not
going
to
read
everything.
That's
on
your
screen,
our
goal-
I
will
say
this
year,
was
800
responses.
We
actually
exceeded
that
by
quite
a
bit.
Thus,
your
margin
of
error
this
year
was
a
plus
or
minus
3.3
percent.
We
also
completed
an
oversampling
of
racial
minorities,
which
is
a
report
that
is
not
part
of
this
presentation,
but
is
information
that
my
understanding
is?
E
Your
staff
will
be
going
over
that
with
you
next
slide
bottom
line
up
front
for
this
year's
survey
is
that
residents
are
generally
satisfied
with
the
overall
quality
of
services
they
receive
from
the
city.
Ratings
for
des
moines
are
generally
higher
than
the
national
average
for
cities
of
a
similar
population.
You'll
see
that
as
we
go
through,
we'll
have
slides
that
break
out
des
moines
ratings
compared
to
a
list
of
cities
that
we've
compared
you
to
improvements
to
police
services,
communications
street
maintenance,
community
development.
Those
four
areas
should
be
the
city's
top
overall
priorities.
E
E
That
depends
upon
when
we
first
ask
the
question,
as
was
alluded
to,
we've
been
doing
this
for
a
little
while
back
to
2013.,
and
so
if
a
question
has
been
asked
every
cycle
since
that
period
of
time
you'll
see
2013,
but
if
it
was
a
new
question
starting
in
2016,
that's
why
you'll
see
the
difference
difference
there.
I
also
want
to
point
out
before
we
delve
into
it
going
through
that
you
will
see
some
lag
in
some
of
the
responses
you
can't
expect.
E
If,
if
we
made
a
change
last
year
in
a
particular
program,
can't
necessarily
expect
that
to
pop
up
right
away
in
terms
of
the
responses
from
the
citizenry,
sometimes
it
seems
to
take
a
while
for
things
to
kind
of
catch
up
with
the
improvements
that
the
city
is
is
making.
So
even
if
there
is
a
lower
than
expected
rating
in
a
particular
area
does
not
mean
that
the
city
hasn't
already
started
to
address
that.
But
you
you
have
to
be
realistic,
it's
not
always
going
to
impact
and
show
up
right
away
next
slide.
E
When
we
pick
some
key
areas
here,
this
certainly
is
not
all
of
the
areas
that
you
can
look
at
in
the
rather
detailed
report
that
we
provided.
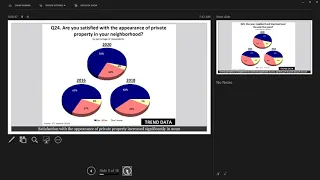
The
first
area
is
question:
24.
Are
you
satisfied
with
the
appearance
of
private
property
in
your
neighborhoods?
And
here
you
do
see
some
changes
over.
You
look
at
the
the
blue
and
we
we
generally
have
a
five
point
scale.
We
have
very
satisfied,
satisfied,
neutral
and
then
two
levels
of
dissatisfied-
and
so
here
you
see
in
the
blue.
E
If
the
residents
are
satisfied
or
very
satisfied,
you'll
see
that
highlighted
in
blue.
You
see
some
changes
from
year
to
year,
but
most
notably,
I
would
say,
from
2018
to
2020
you'll,
see
a
drop
from
31
percent
of
dissatisfied
to
24
dissatisfied
and
an
increase
of
10
in
terms
of
the
overall
satisfaction,
the
appearance
of
private
property
in
your
neighborhood,
so
we'll
go
see
as
we
go
through
some
of
the
specific
areas
that
there
may
be
aspects
of
appearance
in
private
property
that
citizens
still
want
to
see
more
improvement.
E
But
the
important
thing
is
from
a
trend,
standpoint,
you're
moving
in
the
right
direction.
Next
slide:
has
your
neighborhood
improved
over
the
past
five
years?
Again,
you
see
significant
changes
from
year
to
year,
from
2018
to
2020
a
seven
percent
increase
in
satisfaction
and
a
two
percent
drop
in
terms
of
dissatisfaction
in
terms
of
have
you
has
your
neighborhood
improved
over
the
last
five
years,
so
we
do
see
some
trends
moving
in
the
right
direction.
E
Next
slide
major
finding
number
two:
how
does
the
city
of
des
moines
compare
to
other
similar
cities,
and
I
should
say
before
we
go
through
this
when
we
say
similar
you'll
see
some
cities
that
are
obviously
larger
in
some
cities
that
are
smaller,
but
we've
tried
to
stay
in
the
midwest.
Thinking
that
a
lot
of
those
same
factors
impacting
you
would
be
impacting
those
cities
as
well
next
slide.
E
How
safe
residents
feel
in
their
community?
You
can
see
here
when
on
the
left
side
of
these
slides,
if
you
see
a
blue
arrow
again,
the
blue
arrow
is
good.
We
like
blue.
We
want
to
see
that
so
the
overall
feeling
of
safety
in
the
city,
if
you
see
a
blue
arrow,
that
means
you're
significantly
above
the
comparisons
that
we're
making
of
the
national
averages.
So
you
can
see
in
terms
of
how
safe
residents
feel
54
is
the
average
nationally
and
75
percent
was
the
result
for
des
moines,
so
you're
quite
a
bit
higher.
E
E
Now
I
want
to
point
out:
this
doesn't
mean
that
there
are
not
occasionally
customer
experiences
or
resident
experiences
that
are
going
to
be
on
the
lower
side,
but
oftentimes
we
hear
only
from
the
squeaky
wheels
or
those
people
that
tend
to
say
that
their
experience
or
one
of
some
people
that
they
know
is
indicative
of
the
entire
community.
And
that's
one
of
the
reasons
we
do.
The
surveys
is
so
that
we
can
capture
overall,
what's
the
overall
feeling
of
satisfaction
amongst
the
residents
in
your
community
next
slide.
E
So
here
you
see
broken
down
the
first
time.
We've
we've,
let
you
gone
through
kind
of
the
cities
that
we're
comparing
you
to
austin
dallas,
fort
worth:
kansas
city,
nashville,
oklahoma,
city,
springfield,
missouri
and
then
des
moines.
So
you
can
kind
of
see
there.
The
the
average
is
in
the
yellow
bar
on
the
right
side,
and
this
is
overall
quality
of
police
protection,
and
you
can
see
how
you
rate,
which
is
higher
than
all
of
the
other
cities
there,
with
the
exception
of
oklahoma
city
next
slide,.
E
And
this
is
overall
satisfaction
with
fire
services
again,
look
at
the
blue
arrows.
Those
are
positives.
Those
are
things
where
you
are
areas
where
you
are
significantly
higher
than
the
us
population,
how
quickly
fire
personnel
respond
to
emergencies
overall,
quality
of
fire
protection
and
so
on
down
the
list
very
positive,
especially
if
you
look
at
quality
fire
inspection
program,
72
percent
compared
to
38
percent.
You've
almost
lapped
the
field
in
terms
of
quality
of
fire
inspection
program
compared
to
others
nationally
next
slide-
and
I
want
to
point
out
the
the
two
slides
are
different.
E
The
national
average
is
a
national
study
that
we
do
and
that's
of
cities
of
a
certain
size
and
higher.
This
is
a
different
layer,
a
different
way
of
cutting
that
these.
This
is
not
the
cities
that
are
represented
in
the
overall
national
survey.
It's
to
give
us
a
closer
look,
a
more
detailed
look
into
the
central
u.s
city,
large
large
city,
regional
benchmarks,
and
again
you
can
see
that
des
moines
ranks
very
high
slightly
above
the
national
average.
Next
slide,
overall:
satisfaction
with
parks
and
recreation
services
compared
to
other
large
cities.
E
E
Overall,
quality
of
city
libraries
compared
to
others
again
at
the
highest
in
terms
of
looking
at
each
city.
Now
you
see
fewer
cities
here,
because
some
of
those
that
we
compare
you
to
don't
on
other,
we
wanted
to
be
consistent
and
use
the
same
cities
across
the
board,
but
obviously
not
all
of
them
have
a
library
system
like
springfield
missouri.
So
we
couldn't
compare
use
them
in
this
comparison,
but
again,
even
without
those
you're
still
higher
than
the
others
in
the
region
that
we
compare
you
to
next
slide
overall
satisfaction
with
communication.
E
So
you
are
starting
to
see
some
improvement.
Four
percent
increase
in
the
two
years
brings
you
to
48,
but
that
should
indicate
or
could
indicate
that
you're
moving
the
right
direction
and
hopefully
that
trend
will
continue.
The
more
people
tend
to
use
the
web
for
accessing
information
about
the
city
and
and
for
getting
connected
with
the
right
person
to
address
their
problems.
Next
slide.
E
E
Overall
satisfaction
with
community
development:
how
well
the
city
is
planning
growth
significantly
higher.
You
see
the
other
areas
where
you
are
behind
or
lower
than
the
national
averages.
And
again
you
have
to
look
behind
those
numbers.
There
may
be
some
improvements.
It
doesn't
mean
that
the
city
isn't
aware
of
it,
isn't
isn't
moving
in
the
right
direction,
just
that
it
hasn't
shown
up
yet
next
slide.
E
Overall
enforcement
of
city
ordinances,
kind
of
right
in
the
middle,
very
close
to
the
the
the
average
there
35,
and
that's
just
one
of
those
those
things
when
you
look
at
enforcement-
and
I
always
talk
about
the
cafeteria
food
of
city
surveys.
That's
that's
one
of
them.
When
you
look
at
code
enforcement,
you
look
at
streets,
I
I
call
it
the
the
cafeteria
food
because
it
doesn't
seem
to
matter
what
you
do.
You're
always
going
to
be
on
the
lower
side.
But
the
reason
we
do
comparisons
is
so
you
can
see.
E
Okay,
35
percent
rating
may
sound
by
itself,
just
as
a
horrible
rating,
but
when
you
look
across
the
board
at
other
cities,
you
see
everyone
else
is
struggling
with
the
same.
So
enforcement
of
city
ordinance
is
one
of
those
items
that
always
seems
to
rate
low
across
the
board
nobody's
out
there
with
a
90
percent
satisfaction
rate,
for
example,
with
enforcement
of
city
ordinances.
E
Is
it
really
a
city
street
in
terms
of
maintenance,
or
is
it
just
a
street
within
the
city?
And
so
in
an
area
like
that,
I
encourage
you,
maybe
to
do
a
little
bit
more
outreach
with
folks
to
make
sure
that
we're
really
understand
they're,
really
understanding
and
they're
they're
raiding
your
streets,
because
you
do
see
some
variation
when
it
looks
you
look
at
streets
in
your
neighborhood
or
just
how
we
describe
these.
But
I
just
want
to
point
that
out.
E
E
hours
of
libraries
are
open,
I'm
just
going
to
kind
of
go
through
here,
a
number
of
those
with
the
libraries,
but
also
with
the
parks,
how
quickly
police,
responding
to
emergencies
and
overall
quality
city
parks.
Again,
your
parks
are
leading
the
way
in
terms
of
comparing
to
other
cities
that
we
benchmark
you
against,
and
those
are
trends.
Those
are
increases
on
a
significant
scale
in
the
last
seven
years,
so
you
can
really
see
in
some
areas
where
you've
made
the
investment
of
time
and
money
and
communication
with
your
residents
that
it
shows
next
slide.
E
Yeah
I've
had
some
areas
where
he's
seeing
since
2013
some
decreases
overall
enforcement
of
city
ordinances,
which
we
talked
about
condition
of
major
city
streets,
which
we've
talked
about
and
some
of
those
other
areas.
That
would
point
the
fact
that
you
know
these
a
much
shorter
list
than
long-term
increases,
but
still,
nonetheless,
some
areas
that
you
want
to
continue
to
have
conversations
with
and
prioritize
your
investment
efforts.
E
As
I
talked
about
priorities
for
investment
next
slide,
one
of
the
things
that
etc
does
is
we
look
at
all
of
the
different
ways
that
we
have
different
questions,
and
so
we
may
have
three
or
four
different
questions,
that
kind
of
speak
to
the
same
issue,
and
we
look
at
a
composite
here
and
we
assign
a
rating
and
so
we'll
see
as
we
go
through
here.
You
might
have
a
very
high
priority:
high
priorities,
medium
priorities
or
low
priorities,
and
that's
just
a
function
of
when
we
look
at.
E
Is
it
important
to
the
people
and
are
they?
How
are
they
satisfied?
So
if
it's
that
important
satisfaction
rank
if
something
jumps
out
as
a
very
high
priority,
that's
something
that
we
would
emphasize
or
or
encourage
the
city
to
focus
on
and
the
area
that
jumps
out
here
is
visibility
of
police
and
neighborhoods.
Again,
your
police
ratings
were
very
high
and
positive
on
the
whole
compared
to
other
cities.
E
We're
comparing
you
to,
but
if
we're
drilling
down
into
the
details
here,
we're
saying
that
the
citizens
are
telling
us
that
that
it's
very
important
and
that
they're
not
satisfied,
so
that
all
translates
to
being
a
very
high
priority
in
an
area.
We
would
suggest
that
you
look
at
having
continuing
discussion
next
slide.
E
E
What
does
that
mean
because
they're
fairly
satisfied
and
or
it's
just
not
that
important
in
terms
of
overall
looking
at
the
range
of
city
services
to
the
citizen
doesn't
mean
these
aren't
important
to
do
to
continue
to
to
invest
in,
but
just
relative
to
everything
else?
Is
it
a
high
priority
next
slide.
E
E
E
If
we
look
at
public
works
and
engineering
services
couple
of
items
jump
out
as
very
high
priority
conditions
of
major
city
streets
and
condition
of
streets
in
your
neighborhood,
I
think
we've
already
kind
of
discussed
that
also
a
high
priority
snow
removal
in
your
neighborhood
and
surely
we
won't
have
any
major
snowfalls
during
2020.
I
mean
that
would
be
piling
on
mother
nature
and
I'm
sure
that
wouldn't
happen
next
slide.
E
Now
it's
interesting
because
earlier
we
said
how
well
the
city
is
planning
growth
and
you
saw
a
very
positive
rating
relative
to
other
cities,
but
it's
still
an
issue
for
your
citizens
and
so
they're
very
happy
compared
to
other
cities.
But
if
you
look
at
priorities,
they're
still
saying
hey,
we
don't
want
to
lose
sight
of
this,
let's
not
rest
on
any
laurels
or
whatever
we.
E
We
look
at
the
public
libraries
sort
of
like
on
the
fire
services.
Nothing
really
jumps
out
in
terms
of
a
very
high
priority
or
a
high
priority,
everything's
sort
of
that
medium
priority
level
again
medium
priority
doesn't
mean
that
it's
not
important,
it's
just
relative
to
other
items
and
areas
where
the
citizens
do
have
concern
next
slide.
E
This
brings
us
to
the
summary
of
what
I
would
say
recounting
these
three
points.
Residents
are
generally
satisfied
with
the
overall
quality
of
services
they
receive
from
the
city
of
des
moines.
Ratings
for
the
city
of
des
moines
are
generally
higher
than
the
national
averages
or
cities
of
similar
populations
and
in
the
four
areas
there
we
have
seen
substantial
improvements
when
we
look
at
trends.
E
Improvements
of
police
services,
communication,
street
maintenance
and
community
development,
however,
should
be
the
ones
that
are
the
top
priorities
of
the
city
wants
to
continue
to
see.
Customer
satisfaction
ratings
improve.
So
you
have
seen
some
substantial
trend
increases
positive
things,
but
looking
at
those
those
satisfaction
indexes
where
we
had
the
very
high
priorities,
those
are
the
four
areas
that
we
would
suggest
to
you
that
you
spend
more
time
looking
at
and
having
that
dialogue
with
the
community.
B
E
Yes,
in
terms
of
of
the
the
regional
benchmark
cities,
we
we
had
to
use
cities
that
we've
done
fairly
recently,
so
that
we
we
believe
we
have
an
apples
to
apples
comparison
and
that
those
are
some
of
the
cities
that
we
drew
on.
We
we
know
that
we've
had
feedback
from
your
staff
that
there
are
some
other
cities
that
typically,
you
might
see
yourself
comparing
to
like
madison
wisconsin,
but
we
we
haven't
done
work
with
them
for
quite
a
while
and
so
didn't.
B
Yeah
I
mean
the
cities
that
I
I
had
questions
about
or
would
would
be
more
interested.
I
mean
kansas
city
is
a
pretty
good
comparison,
springfield
missouri,
but
like
the
omahas,
minneapolis
milwaukee,
even
in
the
bigger
city
context,
I
so
I
was
wondering
if
there
were
other
cities
that
that
would
have
been
maybe
helpful.
But
but
if
you
don't
have
recent
survey
data
for
them,
it
doesn't
really
matter.
E
Right
and-
and
we
can
continue
to
evaluate
this
every
time
we
do
one
so
when
we
do
one
do
the
resident
survey
in
two
years,
we
can
hopefully
look
at
at
the
range
of
cities,
that's
something
that
your
staff
did
express
some
sensitivity
and
desire
about,
and
so
you
know
we'll
we'll
be
looking
for
that.
It's
just
a
timing
thing.
There
are
a
number
of
cities
that
we
would
normally
be
surveying
that
decided
to
wait
just
because
of
the
pandemic.
E
It
would
be
to
my
to
my
thinking
it's
just
a
matter
of
okay
which
which
cities
are
you
interested
in,
and
certainly
we
can
provide
you
additional
information
about
how
they
came
out
or
provide
a
link
to
their
surveys,
but
it
would
have
to
be
something
we
discussed
about.
So
I'm
more
clear
on
exactly
what
you're
trying
you
know
what
your
goal
is,
but
obviously
you're
an
important
client
to
us.
So
any
information
we
have
that
can
help
bring
your
results
more
into
focus.
We're
happy
to
talk
about.
B
It
yeah
I
just
I
I'm
concerned
about
the
comparison
cities
I
mean
and
some
of
the
relevance
I
mean
particularly
when
you
get
far
enough
south
you
don't
have
the
same
weather
conditions
for
roads
even
or
the
same
weather
impact,
but
but
they're
also
just
demographically,
very
different
cities.
I
mean
I,
I
wouldn't
consider
austin,
dallas
or
fort
worth
particularly
comparable
to
to
des
moines.
I
mean
even
nashville,
oklahoma
city,
so
so
that
comparison
group,
I'm
really
struggling
with.
E
Okay,
well,
I
I
understand
that
I'm
not
I'm
not
sure
if
that
can
add
anything
else
that
would
help
ease
that
concern.
At
this
point
I
mean
we
we're
we're
limited
again
to
some
degree
by
those
cities
that
we
have,
but
it's
something
that
we're
happy
to
continue
to
talk
to
your
staff,
about
to
see
what
other
information
or
comparisons
we
can
bring
to
the
table.
C
This
is
frank:
I
thought
I'd
better
jump
in
here.
We
still
haven't
been
able
to
allow
everybody
else
in.
Is
that
correct?
So
I
think
that
we
probably
need
to
get
that
fixed,
and
this
is,
you
know,
actually
a
public
meeting,
and
I
think
that
probably
we
should
reschedule
it,
because
I
think
our
citizens
need
to
get
the
opportunity
to
be
able
to
hear
this
kind
of
of
information.
A
C
I
to
everybody,
that's
been
on
and
and
robert
thank
you
so
much
for
your
input.
I
hope
that
we
can
reschedule
and
so
that
our
citizens
can
get
a
a
sense
of
of
our
overall
condition
of
the
work
and
everything
that
we're
doing
and
have
done
in
and
around
the
city
of
of
des
moines
scott.
Any
quick
comment
here.
C
A
C
C
G
I
just
want
to
make
clear
for
the
record.
We
were
under
the
mistaken
impression
that
the
meeting
was
still
available
on
youtube
and
the
city
cable
channel,
but
apparently
it
was
not
available.
So
that's
why
we've
stopped
the
meeting
as
we
found
out
that
it
was
not
available
for
public
participation
through
those
avenues.
I
just
want
to
make
that
clear
on
the
on
the
record,
so
thank
you.