►
From YouTube: OKC Post Employment Benefit Trust - February 13, 2023
Description
No description was provided for this meeting.
If this is YOUR meeting, an easy way to fix this is to add a description to your video, wherever mtngs.io found it (probably YouTube).
A
A
Today
we
have
some
items
for
consideration,
including
the
presentation
of
the
quarterly
investment
report
for
the
oh,
don't
we
have
minutes
to
consider.
Maybe
I
went
too
far.
Oh
first
item
on
our
business
today
is
approval
of
minutes
for
the
November
14
2022
Oklahoma
City
Post
employment
benefits
trust
meeting.
So
if
I
could
entertain
a
motion
on
that
item,.
A
And
the
minutes
have
been
approved,
so
the
next
item
on
our
agenda
is:
are
the
individual
items
for
consideration?
First,
we
have
the
presentation
of
the
quarterly
investment
report
for
the
period
ended,
December,
31st,
2022,
or
also
receiving
our
monthly
investment
reports
for
November
30th
December
31st
and
January
31st
2023
I'd
like
to
welcome
Doug
Anderson
to
the
podium
and
Doug.
What
do
you
have
to
tell
us
today,
good.
B
Exactly
yeah
and
I
think
that
the
headlines
are
strange
right
now
to
say
the
very,
very
least,
but
the
fourth
quarter.
We
saw
some
improvements
in
the
market.
Some
stabilization
in
the
markets
in
January
was
also
a
good
month,
so
we'll
go
through
that
as
well.
First
off
on
this
quarter-
or
this
is
our
year-end
report
and
so
on.
The
next
slide,
you'll
see
perfect
you'll,
see
a
letter
from
our
chairman
and
CEO
Mike
Welker
thanking
our
clients,
primarily
that's
the
most
important
thing.
B
B
Is
the
right
time
of
year
to
do
this?
Yeah?
Yes,
please
let
me
know
I'd
be
happy
to
to
take
everyone
down
there,
so
that's
the
the
gist
of
that.
The
next
slide
is
our
organization
chart
again
you
can
see
93
people
you
can
see
on
the
upper
left-hand
side.
That's
our
partnership!
Those
are
the
partners
of
the
firm.
Our
firm
has
a
distinct
leadership
structure
where
it
is
separate
from
most
of
the
Consulting
duties.
B
Next
slide,
please-
and
one
more
so
here
we're
going
to
start
talking
about
the
market,
environment
and
2022
is
a
very
difficult
year.
There's
no
two
ways
about
it:
we
started
with
a
hint
of
inflation
during
January
that
seemed
to
be
somewhat
pacified,
but
then
in
February
I
think
it
was
very
close
to
this
date.
B
Last
year,
I
think
I,
remember
talking
about
the
potential
of
Russia
invading
Ukraine
and
saying
it's
a
very
remote
possibility,
but
of
course
that
did
happen
and
that
defined
a
lot
of
the
year
last
year
between
that
and
the
balance
between
inflation
and
unemployment
in
the
United
States
last
year
was
a
a
transitive
year.
We
saw
a
lot
of
things
changing
the
next
slide
shows
you
performance
in
the
markets,
the
upper
side
there,
the
quarterly
performance.
You
saw
that
the
fourth
quarter
of
the
year
had
a
nice
recovery.
B
That's
seven
percent
seven
point:
six
percent
return
for
the
s
p:
you
can
see
the
international
Equity
indexes
are
in
Gray,
so
they
had
a
great
fourth
quarter.
Part
of
that
was
appreciation
of
share
prices
on
foreign
markets.
A
large
part
of
that
was
also
the
depreciation
of
the
dollar
versus
other
currencies.
The
markets,
the
world
economy,
seemed
to
stabilize
a
bit
during
the
fourth
quarter
and
saw
the
dollar
trade-off
versus
other
currencies.
We
actually
had
positive
return
on
bonds
during
the
quarter
and
then
T
bills
or
cash
at
point
nine
percent.
B
But
then
we
looked
back
at
the
last
year
and
last
year's
it's
a.
This
is
a
very
difficult
picture
to
look
at
normally
when
you
see
equities
the
s
p,
Etc
down
19
percent,
usually
in
that
case,
lower
risk
assets,
I.E
bonds,
that
lower
segment
in
green
is
a
positive
return.
Those
are
our
two
major
asset
categories
here,
the
blue
and
the
green,
and
both
of
them
were
down
tremendously.
If
you
look
at
this,
the
only
Market
I
guess
you
could
say
that
was
positive-
was
t-bills
up
one
and
a
half
percent.
Now
remember.
B
B
I'll
we'll
take
another
look
at
that
in
a
moment,
but
going
on
to
the
next
slide,
you
see
performance
value,
outperformed
growth,
even
during
the
fourth
quarter,
but
you
look
out
over
the
last
year
value,
although
at
a
loss,
outperformed
growth
by
tremendous
margins
and
I
think
I
remember
two
years
ago
saying
this
growth
Market
rally
the
Fang
stocks,
that
was
the
buzzword
at
the
time:
Facebook
Amazon,
Apple,
Netflix
and
Google.
This
cannot
go
on
forever,
because
75
percent
of
the
Market's
return
was
generated
by
those
five
companies,
and
that
was
unsustainable.
B
It
looked
like
it
would
go
on
forever.
It
felt
like
it
would
probably
go
on
forever
and
if
you
were
going
to
take
a
look
at
value
stocks,
I.E,
Banks,
insurance,
company
and
energy,
you
would
have
thought.
Why
are
we
looking
at
this?
Those
are
those
companies
are
past,
their
Prime
we'll
never
have
any
they'll,
never
generate
the
returns
that
these
technology
companies
will
now
go
on
to
the
next
slide
and
we
can
see
what
happened
to
those
technology
companies.
B
So
when
we
look
at
the
Russell
1000
communication
Services
down
for
the
year,
which
is
the
lighter
column,
40
percent,
40
percent
of
that
sector
is
I,
believe
Facebook
and
Amazon
I.
Think
they're
quote
they're
classified
very
strangely,
but
40
of
that
index
is
down,
but
that
an
entire
index
is
down
40
percent.
On
the
year
you
look
at
consumer
discretionary.
Obviously,
a
slowing,
uncertain,
Market
environment
they'll
sell
off
also
down
36
percent
Consumer
Staples.
B
We
have
to
have
those
so
they're
down,
just
not
as
much
not
nearly
as
much
and
then
energy
the
one
standout
player
right.
If
there
was
one
thing
that
folks
were
very
worried
about
last
year
and
we
saw
Energy
prices
go,
you
know
above
a
hundred
dollars
a
barrel
of
WTI,
we
saw
natural
gas
prices
explode
to
that's,
probably
how
to
go
much
higher,
very,
very
yeah
I,
don't
I!
Don't
like
this?
B
Let's,
just
let's
use
a
different
adjective
on
that
adverb
sorry,
but
as
we
we
verb
as
as
it
went
higher
as
pipelines
had
problems
under.
You
know
see
if
we
had
other
issues
about
how
is
Germany
and
the
rest
of
of
Europe
going
to
heat
themselves,
much
less
run
into
this
run.
Industry
we
saw
natural
gas
prices
go
extremely
higher
in
the
United
States.
B
We
saw
them
go
from
under
two
to
about
nine
for
a
brief
period
of
time,
the
price,
but
in
Europe
we
saw
them
go
over
a
hundred
and
twenty
dollars
for
the
same
price
equivalent
in
the
United
States.
Now
it's
down
to
less
than
20,
because
the
winter
has
been
very,
very
mild,
but
I
think
long
story
short
the
things
that
led
the
market
two
years
ago
in
simpler
times
in
more
stable
times,
if
you
will
definitely
have
taken
the
back
seat
during
the
last
year.
B
If
you
look,
there
were
two
sectors
last
year
that
had
positive
returns
in
the
Russell
1000
energy
up
64
and
a
half
percent
right
leagues
ahead
of
everybody
else,
and
then
utilities,
which
is
the
most
defensive
sector
up.
1.3
percent
utilities
are
paid,
pay
a
decent
yield,
so
it's
probably
around
four
percent
now,
but
even
they
on
a
capital.
Appreciation
came
back
a
little
bit
last
year.
So
when
you
look
at
the
U.S
Equity
market,
energy
or
nothing,
that
was
the
only
place
that
performed
well.
B
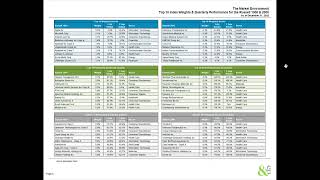
So
next
slide
shows
the
performance
of
the
top
10
weighted
stocks.
And
if
you
look
at
these
Apple
down
26
Microsoft
down
28
for
the
one-year
column
there
Amazon
down,
50
percent
Berkshire
Hathaway
can't
get
much
more
basic
than
that
right.
3.3
percent,
positive
return
and
then
alphabet
which
is
Google
down
39.
B
If
you
look
there
meta
is
not
even
in
the
top
ten
anymore.
That's
Facebook
Facebook
was
down
70
last
year.
It's
come
back
quickly
this
year,
but
it
was
one
of
the
biggest
losers.
If
you
look
at
the
bottom
10
performers,
you
can
see
some
really
dramatic
losses
here,
and
these
are
companies
that
we
were
looking
at
a
few
years
ago.
Being
industry
leaders
right
carvana
right,
that's
the
you
know
we'll
buy
whatever
used
car
you
have
and
then
we'll
resell.
B
It
wework
one
of
my
favorites
right
they're,
going
to
re
completely
reconfigure
the
office
real
estate
market
in
in
the
world
down
83
percent
last
year
and
then
Tesla
down
65
percent.
Now
we
look
at
the
top
performers
Therapeutics.
Obviously,
some
of
those
are
great.
You
see
discount
retailers
like
Burlington,
and
then
you
see
Halliburton
right
and
Halliburton
was
a
great
performer
during
the
quarter,
but
a
great
performer
for
the
year.
So
I'm
calling
it
Back
to
Basics
I'm
saying
that
cash
is
an
investment.
An
option.
B
Matthew
and
I
have
talked
about
the
cash
that
is
being
held
outside
of
the
of
the
Investment
Portfolio,
because
if
you
look
at
checking,
accounts
balances
they're
getting
about
half
a
percent
income
right
now
or
yield
on
them,
but
the
money
market
fund
that
it's
invested
in
it's
not
in
cash
money.
Market
fund
is
a
little
bit
more
than
four
percent
and
if
you
think
on
a
million
dollars,
I'm
going
to
get
a
half
percent
or
four
percent,
that's
pretty
meaningful
increase,
and
luckily
it's
been
in
there
the
entire
year.
B
So
next
slide
International
Equity
performance,
sort
of
paralleled,
the
U.S,
except
for
it's
a
little
bit
worse,
the
first
three
quarters
of
the
year
and
a
little
bit
better
during
the
fourth
quarter
of
last
year.
Big
picture
right
now,
when
it
comes
to
International
markets,
is
obviously
China.
China's
reopening
China
coming
back
into
the
market,
is
going
to
have
supply
and
demand
implications,
but
right
now
I
think
that
one
thing
in
the
back
to
basics,
the
world
is
short
oil
production
capacity.
B
If
China
comes
back
on
strong,
like
they,
they
might
be
expected
to,
so
there
will
be
Supply
pressures.
Europe
was
able
to
get
natural
gas
to
heat
themselves
this
year,
but
the
other
effect
was
there
were
other
countries
that
weren't
able
to
like
Thailand
weren't
able
to
get
the
natural
gas
that
they're
normally
used
to
because
they
were
bid
out
by
Europe.
So
next
slide
I'm
not
going
to
go
over
this
I'm
going
to
go
one
more
fixed
income.
This
will
be
a
year
that
lives
in
infamy
in
the
bond
markets.
B
Bonds
are
simple,
Securities
right.
They
have
a
it's
a
loan
that
you're
making
to
someone
in
a
securitized
basis.
A
bond
is
simple
right.
You
don't
have
earnings,
you
don't
have
margins,
you
don't
have
anything
else.
You
have
I'm
going
to
loan
someone
or
somebody
or
something
a
hundred
dollars
for
a
specified
period
of
time
during
that
period
of
time,
I'm
going
to
be
paid
a
rate
of
interest
and
at
the
maturity
of
that
that
period
of
time
I'm
going
to
get
my
hundred
dollars
back.
B
That's
it
very
simply
in
cases
like
that,
Securities
like
that,
we
do
not
often
see
bonds
going
down
this
much
right.
I
think
I
mentioned
the
two
times
in
American
history.
Where
they've
been
down
this
much
and
they
were
existential
threats
to
the
United
States.
It
was
not
a
a
year
where
we
had
seven
percent
inflation.
It
was
like
we
don't
know
if
the
government's
going
to
be
around
to
pay
pay
these
off
when
they
come
due.
B
So
I
think
the
Bond
Market
may
have
over
over
overreacted
to
some
of
the
issues,
but
that's
also
what
the
bond
market
does.
We
look
at
the
quarter.
Things
finally
started
to
come
around
nicely,
but
the
aggregate
Bond
index
for
the
year
was
down
13,
that's
our
normal.
Our
main
Benchmark
here
treasuries
were
down
12
and
a
half
percent
mortgage
is
down
11.8
corporate
bonds
down
15-8
high
yield
we're
down
11-2,
which
is
less
and
there's
a
couple
of
reasons.
Why?
B
But
but
Ironically
in
a
year
that
the
bond
market
sold
off,
you
had
corporate
bonds,
there
were
investment
grade
and
he
had
corporate
bonds
that
were
below
investment
grade
below
investment
grade
bonds
performed
better
that's
because
they
have
shorter
duration
and
they
pay
more
income,
and
that's
why
they
did
better.
It
was
a
year
that
in
the
next
slide,
please,
where
we
saw
the
yield
curve
we
on
the
bottom
there
you
can
see
the
treasure
yield
curve.
B
This
shows
you
the
yield
of
Treasury
Bonds
on
various
maturities
at
four
different
dates,
so
the
first
one
or
the
lowest
one
is
the
is
331
of
last
year.
So
this
is,
you
know
the
very
beginning
of
the
interest
rate
hiking
cycle,
and
you
can
see
that
the
yield
curve
was
fairly
normal.
It
was
low,
but
it
was
fairly
normal
with
a
yield
of
25
basis
points
at
the
front
end
and
two,
and
about
two
and
a
half
at
the
30
year.
Now
look
at
the
yellow
line
there.
B
That's
very
interesting
where
the
one
month
went
from
25
basis,
points
to
about
425
basis
points.
That's
a
rapid
increase
in
interest
rates
by
the
Federal
Reserve,
trying
to
reduce
inflation
in
the
economy,
and
so
that's
one
thing.
The
other
thing
that's
very
interesting
here
is
that
the
yield
curve
is
inverted,
meaning
that
you
can
make
more
money
lending
someone
six
months,
then
you
could
lending
somebody
for
seven
years
right.
B
What
does
that
make
people?
Do
I'm
not
going
to
lend
money
to
anybody
for
seven
years,
I'm
going
to
do
a
very,
very
short
term,
and
so
that
has
a
slowing
effect
and
I.
Think
the
old
saying
is
that
an
inverted
yield
curve
is
predicted
seven
out
of
the
last
five
recessions,
meaning
it
does
not
always
precede
recessions,
but
it
usually
does
so.
This
is
some
sense
of
economic
slowing
in
the
future.
B
Just
because
the
way
the
markets
work
the
way
the
markets
fund
themselves,
so
that
is
the
long
and
short
story
of
the
market
environment.
If
we
could
go
to
the
portfolio
report
itself,
like
I
said,
this
is
a
very
difficult
year
down
17
percent.
This
is
one
of
the
most
difficult
years
that
I've
ever
seen
as
an
investor
as
an
advisor
to
folks
like
yourselves,
this
feels
as
bad
as
the
2008-2009
period.
B
The
great
financial
crisis,
where
it
felt
like
the
world's
Financial
system,
was
going
off
a
cliff
and
we
didn't
know
if
it
was
going
to
be.
There
I
think
it's
going
to
be
there.
We
might
have
a
slower
economy.
This
year
we
started
with
interest
rates
very,
very
low,
which
was
punishing
for
the
bond
portfolio.
But
if
there's
one
positive,
that
I
will
say
out
of
this
expected
returns
for
60
40
portfolios
at
the
beginning
of
last
year,
given
how
low
bond
yields
were
and
how
high
or
how
expensive
stocks
were.
B
B
So
I
guess
that's
the
shiny
side
of
the
penny
that
we
just
picked
up
on
the
sidewalk
there,
but
that's
we're
we're
not
invested
exclusively
in
those
two
asset
classes.
We're
Diversified
beyond
that
and
I
think
that
this
year
it
helped
us
in
ways.
I
certainly
didn't
expect.
So
next
slide
Will
Go
On.
Here
you
can
see
that
over
time
the
strategy
has
worked
right.
The
long-term
asset
allocation
has
increased
the
value
of
the
portfolio
at
this
point
at
the
end
of
last
year
was
85.6
million
dollars.
So
this
is
December
31..
B
This
goes
all
the
way
back
to
2009.
We
started
with
6.018
million
dollars
and,
as
we
ended
the
year
85.6
over
that
period
of
time
we've
seen
151
million
dollars
contributed.
We've
seen
105
million
dollars
pulled
out.
We
have
seen
gains
on
market
value
or
capital
appreciation
of
33.3
million
dollars.
The
ending
market
value
is
right.
There
we've
also
seen
income
of
11.1
million
dollars
and
hopefully
in
the
future
we
will
see
a
larger
contribution
of
income
to
the
total
return
here.
So
over
the
entire
period
of
time,
the
cumulative
return
has
been
140
percent.
B
B
That
was
the
first
time
we
saw
that
now
we
saw
a
strong
rebound
during
the
fourth
quarter,
thankfully,
and
that
52
million
dollars
is
the
net
I.
Guess
you
would
call
that
the
Corpus
that
has
been
or
the
net
of
all
positive
cash
flow
over
time,
so
the
amount
in
total
contributed
is
52
million
dollars.
We
still
have
85.6
after
what
I
would
consider
one
of
the
worst
years
that
we've
ever
seen
next
slide.
Please
asset
allocation
has
been
roughly
stable.
It's
been
stable
over
time.
B
You
can
see
we
started
out
slow
with
less
domestic
equity
and
we
we
supplanted
that
with
fixed
income,
because
again
2009
was
a
period
where
we
didn't
know
what
was
going
to
be
happening.
Next
next
slide
is
our
asset
allocation
here,
so
we
have
63
percent
domestic
Equity
16
core
fixed
income.
We
have
11
percent
in
non-us
equities,
so
our
total
allocation
to
equities
is
about
75
percent.
We're
active
that
way.
B
We
are
more
in
equities
than
a
lot
of
folks
and
actually,
ironically,
last
year,
having
16
of
fixed
income
didn't
help
us
as
much
as
we
thought
it
would.
So
that's
one
of
the
reasons
that
we
have
that
return.
You
can
see.
We
have
a
couple
of
other
fixed
income
allocations
and
then
point
two
percent
in
cash.
This
is
Cash
in
the
Investment
Portfolio
Matt.
How
much
is
in
the
outside
of
the
Investment
Portfolio.
B
So,
outside
of
this,
we
have
the
cash
buffer,
which
is
about
two
million
dollars
which
which
allows
us
to
not
to
have
to
hit
this
portfolio
on
a
quarter
by
quarter
basis.
The
next
slide,
please
is
our
manager
allocation.
Here
you
can
see
largest.
Is
our
S
P
500
Index
Fund,
then
our
International
Equity.
Then
we
have
small
cap,
U.S,
equities,
mid
cap,
us
equities
and
then
Bond
portfolios
managed
by
limit
sales
double
line
Hoisington.
B
Well
then,
we
have
our
mid
cap
portfolio
and
then
the
Lord
Abbott
high
yield,
so
at
the
very
top
of
the
portfolio
is
a
passive
exposure
to
the
U.S
Equity
Market
bonds.
Much
lower,
we
have
half
of
our
mid
cap.
Exposure
is
indexed
because
we
kind
of
went
round
and
round
trying
to
find
the
right
manager
there
for
a
while
all
of
our
International
Equity.
All
of
our
small
cap
is
actively
managed,
as
is
our
Equity
portfolios.
Next
slide,
please.
B
C
D
C
D
B
And
trustee
Barry,
that's
that's
been
an
I
guess,
a
evolving
area
and
I
think
it's
smart
to
have
that
much
cash
on
the
outside,
because
in
a
worst
case,
environment
I
would
rather
have
that
and
not
have
to
tap
assets
when
they're
down.
So
looking
at
the
portfolio
here,
not
a
lot
of
surprises
right.
You
have
more
Equity
than
most
funds
out
there,
because
this
plan
has
a
very
long
time.
Horizon,
possibly
exceeding
our
own
lifespans.
For
the
quarter
portfolio
was
great.
It
had
Equity
exposure,
it
did
very,
very
well.
B
16.95
now
going
to
the
quarter
going
back
to
the
quarter,
you
can
see
that
our
fixed
income
exposure
was
up
1.1
percent.
We
had
widely
dispersed
returns
there
Loomis
sales,
2.81
percent-
well,
thankfully
all
but
one
we're
we're
positive.
Second
percentile
double
line
bond,
which
is
a
more
macro
oriented
portfolio
1.13,
but
they
ranked
in
the
92nd
percentile
and
then
Lord
Abbott
down
3.75
in
the
71st
first
percentile
and
then
also
I
I.
B
Don't
has
said
irony
once
I,
don't
want
to
use
that
word
again,
but
surprisingly,
Hoisington
was
down
1.95
and
they
had
an
absolutely
rotten
year.
Last
year,
they're
economists,
the
biggest
economic
surprise
last
year,
was
that
inflation
was
not
transitory.
It
fooled
the
Federal
Reserve,
it
fooled
the
treasury
Department,
it
fooled
Wall
Street.
It
fooled
these
folks
too,
although
their
rationale
still
appears
to
be
sound
going
forward
because
they
are
expecting
a
Slowdown,
it
did
not
help
their
portfolio
a
bit.
That's
why
we
have
a
reasonably
small
allocation
here
and
in
Market
environments.
B
In
the
past,
where
equities
went
down,
this
portfolio
went
up
in
the
opposite
Amer.
If
the
market
was
down,
equities
were
down
20.
This
portfolio
would
be
up,
20
I'll
show
you
and
an
example
of
that
in
just
a
moment,
but
in
this
case
because
inflation
was
driving
the
market
uncertainty
on
the
equity
side,
it
also
hurt
this
portfolio,
which
is
invested.
A
hundred
percent
in
U.S
treasury
bonds.
B
B
B
This
is
one
part
of
the
picture
that
you
don't
see
because
last
year
was
so
awful.
Hoisington
has
always
been
a
very
volatile
manager,
they
own
long
duration,
U.S
treasuries,
which
have
the
highest
volatility
within
the
bond
market.
Sometimes
that's
bad
volatility.
Sometimes
it's
good
volatility.
So
you
look
down
here.
You
can
see
the
year
to
date,
gosh
I,
hope,
I,
never
see
a
return
like
that
out
of
the
bond
market,
anything
that
pays
interest
and
has
maturity
date,
much
less
U.S
treasuries.
I.
Don't
ever
want
to
see
that
again,
but
you
look
at
2021.
B
They
were
down
4.9,
which
was
bad
too,
but
you
look
at
2020.
You
look
at
2019.
You
look
at
those
returns.
That's
what
they're
capable
of,
unfortunately,
those
two
years
that
we've
had
recently
completely
obliterate,
that
from
the
record
that
we
look
at.
If
we
stop
it
and
look
back
from
12
31.,
so
it's
unfortunate
that
they
were
down
that
much,
but
they
do
have
some
utility
in
the
future.
I
want
to
make
sure
that
they
know
that
we're
watching
them
very
carefully.
So.
B
B
This
this
happens
to
be
probably
the
simplest
investment
strategy
that
we
have.
They
look
at
the
future
of
interest
rates,
which
is
the
future
of
inflation
and
they
construct
their
portfolio
to
produce
an
absolute
return.
Based
on
that
forecast.
They
expect
a
slowing
economy,
which
means
that
they
will
own
30-year
treasuries.
B
B
If
it
goes
interest
rates,
go
up,
one
percent
that
portfolio
will
be
down
18.
If
interest
rates
go
down,
one
percent
portfolio
will
gain
18.
So
it's
a
higher
volatility
strategy
and
in
other
cases,
I
mean
2020.
You
remember,
you
know
that
was
the
first
year
of
covid
and
the
equity
markets
went
down
dramatically.
They
went
the
opposite
direction,
but
these
are
all
great
questions
and
things
that
do
you
keep
me
up
at
night
about
Hoisington?
B
If
they're
not
on
the
watch
list,
they
definitely
should
be,
but
I
wanted
to
make
sure
that
we
had
the
whole
picture.
Endpoint
sensitivity
when
you're
looking
at
returns
is
real
right.
If,
if
before
we
turned
this
slide,
if
I
said
you
know,
they
were
up
20
in
2020
and
17
in
2019
that'd
be
hard
to
believe.
Looking
at
that,
2022
look
back,
but
it
is
the
case.
B
So
thank
you
for
your
patience
on
looking
through
that
one.
It's
a
it's,
not
a
simple
issue,
although
that
is
the
simplest
portfolio
we
have.
So
could
you
get
back
two
slides?
Please
thank
you.
So
that's
our
bond
portfolio,
our
Equity
portfolio
for
the
quarter,
was
up
8.41,
that's
for
the
year
down
17.57,
so
we
definitely
did
not
close
the
year
at
the
lows.
If
we
look
down
the
first
three
portfolios,
you
can
see
the
for
the
fourth
quarter
and
again
the
S
P
500
is
by
far
the
largest
one.
It's
almost
one.
B
It's
a
little
bit
more
than
one-third
of
the
assets.
31
million
dollars
up
7.56
percent
57
percentile,
which
is
about
what
we
would
expect
and
then
18.13
loss,
which
is
slightly
worse
than
the
Benchmark
again
acceptable
ranges
same
is
true
for
the
index
fund,
but
I
always
like
to
have
at
least
one
positive
thing
to
look
at,
and
that
would
be
Hotchkiss
and
Wiley
Hotchkiss
and
Wiley.
Two
years
was
the
one
who
was
investing
in
things
that
would
never
go
up
again.
Their
portfolio
is
unchanged.
They're
patient
portfolio
is
still
relatively
cheap.
B
B
They
don't
know
what
they're
doing
it's
time
to
to
get
rid
of
them.
If
we
do
need
to
take
money
from
a
portfolio
this
year,
this
will
be
the
one
right
we
will
be
taking
profits
from
it
and
that's
part
of
our
discipline.
So
the
next
slide
we're
going
to
go
on
to
two
of
the
other
Equity
portfolios
and
again
the
Stevens
small
cap
portfolio.
It
was
slightly
worse
than
their
Benchmark
over
the
last
three
years,
five
years
and
seven
years,
they're
above
median
and
their
Universe.
B
This
is
not
a
hyper
aggressive,
small
cap
growth
portfolio
and
we
like
it
that
way.
But
then
look
at
our
Causeway
International
value
fund,
remember
I,
said:
equities.
International
equities
came
back,
they
stormed
back
during
the
fourth
quarter
and
you
can
see
that
this
one
was
even
a
little
bit
more
than
that.
So
11
of
the
portfolio
is
up
22
percent
during
the
quarter.
B
That's
a
remarkable,
remarkable
Snapback,
but
also
remember
that
when
markets
recover,
when
they
turn
the
corner
from
bear
Market
to
bull
market,
it's
the
early
stages,
where
you
see
the
most
dynamic
returns
so
their
last
year,
they're
down
6.76,
which
is
20th
percentile.
That's
a
lot
of
of
time
spent
on
return.
So
you
have
any
more
questions
before
I
move
on.
B
Thank
you,
I'm,
going
to
jump
ahead
a
few
slides
here.
So
this
is
our
one
of
our
bond
portfolios.
A
little
bit
of
volatile
return.
You
can
see
that
the
returns
are
higher
on
the
scatter
plot,
but
they
are
a
bit
more
volatile
and
that
was
good
for
them.
Last
quarter
next
slide
shows
one
more
double
line,
which
is
a
little
bit
different.
They
don't
do
things
the
same
way:
they're
more
macro,
oriented,
meaning
they'll,
invest
more
in
mortgage
backs
and
have
interest
rate
strategies,
and
so
they
have
trailed
off
since
2020.
B
next
slide,
you
can
see
of
long
term
they're,
not
bad
they're,
really
close
to
their
Benchmark
next
slide.
Lord
Abbott!
This
is
our
High
Yield
Fund
again
it
was
one
of
our
better
performers
for
the
year
keeping
a
little
watch
on
them.
They
haven't
had
any
major
Personnel
changes,
but
I
don't
like
the
deterioration
when
the
blue
line
goes
down.
That's
that's
not
good,
so
keep
any
extra
eye
on
them
right
now
and
then
one
more
one
more
please.
So
this
is
the
Hoisington
experience
right.
B
We've
been
through
this
we've
had
them
for
some
time
they
are
either
the
best
or
the
worst
and
unfortunately,
I
wish
they
weren't,
always
the
worst
but
they're
a
hedging
portfolio
that
does
some
volatility,
has
some
positive
effects
on
volatility.
So
next
slide
we're
going
to
be
going
over
our
index
font.
You
can
see
this
doesn't
have
a
three-year
history,
because
remember
we
moved
to
a
share
class
that
was
extremely
cheap.
The
cheapest
Index
Fund
out
there
next
slide.
B
B
You
can
get
pretty
aggressive
in
small
cap
growth
I
tend
to
be
want
to
be
less
aggressive
in
the
really
volatile
asset
categories
and
that's
the
portfolio
that
we
have
here
and
and
I
like
it,
I
like
to
be
less
aggressive
with
higher
Returns
on
the
risk
return
plots
there,
the
the
the
scatter
plot,
with
the
two
dots
on
it,
there's
no
better
place
to
be
than
where
they
are
on
the
left
hand
side.
So
that
means
higher
return
and
lower
volatility.
That's
exactly
where
you
want
to
be
so.
B
I
think
we're
getting
really
close
to
the
end
here,
but
I
need
to
highlight
a
couple
more
things:
one
more
actually
Causeway
great
recovery
during
the
fourth
quarter.
Another
one
please!
So
let's
go
some
more
here,
another
one.
So
this
is
our
table
of
correlations
over
the
last
five
years.
This
means:
how
do
our
assets
perform
versus
one
another
when
one's
up
are
they
all
up,
or
is
there
one
or
two
that
are
down
in
the
last
year?
We
saw
really
high
correlations,
because
both
stocks
and
bonds
are
down.
That's
unusual.
B
If
we
look
at
the
column,
the
fourth
one
over
called
Hoisington.
If
you
take
a
look
at
that,
you
actually
have
negative
correlations,
albeit
small.
Let
me
explain
the
scale
the
scale
is.
1.00
means
perfect,
positive
correlation
right
if
one
asset
goes
up,
ten
percent,
the
other
one's
up,
ten
percent,
if
it's
negative
1.0,
that's
perfect,
negative
correlation,
meaning
if
one's
up
ten,
the
other
one
will
be
down
10.
B
we
like
to
have
negative
correlations
on
assets,
because
that's
diversification.
In
statistical
terms,
we
have
one
asset
Hoisington
that
they
have
negative
correlation
with
the
most
of
the
other
asset
categories
and
very
weak
correlation
with
the
total
fund
there,
you
will
notice
that
our
correlation
of
the
total
fund
on
the
bottom
line-
it
is
relatively
low
with
our
bond
portfolios,
but
it
is
much
higher
with
our
Equity
portfolios,
which
tells
you
equities,
are
the
asset
generating
asset
class
and
our
portfolio
is
geared
more.
B
So
next
slide
again
update
this
one
to
on
notice
or
on
watch
sorry
for
Hoisington
I
guess
they
would
be
surprised
if
we
weren't
taking
some
notice
on
the
portfolio
and
then
fees
fees
are
very,
very
important
here.
The
expense
ratio
on
a
weighted
average
basis
is
44
basis
points.
The
average
of
those
categories
when
we
total
it
up
at
our
asset
allocation
would
be
90
basis
points
which
means
that
we
are
46
basis
points
less
expensive
than
average,
so
we're
paying
half
of
average
in
the
mutual
fund
world.
B
Right
now
we
are
below
in
every
category
except
for
Hoisington,
which
is
slightly
above
and
makes
me
watch
them
even
closer.
So
at
the
total
market
value
at
the
end
of
the
quarter,
which
was
85
86
million
dollars,
the
annual
savings
through
selection
of
low-cost
funds
is
352
thousand
dollars.
So
that's
good
and
then
I
think
that
is
it
for
the
quarterly
report.
Can
we
go
another?
This
is
the
dashboard.
Where
essentially
no
surprise
is
here.
B
B
in
non-us
equities
and
even
and
even
fixed
income
was
at
a
nice
return
during
the
month
of
January.
Next
slide
shows
this
sort
of
spoiling
the
punch
here:
91.8
million
dollars
that's
one
month,
that's
a
good
month,
I'm
going
to
spoil
it
even
worse
and
say
that,
as
of
last
night,
we
were
still
at
91
million
dollars,
so
we've
maintained
that
that's
good
at
a
volatile
month
and
then
the
next
slide
shows
the
return.
So
the
month
7.18,
which
is
good
for
the
quarter,
we're
up
8.82
through
the
trail
in
one
year.
B
Can
you
believe
that
one
month
you
drop
one
month
off
and
we
go
from
a
loss
of
16.9
percent
to
a
loss
of
6.9
percent?
This
is
how
returns
work.
Remember
we're
looking
to
The
Far
Side,
the
three
years,
the
five
years,
the
since
Inception,
which
doesn't
change
much
at
all
over
time,
but
the
quarter
was
strong.
You
look
at
our
bond
portfolios
for
the
month.
You
can
see
we're
up
anywhere
from
3.09
to
6.47.
B
B
You
know
we're
hearing
a
lot
of
scrutiny
on
the
big
energy
companies
right
now
you
know
you're,
making
all
this
money
and
you're
not
going
to
you
know
drill
any
new
wells
or
or
anything
back
you're.
Just
going
to
reward
shareholders,
and
that's
probably
going
to
continue
to
happen,
the
one
thing
that
I
did
ask
Stan
about
is
share
BuyBacks,
which
is
a
popular
way
to
reward
shareholders.
When
things
are
good,
there's
a
one
percent
tax
on
share
BuyBacks
right
now
for
domestic
companies.
B
He
said
that
could
go
up,
but
if
that
were
to
happen,
they
would
probably
shift
the
balance
between
share
BuyBacks
and
dividends.
So
there
are
multiple
level
levers
there
and
I
did
remind
Stan.
Also
that
don't
fall
in
love
with
energy.
There
are
other
cheap
parts
of
the
marketplace
out
there
and
he's
absolutely
value.
Managers
can
be
that
way
once
they
find
once
they
hold
a
trade
for
a
while
think
about
it.
He's
held
these
for
five
years.
They've
only
performed
great
in
the
last
two.
He
sees
a
lot
of
Runway
ahead
of
them.
B
It's
very
tempting
for
the
Investor's
mindset
to
say
this
is
just
going
to
go
on
forever
and
then
you
can
see
Causeway
had
another
great
month
and
that
led
to
26
return
for
the
quarter
and
very
interestingly
enough.
We
have
two
portfolios
with
positive
returns
for
the
12
months
ended
131,
which
is
a
remarkable
turn.
Those
are
both
value,
they're,
both
Equity
managers,
and
that
is
kind
of
what
you
do
see
when
markets
turn
from
dramatic
downturns
to
Rises.
B
Just
a
minute
on
the
market
slides
here,
I'll
take
just
a
couple
of
minutes
here,
put
some
things
in
perspective:
this
is
long-term
Market,
history,
I
think
we've
been
through
this.
We
are
still
you
know.
We
have
drawdowns,
we
have
increases
and
over
time
the
market
does
go
higher
because
of
what
it
represents
next
slide.
This
is
the
bond
market
right.
It's
going
to
take
a
while
longer
for
the
bond
market
to
recover,
but
it
has
recovered
quickly
in
the
past.
B
B
The
bottom
of
the
bond
market
to
climb
10
and
a
half
34
and
a
half
and
12.55
percent,
so
the
returns
can
be
strong
going
forward
and
we've
kind
of
seen
some
of
that
next
slide,
I
think
I'm
going
to
end
with
this
one.
This
is
a
scatter
plot,
so
this
shows
you
in
return.
Space
What
returns
generally
look
like
for
the
U.S
Equity
investor
and
that's
assuming
that
you're
too
big
enough
two
biggest
asset
classes
or
S
P
500
and
the
aggregate
Bond
Index
right.
B
So
the
vertical
shows
you
the
return
of
the
S
P
500
for
each
of
these
years,
so
1985
or
1982.
That
return
was
about
21
right
the
where
and
then,
if
you
look
at
the
horizontal
axis
from
left
to
right,
that
shows
you
the
return
of
the
bond
market.
So
when
I'm
looking
at
these
years,
1982
the
equity
Market
was
up
20,
the
bond
market
was
up
32
percent
right.
That's
what
that
shows
you
in
this
case.
The
best
place
to
be
is
the
North
East
quadrant,
as
you
look
at
it.
So
that's
phenomenal.
B
Where
are
we
we're
22
2022
I
argued
that
that
dot
shouldn't
be
green,
but
that's
because
our
corporate
color
is
that
color
should
be
red.
No,
it
all
feels
that
way.
But
on
that
column
you
can
see
that
the
bond
market
was
down
18
and
the
stock
market
was
down
13.
again,
nothing
anywhere
near
that
even
in
2008,
which
was
the
financial
system
and
the
world
economy.
B
That's
a
good
question:
I
will
have
to
get
back
to
you.
I
can
get
back
to
you
before
I
leave
today,
but
it
is
if
we
I
want
to
I
want
to
answer
that.
Give
you
a
good
question.
It
is
not
our
International
Equity
exposure.
The
total
is
about
10
percent
I'm,
going
to
ask
you
to
go
to
one
slide
for
me
really
quickly
and
it's
in
the
it's
in
the
1231
report.
It's
near
the
beginning.
B
Think
it's
a
wonderful
question
there,
so
this
is
The
Benchmark
index
that
Causeway
uses.
If
you
look
on
the
right
hand
side,
this
is
international
Equity,
so
we
use
what
is
called
the
acqui
index,
that
is
the
all-country
world
x-us.
So
it's
all
countries
in
the
world,
except
for
the
United
States,
and
it's
weighted
on
a
GDP
basis,
so
that
gray
column
tells
you
the
waiting.
B
B
Those
two
might
go
negative
at
the
same
time
that
is
12
or
13
percent
of
the
28
percent.
That's
Emerging
Markets,
so
they're,
almost
40
percent
of
the
entire
Emerging
Markets
complex,
is
in
those
two
countries
which
I'm
cautious
on
them.
Right
now.
For
a
lot
of
reasons,
one
thing
also
to
notice:
there's
no
Russia
in
that
index
anymore.
If
you
remember
last
February
yeah.
A
B
They
were
completely,
they
were
part
of
the
index.
It
was
relatively
small
last
year,
but
the
Morgan
Stanley
Capital
International,
that's
the
index
provider
said
you're
out
of
the
index,
which
means
that
you're
virtually
uninvestable
and
if
you
had
any
Holdings,
which
we
did
tiny
bit
in
Russia,
it's
still
been.
It's
been
marked
down
to
zero
and
you
still
cannot
trade
it.
B
A
A
A
F
E
The
cafe
anymore,
no
I,
just
have
a
few
points
to
make
about
the
June
30
financial
report.
The
first
point
is:
if
you
look
on
page
one,
the
financial
report
was
giving
given
an
unmodified
opinion
from
the
Independent
Auditors,
which
is
what
we
want,
and
the
full
report
can
be
found
on
page
one
and
then
from
there.
If
you
can
turn
to
page
nine
and
the
statement
of
plan
net
position,
what
I
wanted
to
point
out
there
is
that
at
June,
30th
2022,
the
trust
reported
a
net
position
of
85.86
million.
E
The
next
thing
I
would
like
to
talk
about
or
point
out,
is
the
funded
ratio,
and
if
you
can
turn
to
page
35,
they're
going
to
be
several
pages,
but
the
the
trust
funded
ratio
looks
at
how
much
Actuarial
liability
the
trust
has
versus
how
much
the
net
position
or
money
it
has
to
pay
that
liability
at
June.
30Th
katpa
could
pay
52
percent
of
the
liability
with
the
funds
that
it
has
and
that's
an
increase
of
3.9
percent
over
the
prior
year
ratio
of
48.1.
E
A
A
Hey
we
have
a
motioned
and
a
second.
If
everyone
would
vote
the
actor
is
accepted.
Thank
you.
You
can
go
ahead
and
move
on
to
the
next
item,
which
is
the
acceptance
of
the
interim
financial
report
for
the
period
ended.
December,
31st,
2022.
I
hope
that
just
like
Doug
lifted
our
Spirits
with
the
monthly
report
I.
E
Know
this
one
here:
I
only
have
one
point:
I
wanted
to
talk
about,
and
it's
on
Page
Six
and
I'm,
just
turning
it
and
that's
the
statement
of
changes
in
plan
net
position
at
December,
31st
2022
the
report
that
the
report,
the
trust,
reported,
a
net
position
of
86.75
million.
This
is
an
increase,
so
that's
great,
but
it's
only
an
increase
of
885
thousand
dollars
over
June
30th.
So
we
are
starting
to
see
an
increase
in
it.
E
A
A
So
our
next
item
is
to
ratify
and
approve
the
issuance
of
a
request
for
proposals
advertised
by
the
City
of
Oklahoma
City
and
the
Oklahoma
City
Municipal
facilities
Authority
for
a
self-funded
and
fully
insured
medical
prescription
plan
for
the
City
of
Oklahoma
City
and
participating
public
trust,
employees,
retirees
and
eligible
dependents.
Effective,
January,
1,
2024.
I'd,
like
to
welcome
Jason
long
to
the
podium
Jason
has
appeared
before
us,
as
the
interim
Total
Rewards
manager
and
today
I'm
happy
to
present
him
to
the
trust
as
the
permanent,
inter
or
permanent
total
rewards
program
manager.
F
F
A
No
I
think
I
do
want
to
just
point
out
that
that,
due
to
the
timing
of
our
meetings
and
the
frequency
of
the
city's
meetings
as
well
as
the
MFA,
it's
going
to
be
sometimes
important
that
we
move
ahead
with
an
RFP
before
this
body
actually
gets
to
review
it.
But
I
do
want
to
say
that
in
the
event
that
you
were
to
find
something
in
the
RFP
that
was
of
concern
to
you,
I'm
sure
that
we
could
bring
that
forward
to
our
trustee
Amy
Madera.
A
And
she
would
make
sure
that
that
comment
was
incorporated
into
whatever
pre-proposal
conferences
or
negotiation
strategies
that
the
city
might
undertake
in
the
actual
final
product
of
that
benefit
package.
So,
while
it
is
necessary
for
us
to
keep
the
business
moving,
we
wouldn't
want
to
have
even
our
retirees
affected
by
the
elapse
in
those
services
and
benefits.
There
is
still
an
opportunity
for
the
trust
to
make
any
concern
returns
known
to
Amy
in.
G
F
And
also
just
for
full
disclosure,
probably
for
the
I
guess
our
next
meeting
will
be
in
May.
There
will
be
an
items
out
there
for
not
only
the
mapd
to
ratify
that
RFP
proposal,
but
we
will
also
be
looking
at
a
proposal
to
ratify
our
group
Live
products
since
retiree
life
is
a
component
of
that
as
well.
So
that
should
be
on
the
next
agenda.
Thanks.