►
Description
San Bruno Planning Commission Meeting May 17, 2011
8. San Bruno Urban Water Management Plan
A
B
B
B
Our
water
resource
is
based
on
two
major
water
resource
is
the
surface
world
which,
based
on
our
master
contract
with
PUC,
is
provided
through
our
contractual
agreement
with
PUC
and
our
own
grandpa
reproduction,
which
is
governed
by
the
groundwater
management
plan,
which
will
come
back
for
you
is
under
development
right
now,
and
you
will
see
the
draft
plan
coming
back
for
your
consideration
in
the
next
two
months
for
to
assess
the
reliability
and
sustainability
of
the
system.
The
infrastructure
itself
is
under
development
right
now.
B
This
draft
plan
was
presented
to
utility
subcommittee
and
the
recommendation
and
suggestion
by
the
utility
subcommittee
were
incorporated
in
in
the
draft
I
will
let
UK
I
was
chosen
to
help
us
developing
the
urban
water
management
plan
and
I
will
add,
matt
suka
to
present
the
plan.
I
have
here
also
because
more
crane
hide
the
bottle
service
manager
and
also
robert
howard,
the
deputy
for
operation
and
maintenance,
to
help
us
with
any
question
what
you
might
have.
C
Thank
You
mr.
mayor
council
members,
my
name
is
Matt
zucca
I'm
with
earlier
and
kalinowski.
As
Clara
mentioned,
you
all
have
received
a
copy
of
the
public
review
draft
of
your
water
management
plan.
The
information
that
I'm
going
to
go
through
tonight,
I'm
and
this
presentation
I,
will
go
through
fairly
quickly.
All
the
information
here
is
contained
in
the
document,
so
this
is
really
for
the
benefit
of
summarizing
everything
for
the
public
in
advance
of
the
public
hearing
as
an
executive
summary
to
the
information
in
the
document
and
in
the
presentation.
C
Basically,
san
bruno
has
adequate
water
through
the
combination
of
surface
water
and
groundwater
to
meet
the
anticipated
growth
through
the
planning
horizon
of
the
document,
which
is
20,
30
50.
You
have
already
achieved
your
urban
water
use
targets
which
are
required
by
state
law
for
the
year.
Twenty
20
and
I'll
talk
in
more
detail
about
that,
but
those
are
already
have
already
been
met,
and
but
even
though
you
are
already
at
your
targets,
yeah,
the
document
does
show
how
san
bruno
continues
to
implement
water
conservation
measures.
C
So
that's
sort
of
the
in
a
nutshell.
What
I'll
be
talking
about
a
little
bit
more
detail?
The
urban
water
management
planning
act
as
an
outline
I'll.
Give
you
a
little
bit
of
information
on
that
some
background
information
regarding
the
city,
the
key
of
the
urn
water
management
plan,
which
is
the
water
supply
and
demand
forecasts,
talk
a
little
bit
about
the
drought.
Water
supplies,
the
water
conservation
act
of
2009.
C
Basically,
the
first
and
foremost
the
urban
water
management
planning
act
is
a
lack.
It
outlines
how
the
city
is
going
to
meet
your
demands
over
a
20-year
a
horizon.
Typically,
we
would
be
the
25
in
this
document
and
it
forms
the
basis
for
your
water
supply
assessments
that
you
might
do
in
support
of
any
future
growth.
This
would
be
the
reliance
document.
It
said
that
they
would
rely
on
and
it's
required
to
be
updated
every
five
years.
C
The
Act
requires
that
we
look
at
water
demand
that
we
compare
that
to
supplies
that,
to
the
extent
that
it's
a
relevant
look
at
groundwater
and
recycled
water,
talk
about
the
supply
ability
or
supply
ability,
the
reliability
in
event
of
a
drought
again,
look
at
the
shortage,
contingency
planning
in
the
catastrophic
interruption
to
supply.
So
these
are
actually
requirements
that
we
have
to
address
in
the
document.
C
Additionally,
since
the
passage
of
the
Act
Water
Conservation
Act
of
2009
requires
that
each
agency
effectively
reduce
your
per
capita
consumption
by
twenty
percent
by
the
year.
Twenty,
twenty
and
again
I'll
talk
about
how
you've
actually
already
met
that
target
as
I'm
sure
you
already
know
the
water
supply
agreement
that
you
have
a
San
Francisco
is
governed
by
an
agreement
that
was
entered
into
in
July
2009.
It
provides
for
184
million
gallons
per
day
for
the
San
Francisco's
wholesale
customers.
C
Excuse
me,
the
normal
water
supply
for
San
Bruno
is
guaranteed
at
3.25
million
gallons
per
day.
That's
normally
here
it's
subject
to
reduction
in
droughts
in
cases
of
emergency
or
whatever.
There
are
other
portions
of
the
agreement
to
govern
those
within
a
normal
year.
That
is
your
supply
guarantee.
Your
interim
supply
allocation
is
valid
through
2018,
it's
at
a
reduced
level
on,
but
it
doesn't
affect
your
guarantee.
C
This
is
really
a
consumption
above
which
you
might
pay
an
incremental
rate,
but
in
no
way
does
it
affect
your
your
actual
guarantee,
its
analysis
and
interim
allocation
effectively,
and
it
is
like
I
said.
It
is
technically
valid
through
2018
a
little
bit
about
the
baseline
information
that
we
relied
on
for
developing
on
the
urban
water
management
plan,
several
sources
of
both
growth
for
population
and
employment,
including
a
bag.
Your
general
plan,
plus
some
specific
plans
regarding
the
transit
corridor,
we're
all
looked
at
and,
as
you
can
see,
growth
is
happening
in
our
water.
C
Demands
are
move
eventually
with
that
pie,
charts
regarding
the
connections
by
category
and
the
connection
is
any
metered
connection
to
the
water
system.
As
you
can
see
in
2009
and
2010,
approximately
eighty-five
percent
of
your
connections
are
single
family
residential,
with
approximately
seven
percent
being
multifamily
and
420
420
34
2035.
We
don't
expect
the
huge
shift
in
the
actual
connections
comparing
that
to
consumption.
C
However,
you'll
see
that
on
a
total,
you
have
fifty
three
percent
consumption
for
residential
single-family,
twenty
four
percent
for
multifamily
and
your
commercial,
although
it
makes
up
a
smaller
number
of
connections,
is
actually
a
substantial.
You
know
amount
of
consumption.
This
is
in
2009-2010
historical
distribution
of
water,
a
lot
of
numbers
here,
really
the
main
focus
is
that
they
should
look
at
is
that
there
is
a
trend
in
the
last
few
years.
That
we
believe
is
largely
associated
economic
downturn
on
this
trend
is
followed
on
the
blue
line
by
the
all
de
Bosco
agencies.
C
This
is
the
aggregate
amount
consumed.
So
what
we're
seeing
in
trend
wise
over
the
last
few
years
is
consistent
with
other
agencies.
We
do,
however,
expect
that
there
might
be
a
rebound
effect
on
these
water
demands
as
the
economy
recovers.
So
the
most
recent
data
don't
necessarily
indicate
what
what
the
near-term
consumption
can
be,
and
this
is
a
slide
showing
your
over
the
same
five-year.
Look
back.
C
What
you've
used
in
terms
of
your
San
Francisco
purchases,
which
are
in
the
blue
on
the
top
of
the
bar
column,
and
then
your
ground
water
production
on
the
bottom?
You
do
purchase
a
small
amount
of
retail
water
from
the
north
coast,
County
Water
District,
but
as
you
can
see,
it's
a
very
small
percentage
overall,
historically
you've
been
about
5050
groundwater
surface
water
with
a
slightly
higher
production
in
groundwater
in
the
last
year.
This
this
aerial
shows
basically
the
extent
of
the
groundwater
basin
that
you
draw
from
the
airport
is
located
right
here.
C
These
blue
lines
represent
basically
the
depth
from
surface
to
the
bottom
of
your
water
bearing
layer.
So
this
is
the
depth
of
the
aquifer.
If
you
will
so
we're
dealing
here
in
feet
below
ground
surface-
and
you
can
see,
this
is
about
a
600-foot
contour
line
and
when
you
get
south
towards
Burlingame
your
200
feet
of
depth,
so
really
San
Bruno
is
sort
of
overlying,
some
of
the
deeper
parts
of
the
aquifer,
with
what
we
call
a
bedrock
high
that
exists
right
in
sort
of
the
millbrae
area.
C
Just
to
give
you
a
sense
of
what
the
aquifer
looks
like
and
the
way
groundwater
flows
up
in
the
city
sunset
area,
it
flows
out
to
the
ocean.
There's
a
divide
here
where
it
starts
flowing
south
toward
san
bruno
in
san
bruno
represents
sort
of
the
low
spot
of
the
wall
of
the
basin,
and
then
it
flows
north
from
burlingame
towards
the
wells
here.
C
So
that's
sort
of
how
the
groundwater
basin
works
in
the
city
does
the
low
spot
in
the
deepest
spot
low
spot,
not
necessarily
a
temporal,
does
tend
to
have
some
of
the
deeper
areas,
but
if
you
think
about
it,
the
low
spot
could
be
just
the
water
table
depressed.
If
there
are
two
separate
issues,
you
know
there's
two
separate
factors,
so
the
low
spot
is
really
more
associated
with
we're
pumping
in
where
the
water
table
the
shape
of
the
upper
water
table.
C
There
is
a
regional
conjunctive
use
in
conjunctive
uses
any
combination
of
surface
water
and
groundwater.
An
evaluation
was
done
back
in
the
early
two
thousand
timeframe,
where
several
agencies
participated,
and
what
was
done
is
that
the
surface
water-
and
this
represents
pumping
of
groundwater.
San
bruno
and
some
of
the
other
cities
was
banked
up
over
series
of
years
to
see
how
that
might
accumulate
and
how
cities
michael
off
the
surface
water
and
onto
ground
round
water
and
uses
banked
up
water
during
dry
years.
C
That
was
an
evaluation
that
was
done
and
the
city
is
undergoing
discussions
right
now.
On
that
front,
this
is
sort
of
a
little
bit
of
a
repeat,
but
this
is
your
five-year
look
back
on
your
ground
water
production,
again
relatively
constant,
a
little
bit
higher
/
2009
2010,
bringing
these
two
together,
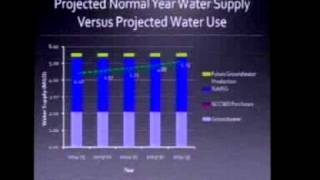
a
water
demand
and
supply,
so
you're,
you're,
look
out
for
your
demand
is
5.13
within
the
point
of
MGD
million
gallons
per
day.
This
is
on
an
annual
average.
C
They
take
total
consumption
divided
by
the
number
of
days
in
the
year,
and
2035
is
5.13
broken
out
by
category,
so
your
residential
CI
is
commercial,
industrial
institution,
institutional.
So
again
predominantly
a
residential
demand.
Your
supply,
basically
is
a
combination
of
your
your
surface
water
from
San
Francisco,
your
groundwater,
future
groundwater
that
you
plan
on
pumping
and
then
your
North
Course
not
close
to
purchases
as
well.
C
C
There
are,
there
are
several
projections
we
relied
on.
I
looked
at
a
combination
of
them,
a
vague
2009
there's
also
the
general
plan
growth,
and
then
there
are
we
use
for
our
population
projections,
the
eight
bag
2009
and
in
primarily,
because
the
population
then
sort
of
drives
the
water
demand.
So
for
us
it's
about
the
water,
and
we
also
did
look
at.
Thank
you.
C
C
C
Here
what
you'll
see
is
that
this
blue
line
is
the
a
bag
going
out
to
2035.
These
dots
represent.
Basically,
as
you
pointed
out,
singular
point.
So
this
blue
dot
is
the
employment
with
the
general
plan
plus
the
transit
corridor
plan
and
then
the
purple
dot
would
be
the
population
with
a
general
plan.
What's
the
transit
corridor
plan,
so
we
looked
at
all
of
these
and
trying
to
figure
out
how
it
affected
our
water
demands
that
make
sense.
C
Dry,
your
water
supply.
We
are
required
by
the
act
to
look
at
water
supply
during
normal
single
dry
and
multiple
dry
years.
You.
Basically,
there
are
two
ways
that
this
is
accounted
for
here.
There's
a
plan
between
San
Francisco
and
the
retail
agencies
that
divides
up
the
available
water.
I'm.
Sorry
between
dedup
in
San,
Francisco
and
Bosco,
which
is
the
represent,
represent
ative
agency
for
San
Bruno
and
then
amongst
the
possible
agencies.
There's
a
tear
to
plan-
and
you
guys
I
think
recently
saw
this
here
to
plan.
C
It
has
been
adopted
by
all
of
the
wholesale
agencies,
including
San
Bruno,
there's
a
complicated
formula.
That's
explained
on
the
slide
and
I'm
not
going
to
go
through
it,
but
just
to
show
that
it
is
a
relatively
significant
spreadsheet.
That's
involved
in
calculating
what
your
your
allocations
are
doing
a
dry
year,
and
this
is
basically
what
a
three-year
look
ahead
would
look
like
if
you
were
to
start
today
and
have
a
dry
year
going
forward
into
a
three-year
dry
year
period.
Where
this
was
your
2009
2010
demand,
you
could
conceivably
under
the.
C
If
you
look
at
the
historical
climate
record,
the
you
know,
potentially
the
amount
of
surface
water
could
be
reduced,
and
if
you
assume
the
small
decrease
in
groundwater
production,
your
third
year
would
be
out
at
3.85,
that's
less
than
your
turn
for
us
more
than
your
current
demand.
So
you
know
look
up
three
year.
Look
ahead,
shows
that
you
have
enough
water,
currently,
even
assuming
a
small
decrease
in
groundwater
production.
C
We
also
looked
as
part
of
the
serving
water
management
plan
at
the
potential
participation,
or
not
participation
actually
of
an
individual
conjunctive
use,
which
is
rather
than
regionalizing.
Conjunctive
use
across
multiple
cities
is
that
this
that
San
Bruno
could
individually
look
at
during
dry
years,
purchasing
more
surface
water
and
allowing
the
ground
water
table
to
recover
so
that,
during
a
concert
during
normal
years,
so
that
during
dry
years,
you
could
increase
pumping
and
be
less
reliant
on
the
surface
water
that
was
provided
by
San,
Francisco
or
actually
thank
you.
C
C
So
this
is
something
that's
considered
in
the
document
as
well.
Senate
bill,
seven
I
talked
a
little
bit
about
this.
This
is
the
20
by
2020,
where
you're
required
to
reduce
per
capita
demand
by
twenty
percent.
You
can
comply
individually
or
as
a
region.
Some
people
are
going
to
be
looking
to
comply
regionally
and
non-compliance
is
really
a
loss
of
access
to
grants.
For
water
loans,
that's
sort
of
the
consequence
of
it,
but
to
give
you
a
sense
of
where
San
Bruno
is
this?
Is
the
water
consumption
going
back
to
95-96
through
last
year?
C
And
if
you
look
at
your
five-year
baseline,
it's
89
gallons
per
capita
per
day.
Your
ten-year
baseline
is
ninety
five
gallons
per
capita
per
day,
and
basically
your
your
water
use
target
is
target
usage,
would
be
124
you're
effectively
below
that
and
in
particular
you're,
even
below
the
100
gallon
per
capita
per
day
threshold,
which
means
that
you
have
to
do
effectively
to
comply
with
this
act.
Nothing.
If
you
were
above
100,
you
would
still
have
to
cut
back
a
minimum
of
five
percent,
but
because
your
per
capita
demand
is
so
low.
C
C
C
There
are
people
that
are
gonna
want
to
knock
on
your
door
about
teaming
and
that
regional
compliance,
and
so
that's
a
possibility.
So
so
we
could
pound
on
the
team
Jack.
What
do
you
attribute
that
to
it's
a
combination
of
factors,
some
of
the
local
agencies
that
have
that
microclimate
is
one
on
potentially
smaller
lot.
Size
is
another
aspect
of
it.
Also
when
you
look
at
other
communities
like
Burlingame,
where
they
have
a
large
indoor,
a
large
Hotel
population,
that's
a
transient
community.
C
They
get
all
the
water
demand,
but
no
population
credit
for
that
and
the
demographics
note
the
way
the
water
demand
is
broken
out
in
the
city
of
San.
Bruno
is
different,
so
many
communities
that
don't
have
a
lot
of
that
transient
demand
benefit
in
this
regulation
because
they
have
of
the
way
it's
total
consumption,
divided
by
total
population
and.
C
Okay,
so
these
are
the
movie
called
best
management
practices,
demand
management
measures
that
the
city
implements
were
required
by
the
Act
to
describe
and
they're
described
in
detail
in
the
document.
What
the
city
currently
does
out
of
the
14
13
of
the
14
are
being
implemented,
and
the
14th
really
relates
to,
if
you're
selling
water
to
another
retail
agency,
so
it
doesn't
apply
so
to
Clara's
comment
regarding
conservation.
The
city
is
participating
in
one
form
another
and
all
of
these
various
programs,
the
catastrophic
interruption
of
supply.
Several
things
have
been
done.
C
Obviously,
you've
all
heard
about
the
capital
improvements
program
that
San
Francisco's
put
in
place
their
multi-billion
dollar.
That
is
obviously
intended
to
increase
the
reliability
and
of
the
regional
system,
but
san
francisco,
san
mateo,
county
and
city
cembran
will
all
have
emergency
response
plans
in
terms
of
how
to
address
an
interruption
in
the
supply
to
the
region
of
water.
C
So
all
those
documents
are
in
place
and
have
been
shared
in
the
event
of
either
a
drought
or
a
catastrophic
or
significant
reduction
here,
or
what
we
call
sort
of
the
stages
of
action
on
the
Act
requires
that
we
look
at
several
up
to
fifty
percent
on
stage
one.
We
call
sort
of
the
voluntary
stage
which
is
up
to
ten
percent
and
they
really
are
more
public
education,
oriented
bill
inserts
and
more
messaging
related
to
asking
for
voluntary
cutbacks.
C
When
you
go
to
stage
two
at
the
upper
end,
you
would
start
considering
mandatory
cutbacks,
mandatory
conservation
measures,
because
twenty
percent
is
fairly
substantial,
cut
back
upwards
of
35.
You
would
continue
to
implement
mandatory
and
then
further
enforce
them,
potentially
look
at
rate
changes
and
other
financial,
just
incentives
for
for
water
consumption
in
excess
of
maybe
certain
allotments,
and
then
you
would
more
aggressively
monitor
for
compliance
and
then
that
basically
just
gets
increased
further.
C
When
you
go
to
stage
5,
where
you're
really
now
starting
to
focus
on
any
outdoor
irrigation
would
stop,
but
it
would
effectively
not
be
used
and
you
would
be
more
trying
to
protect
basic
human
services
and
needs
for
water
and
in
a
very
quick
summary.
Nutshell:
I
have
summarized
that
two-inch
document
in
front
of
you
have
any
question.
That's
great.
D
Don't
have
any
questions
per
se,
but
I'd
like
to
make
a
couple
comments
if
anyone
is
interested
in
our
water
system,
this
is
a
fabulous
document.
The
mapping
and
the
explanation
of
what
we've
done
and
what
needs
to
be
done
to
keep
our
water
system
whole
and
viable
is
all
in
here.
So
you
have
a
boring
saturday
night
I
recommend
it
or
you
can
fall
asleep
you
can.
You
can
do
that.
D
I
just
have
a
comment
that
I
want
to
kind
of
enlighten
the
council
about
or
bring
it
up
on
the
page
72
of
agenda
packet.
There's
a
comment
about
water
supply
alternatives
that
it
is
not
imperative
that
San
Bruno
look
to
alternatives
because
we
will
be
able
to
you
make
our
water
consumption
will
have
enough
water
basically
up
to
the
year
twenty
thirty
five
and
while
that
is
true
and
I
hope
it
stays
that
way.
I
hope
none
of
our
groundwater
gets
contaminated.
I
hope
none
of
those
horrible
things
it
could
happen
do
happen.
D
Bosque
y
as
a
region
is
looking
at
alternate
water
supplies,
either
regionally
two
or
three
cities
together.
However,
we're
doing
it
so
we're
doing
a
huge
study
on
what's
out
there,
what
could
be
built,
what
could
be
negotiated?
What
could
be
saved
all
those
kinds
of
things?
The
preliminary
reports
from
that
will
be
coming
out
this
summer,
so
those
are
some
of
the
questions
and
procedures
from
that
will
be
coming
back
to
the
council.
D
D
A
D
C
A
I
do
but,
but
I
think
just
to
help
me
understand,
maybe
others
too,
if
we
could
help
appreciate
what
what
technical
evaluation
had
to
come
together
to
get
this
data.
I
know
you
worked
on
it
before
and
what
we
have
now,
where
that
comes,
and
what
really
it
took
to
put
this
this
document
together
and
then
the
data
that
that's
received.
That's
making
these
projections
out
to
future
sure.
C
So
would
you
like?
Okay,
there
are
there's
quite
a
bit
of
data
and
there's
actually
some
fairly
intensive
modeling,
that's
done
for
the
for
the
water
supply
projections.
First
and
foremost,
we
look
at
the
historical
consumption
data
that
the
city
maintains
to
the
billing
system
armed
and,
to
the
extent
that
we
have
detail
in
there.
We
try
to
look
at
the
trends
in
the
patterns
of
what's
happened
historically
and
then
rely
on
other
sources
of
information,
specifically
the
city's
general
plan
on
any
kind
of
population
and
employment
forecast,
as
well
as
the
reliability.
C
If
you
will
and
information
that's
provided
to
us
by
San
Francisco
regarding
the
reliability
of
the
water
supply,
we
also
look
at
the
draft
groundwater
management
plan.
That's
currently
in
process.
A
lot
of
this
information
basically
goes
into
a
groundwater
spreadsheet
if
you
will
mater
demand,
modeling
spreadsheet,
that
was
put
together
by
bosca
on
behalf
of
26
retail
agencies
of
recently,
and
it
includes
assumptions
regarding
the
effects
of
conservation
such
as
toilet
change
outs.
It
includes
the
effect
of
other,
basically
other
conservation
measures
as
well
as
well.
C
So
though
the
model
itself
tries
to
take,
though,
all
those
factors
into
account
in
terms
of
how
we
project
the
actual
consumption
and
it's
based
upon
the
historical
as
well
then
again,
the
reliability
aspect
of
it
is
somewhat
different
and
we
rely
on
San
Francisco's
information
and
we
rely
on
information
related
to
the
groundwater
management
plan
in
terms
of
supply
reliability.
So
if
that
answers
your
question,
thank
you.
A
And
we
do
maybe
two
stuff:
do
we
still
have
the
assault?
One
monitoring
are
we
still
doing
that
protrusion,
okay,
intrusion
and
then
what
type
of
conservation
programs
are
we
looking
forward
to?
Obviously
it's
been
noted
that
we've
done
pretty
good.
It's
been
noted
that
we're
using
less
than
when
we
look
back
in
2005,
for
example,
but
what
do
we
have
on
the
horizon
as
far
as
to
continue
on
the
path
that
we've
already
been
successful
on.
A
B
Addition
to
all
of
the
conservation
programs
already
implemented
until
now,
the
grass
to
be
gone
is
one
of
the
pilot
project,
but
the
city
very
successfully
took
on
and
actually
actually
leading,
baska
agencies
with
this
pilot
project
to
believe
even
further
minimize
the
water
used
for
irrigation
also
had
many
educational
classes,
educating
the
public,
how
they
can,
how
they
can
further
reduce
their
water.
Consumption
for
irrigation
also
was
part
of
our
and
I
know
that
the
city
manager
wants
to
jump
in.
B
E
Just
wanted
to
clarify
I
didn't
understand
when
the
director
first
identified
the
grass
begone
program
I,
want
to
clarify
that
that
was
a
landscape
renovation,
project
and
program
that
we're
doing,
in
conjunction
with
a
variety
of
other
native
plant
landscaping
and
drought,
tolerant,
plant
landscaping,
programs
that
have
been
implemented
in
san
bruno
to
tremendous
reception
by
the
public.
We
have
as
many
as
60
people
in
our
classes
that
are
co-sponsored
by
us
and
by
bosca
in
addition
to
that,
our
zoning
ordinance.
So
the
director
mentioned
a
number
of
projects,
in
addition
to
the
long-standing.
E
The
washing
machine
and
loeffel
low-flow
toilet
rebate
programs
that
we
implement
again
in
coordination
with
pascua.
In
addition
to
that,
our
updated
zoning
ordinance
will
look
at
a
variety
of
different
sustainability
initiatives
that
might
be
incorporated
in
our
zoning
code
to
facilitate
what
the
director
was
talking
about
in
terms
of
building
standards
and
other
types
of
of
items
where
we
can,
we
can
be
reasonably
aggressive
in
terms
of
water
conservation
and
again,
following
up
on
ek,
eyes
comment
earlier.
D
The
charity
Larry,
thank
you
and
Bosco-
is
always
thinking
of
new
ways
to
I,
could
serve
water
and
to
develop
programs
in
conjunction
with
not
just
one
city
but
regionally
so
we'll
bring
you
back
more
things,
as
we
think
of
them
up.
Think
them
up.
I.
Think
the
other
thing
people
need
to
remember
as
much
of
the
single-family
resident
consumption
of
water
isn't
the
shower
and
the
washing
machine
and
all
those
stuff.
It's
the
lawns.
D
So
as
we
do
the
new
developments
as
we
do,
infill
development
type
things
with
high
rises
and
high
development
I
mean
high
density.
You
don't
have
lawns
so
a
lot
of
even
though
our
population
will
grow.
We
add
lon
and
that's
where
a
lot
of
the
cansada
consumption
is
so
that's
a
conservation
right
there.
Okay.
A
Any
questions
of
staff
for
consultants
all
right
this
time,
we'll
open
the
public
hearing,
anyone
in
the
public
like
to
address
the
council
on
this
issue,
if
we
close
the
public
hearing
you're
precluded
from
discussing
this
with
us,
any
further
action
move
the
plot
move
to
close
the
public
hearing.
Second
motion:
sucking
your
clothes
public
hearing
on
a
question,
those
in
favor,
aye,
aye
carried
all
right.
There's
no
action
tonight
on
the
side.
So
thank
you
for
the
report
very,
very
thorough.