►
From YouTube: The Future of Observability
Description
No description was provided for this meeting.
If this is YOUR meeting, an easy way to fix this is to add a description to your video, wherever mtngs.io found it (probably YouTube).
A
A
And
these
are
just
one
of
the
many
abilities
of
the
modern
software
and
engineering
applications.
These
days,
there's
usability
scalability
testability,
you
know
readability,
maintainability,
availability,
all
of
these
abilities
and
observability
is
just
now
one
of
these
abilities
right
and
applications.
Different
applications
have
different
scales
for
how
how
much
of
that
quality
needs
to
be
present
in
that
application,
for
example,
maybe
the
blue
app
needs
to
have
a
scalability
twice
as
much
of
a
green
app
on
this
example.
A
B
B
B
B
A
So
inferring
the
operational
state
of
a
system
based
on
its
outputs
you've
got
your
inputs
and
your
system,
which
is
opaque,
and
then
you
have
outputs,
which
you
can
see
measure
and
analyze
and
observability
has
a
quality
scale
itself
right.
So
just
like
scalability
or
maintainability
there's
on
on
one
end,
it
can
be.
You
know
your
your
outputs
leave
the
system
still
completely
opaque.
You
can't
see
into
it
or
on
the
other
hand,
you
have
excellent
observability
and
you,
your
outputs,
render
the
system
completely
transparent.
A
So,
to
kind
of
to
illustrate
this,
we're
going
to
time
travel
back
to
the
to
the
early
2000s,
with
a
very,
very
simple
php
app.
Maybe
this
php
app
just
took
an
image
extracted,
urls
or
metadata
from
the
image
and
outputted
a
simple
page
that
allowed
you
to
see
those
metadata
and
attributes
of
that
image.
A
Well,
if
you
have,
if
you
had,
you
know
things
like
just
server
monitoring
your
cpu
and
memory
of
your
application
of
the
host
of
where
your
application
was
running
and
then
maybe
you
added
a
little
bit
of
the
apache
server
application
logs
to
see
the
amount
of
traffic
or
the
requests
per
second
and
the
amount
of
errors
you're
actually
maybe
doing
pretty
well.
For
this
simple,
simple,
php
app,
you
know
your
observability
quality
scale
might
be
toward
the
higher
end
for
something
this
simple.
A
Why
is
because?
Well,
this
is
a
very
simple,
simple
application
and
early
on
you
know,
15,
10
years
ago
there
was
mostly
identical
years
of
experience
through
the
entire
application
stack,
so
all
of
your
visitors
essentially
could
be
thought
of.
Of
you
know
the
the
same.
The
same
kind
of
experience
you
know,
there's
no
individual
in
application
experience
that
was
different
from
one
visitor
to
another
and
if
you
threw
in
a
little
bit
of
testing
acro
above
and
beyond
this
simple
server
and
maybe
apache
log
monitoring,
you're
actually
doing
pretty
well
and
you're.
A
A
Traditional
monitoring
is
very
low.
Dimensional
we
treated
all
of
these
experiences
is
the
same.
You
know
we
could
measure
and
it
lacked
the
contextual
differences
that
separate
the
one
app
experience
from
another,
and
now,
let's
talk
about,
why
monitoring
is
not
observability
again
with
verner
verbals,
the
cto
of
aws.
B
It
is
only
likely
that
the
operator
of
the
dashboard
knew
how
to
repair
it
when
something
went
wrong,
but
they
did
know
when
the
sounding
alarm
and
gauges
moved
to
where
they
were
supposed
to
go
as
systems
continue
to
increase
in
complexity,
it
is
impossible
to
put
every
important
metric
for
that
system
on
a
single
dashboard.
Every
user
watches
think
about
everything
that
goes
into
a
modern
application.
A
B
Counters
and
mods
for
all
the
work
it's
doing,
you
may
have
anywhere
from
thousands
to
millions
of
customers
all
which
have
data
about
what
they're
doing
and
how
they
interact
with
your
application.
It
is
impossible
to
put
all
of
this
on
a
dashboard
for
the
human
watchers
to
define
alerts
for
each
of
these
metrics.
To
tell
you
when.
A
So
he
made
a
really
important
point
here.
Is
you
know,
monitoring
is
not
observability
and
with
the
most
complex
apps
these
days
or
with
the
the
applications
these
days
growing
more
and
more
complex,
more
services,
interoperability,
more
individual
user,
unique
interactions
with
an
application.
You
can
no
longer
fit
your
monitoring
and
the
the
amount
of
data
that
you
need
for
observability
on
dashboards.
A
Systems
evolve
from
simple
to
complex.
This
is
true
for
applications
today.
It's
also
true,
for
you
know,
telephone
think
about
the
1900s
candlestick
telephone
right.
It
had
different
requirements
and
different
complexities
than
say
the
modern
smartphone
of
the
2020s
right
different
usability
scalability.
All
of
the
leds
were
different
through
these
generations
of
telephone
evolution.
A
It's
true
for
automobiles
and
for
software.
You
know
you
can't
imagine
these
these
software,
facebook
or
google
calendar
or
twitter
existing
today,
as
they
were.
You
know,
15
10
even
less
years
ago,
you
know,
with
the
amount
of
features
and
interactivity
and
infinite
stroke
scrolling
ai,
applied
to
feeds
all
of
these
different
things
that
make
these
applications
just
more
and
more
complex.
A
And
complexly,
like
entropy,
just
increases
right.
It's
true
for
phones,
true
for
applications,
so
monitoring
is
actually
now.
You
know
a
subset
of
observability
in
that
modern
or
in
that
early
candlestick
telephone
with
your
traditional,
say,
basic
monitoring
of
that
system.
You
might
actually
have
been
doing
pretty
well
with
your.
You
know,
observability
as
as
we
talked
about
it
today,
of
what
it
encompasses
to
make
sure
that
you
can
observe
all
of
the
performance
qualities
of
that
system.
A
Again
using
the
example,
the
thp
app
from
the
early
2000s,
you
know
with
our
server
cpu
memory
and
then
apache
logs,
it
might
have
been
pretty
excellent
back
then
those
those
limited
amount
of
metrics
and
throughput
metrics
in
server
metrics
don't
cover
your
observability
needs
for
a
modern
application.
Today,.
A
A
A
A
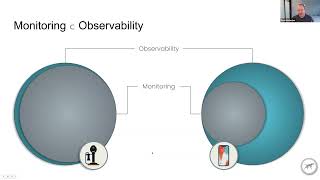
And
so
monitoring
really
is
the
tip
of
the
observability
iceberg
right.
Traditional
monitoring
is
low,
dimensional
and
low
cardinality
things
like
aggregated
metrics
or
summary
statistics
are
the
things
that
we
used
for
monitoring
up
until
recently,
and
that
sits
just
on
a
huge
iceberg
of
contextual
data.
High
dimensional
high
cardinality
data
that
you
need
in
order
to
achieve
true
observability.
A
A
If
you
attach
that
geographical
and
platform
information
now
you
can
break
this
out
and
start
to
see
what
the
composition
of
that
overall
chart
was,
and
we
can
see
that
if
we
actually
go
down
through
the
desktop
and
then
down
lower
to
the
bottom
charts
of
lowe's
matrix,
we
can
see
that
that
second,
that
second
peak
actually
matches
the
new
york
city
and
boston
and
dc
area
for
desktop
users.
So
we
know
that
that's
likely
the
problem
area
for
this
latency
histogram
on
the
higher
end.
A
A
That's
just
a
few
dimensions,
so
you
know
people
have
been
kind
of
taking
the
approach
of
well.
We
can
handle
that.
We
can
just
add
this
contextual
data
to
our
to
our
metrics
and
we'll
we'll
just
make
more
dashboards
and
put
those
more
on
more
dashboards
and,
let's
just
add,
more
monitoring
for
these
dimensions.
Right
and
that's
just
more.
That's
just
more
monitoring!
That's
just
more
dashboards
right,
you're
going
to
have
a
problem
of
you're
going
to
have
just
more
and
more
dashboards
growing.
A
When
you
read
about
observability
or
the
traditional
pillars
of
monitoring,
you'll
read
about
metrics
traces
and
laws,
we'd
like
to
think
of
them
as
these,
these
four
different
constituent
elements
of
observability,
which
we
we
define
as
logs
metrics
spans
and
events
logs,
are
your
traditional
logs,
but
they
include
the
attributes
and
context
identifiers
attached
to
those
logs
as
well.
So
you
can
correlate
the
logs
these
highly
specific
debugging
tools
in
your
logs
to
the
matrix
spans
and
events
that
happen
elsewhere.
A
The
kind
of
analogy
here
is
these
constituent
elements
of
logs
metrics
spans
and
events
aren't
necessarily
super
interesting
by
themselves
or
useful
by
themselves,
but
together
they
compose
the
elements
and
molecules
and
eventually
the
planets
and
universe
that
exist.
So
these
are
the
constituent
elements
of
observability
and
the
context
and
attributes
are
the
key
to
observability.
A
You'll
start
a
trace
or
a
span
here,
that's
automatically
generated
from
your
observability
instrumentation,
and
you
can
attach
these
identifiers
to
this
contextual
information
to
this
trace
so
that
we
can
identify,
maybe
the
front-end
version
or
the
page
route
that
that's
that
this
user
took
even
the
the
user
metadata
like
their
id
or
their
the
product
plan
that
they're
on
which
device
they're
using
the
location.
Are
they
in
chicago?
Are
they
in
boston?
Are
they
in
dc?
A
Where,
where
are
they
located
and
that
frontline
call
them
makes
the
back-end
call
on
your
servers,
hosted
on
your
your
infrastructure
and
you
can
attach
back-end
metadata
to
that
so
which
endpoint
it
was
hit,
which
post
it
was
which
container
id,
which
kubernetes
cluster
things
like
that
and
that
back
end?
Api
call
makes
a
database
call
right
and
then
we
can
create
a
metrics
off
of
that
we
can
maybe
say:
okay,
we
want
to
count
how
many
times
this
database
call
was.
A
Actually
made
and
service
that
as
a
summary
statistic
later
on
and
then
that
database
query
is
eventually
executed
on
on
the
the
database
over
the
database
connection,
and
we
can
tell
when
the
connection
was
actually
established
and
make
that
a
point
in
time.
Events
if
that
database
query
returns.
We
can
then
log
that,
as
with
specific
database
call
information,
we
could
log
different
different
information
about
that
database
call
depending
on
the
time
it
took,
and
things
like
this.
A
So
now,
we've
made
a
metric
counter
metric
an
event
in
the
log,
and
maybe
we
make
an
external
service
call.
This
could
be
a
api
call
between
your
microservices
within
your
individual
infrastructure
or
it
could
be.
You
know,
a
third
party
hosted
api
call
from
any
of
the
increasingly
sas
or
third
party
vendor
hosted
service
that
makes
the
api
endpoints
exposed
for
services
that
are
critical
for
your
application
to
to
execute
so
that
external
service
execution
returns.
A
So
we
can
log
that
as
well,
we've
made
the
response
and
we
send
that
back
to
the
back
end,
and
that
goes
back
to
the
front
end,
but
maybe
the
front
end.
Front-End
action
is
not
completely
done
yet,
and
it
needs
to
make
another
back-end
call
right,
so
we've
still
got
that
top-level
front-end
action
with
the
identifier,
the
action
identifier
that
is
actually
attached
to
all
of
these
other
calls.
The
first
back-end
api
call.
A
We
we
record
the
connections
established
there
and
that
returns
the
amount
of
items
and
we
make
a
count
metric
out
of
that
as
well,
and
then
maybe
it
loads
preloads,
maybe
the
second
page
of
paginated
results,
and
we
can
thread
all
of
this
through
and
connect
all
of
these
different
events
back
to
that
single
triggered
front-end
action,
so
very
highly
contextual
and
correlated
now
distributed
tracing
in
this.
In
this
instance,
and
then
we
can
log
the
action
outcome
metadata
on
that
as
well.
A
A
B
A
There's
two
key
trends:
changing
that
the
first
one
is
cost
effective
and
performing
data
storage
and
compute
resources
for
high
cardinality
big
data.
The
second
one
is
open
source,
observability,
apis
and
sdks
and
tooling
implemented
collectively,
collectively,
with
broad
support
from
the
community
and
vendors.
A
So
we'll
talk
about
the
second
one.
First
open
telemetry
is
a
fairly
new
project.
It's
been
getting
a
ton
of
vendor
support
and
community
support
and
is
emerging
as
a
new
lingua
franca
of
of
observability,
open
telemetry
defines
a
cross-language
specification
for
how
apis
and
the
sdks
responsible
for
collecting
and
configuring,
the
telemetry
and
instrumentation
of
languages
and
frameworks
and
libraries
should
be
done.
It
allows
the
standards
to
be
applied
in
a
standard
fashion
across
all
the
major
languages
that
then
have
their
own
libraries
written
to
adhere
to
these
specs.
A
So
scout
application
performance
observability
as
we're
evolving
into,
is
built
on
open,
telemetry
and
some
facts
about
open,
telemetry,
the
top
active
cloud.
It's
the
now,
the
top
active
cloud
native
computing
federation
project
behind
only
kubernetes,
it's
backed
by
over
130
companies,
including
the
big
ones
like
aws,
google,
microsoft,
facebook,
splunk
and
scout.
A
So
now
that
there's
this
vendor
agnostic
and
kind
of
standard
way
to
apply
this
telemetry
and
he's
using
these
apis
that
are
that
are
defined
through
the
open
file
machine
specification
and
available
for
open
source
libraries
and
packages
and
framework
maintainers
there
used
to
be
this
wall
in
between
observability
instrumentation,
like
scout,
would
would
write
itself
and
apply
as
an
outside-in
patch
to
these
libraries
and
frameworks
in
order
to
gather
telemetry
data,
we're
kind
of
breaking
down
that
wall
and
the
the
package
maintainers
they
would
have.
Never.
A
We
could
have
never
approached
a
package
maintainer
like
rails
and
say,
hey
rails.
We
want
to
put
scout
apms
observability
instrumentation
into
the
rails
framework
and
committed
to
upstream
to
the
rails
project,
there's
no
way
that
they
would
have
applied
that
vendor-specific
telemetry
into
the
rails
project,
but
now
bringing
down
this
kind
of
wall
in
between
those
with
the
vendor,
agnostic,
apis
and
specifications.
A
A
A
So
the
specification,
the
specification
actually
defines
how
the
apis
should
behave.
It
defines
the
standard
naming
of
the
stability
guarantees,
the
separations
of
concern,
the
communication
protocols
and
the
data
formats
and
the
compatibility
the
backwards
compatibility
guarantees
that
that
it
makes
for
the
api
in
the
sdk,
etc.
A
Semantic
conventions
are
just
the
way
that
we
name
things.
This
could
be
things
like
container
id
or
a
cloud
region
like
what
do
we
call
it?
The
key
value
pieces
of
these,
where
we
can
find
that
contextual
information
in
a
standard
way
that
we
can
connect
all
the
logs
metrics
traces
and
our
logs
metrics
spans
and
events
together
to
kind
of
weave
them
into
an
observability
picture,
sliced
and
diced
through
any
possible
combination
that
we
want
to
investigate
and
then
otlp
is
a
transport.
It's
called
the
open
telemetry
line
protocol.
A
The
library.
Authors
won't
care.
If
any
users
are
opening
open,
using
open,
telemetry
or
not,
they
can
implement
the
api
and
collect
or
put
the
hooks
in
to
collect
the
telemetry
information
using
the
api,
and
if
the
end
user
is
not
actually
collecting
the
open,
telemetry
data
from
this
library
or
framework,
it
will
not
have
any
overhead
and
they
won't
need
to
distribute
a
instrumented
version
of
their
library
or
framework
in
a
non-instrumented
version
of
the
library
framework.
A
This
is
completely
transparent,
whether
you're,
using
or
not
using
or
not
collecting
the
open,
telemetry
data
from
this
library
or
framework,
and
it's
zero
overhead.
If
the
user
does
not
email
open
telemetry
in
their
application
and
it
provides
very
strict
stability
guarantees,
so
the
library,
authors
and
framework
authors
they
won't
need
to
be
concerned
about
well,
is
this
api
going
to
be
changing?
Is
it
going
to
break
things?
It
provides
a
very,
very
stable
and
strict
guarantee
to
these
library
and
framework
authors
to
kind
of
ease
their
concerns
about
affecting
their
library
or
framework.
A
The
sda,
the
sdk
piece,
was
intentionally
decoupled
from
the
api
piece,
so
they're
separate
packages
on
every
single
language
and
the
purpose
is
to
make
sure
that
the
api
is
super
stable
and
the
sdk
can
evolve
and
change
in
a
quicker
fashion
as
needed
where
it's
user
facing
interfaces.
So
every
major
language.
A
You
use
the
sdk
to
set
configuration
options
for
what
gets
collected.
What
processing
is
applied
after
the
collection
and
where
the
metrics
are
sent,
and
I
just
just
discussed
that
it
was
intentionally
decoupled
from
the
api
for
stability,
guarantees
and
dependency
flexibility
and
all
languages
with
an
open,
telemetry
sdk
can
send
data
via
otlp
natively.
So
that's
an
important
part
if
you're
using
open
telemetry
within
your
application-
and
you
set
the
sdk
up
to
gather
this
open
telemetry
data,
you
don't
need
the
collector
piece.
A
The
separate
collector
binary
piece
of
open
telemetry
in
order
to
send
this
data
somewhere.
So
that
makes
this
collector
portion
of
open
telemetry
optional.
But
the
open,
telemetry
collector
is
an
application
written
in
go
that
receives
open
file,
magic
data
from
end
user
applications,
and
it
can
use
plugable
modules
to
further
process.
A
A
So
the
scout
product
roadmap
for
2022
is
transforming
from
application
performance,
monitoring
to
application
performance,
observability
and
eventually
into
full
stack
observability
in
q4
of
2021.
We
released
the
external
services
feature
of
scout
that
allows
you
to
understand
and
monitor
requests
to
external
services
through
http
api
calls
to
third
parties,
or
your
other
microservices.
A
A
By
the
end
of
this
year
we
have
a
very
aggressive
timeline
of
becoming
out
of
beta
by
the
end
of
this
year,
so
open
telemetry,
how
it's
changing
data
collection
and
scout.
So
right
now
the
open,
telemetry
or
the
scout
agent
sits
in
your
application
and
it's
an
in-process
thread
that
collects
telemetry
data
from
the
instrumentation
that
we've
written
ourselves.
A
It
collects
metrics
for
every
single
transaction
and
sends
that
to
scout,
and
then,
in
addition
to
those
aggregated
metrics,
it
picks
out
interesting
traces,
detailed
traces
that
are
selected
from
an
algorithm
that
give
you
some
insight.
The
starting's,
the
the
beginning
of
some
observability
within
your
application
to
what
may
be
slow
or
where
the
pain
points
of
your
users
may
be.
But
the
the
difference
between
the
way
the
skeletal
agent
works
now
and
that
they
shift
to
open
telemetry
is
now
with
open.
Telemetry.
A
The
open,
telemetry
instrumentation
will
sit
within
your
application,
and
traces
of
every
single
transaction
will
be
sent
to
step
up
and
scouts
value
add
and
what
we
need
to
surface
for
for
application.
Performance
observability
lies
in
what
what
insights
and
what
we
can
automatically
provide
to
your
developers
or
your
performance
engineers
about
your
applications
without
overloading
you
or
requiring
you
to
build
any
dashboards
to
get
those
insights
right.
So
that's
gonna
be
the
challenge
of
observability
in
the
face
of
just
enormous
amounts
of
data
collection.
A
So,
just
like
the
hubble
telescope
changed
the
observability
of
our
universe.
Open
telemetry
is
a
very
large
piece
of
how
we
can
enable
observability
within
our
applications
and
infrastructure
over
the
next
few
years.
What
may
be
a
dark
spot?
A
blind
spot
in
your
application
performance
now
will
change
with
the
addition
of
open
telemetry.
A
So
just
like
the
hubble
telescope
zooming
into
a
the
darkest
spot
that
we
could
find
from
our
observable
galaxy,
we
can
now
see
that
it's
not
dark.
It's
not
empty.
It's
actually
full
of
these
whole
galaxies
that
are
now
observable,
invisible
that
we
thought
and
never
knew
that
were
there
before,
and
we
can
observe
these
with
the
modern
instrumentation.
A
So
open
telemetry
is
a
somewhat
new
project
over
the
last
two
years,
and
the
tracing
portion
of
open
telemetry
is
actually
stable
and
being
released
as
stable
within
the
major
languages.
Now
javascript
ruby
java
go
those
languages
have
have
or
are
approaching
stable
releases
for
the
api
sdk
and
the
protocol
open
telemetry
is
the
timeline
for
metrics
and
logging
follow
within
this.
A
These
three
traditional
pillars
of
observability
and
our
development
follows
the
open,
telemetry
timeline
very
closely:
we're
not
trying
to
build
a
vendor
implementation
on
top
of
the
open
telemetry
project,
we're
not
trying
to
put
any
shims
in
between
us
and
the
open
telemetry
we
don't
want
to.
We
want
to
be
part
of
the
open,
telemetry
ecosystem
and
the
contributors
to
open
telemetry.
A
So
that's
available
for
everybody
and
it's
not
again
going
from
the
walled
garden
of
traditional
atm
vendors
or
logging
vendors
into
an
open
standard,
and
then
eventually,
you
know
five
or
so
years
from
now
migrates
its
way
back
to
being
walled,
walled,
garden,
type
thing
we
wanna
this
is
this
open.
Telemetry
project
is
super
super
important
and
is
changing
the
game
of
monitoring
and
observability
logging.
All
these
larger
vendors.