►
Description
No description was provided for this meeting.
If this is YOUR meeting, an easy way to fix this is to add a description to your video, wherever mtngs.io found it (probably YouTube).
A
A
This
is
an
official
live
stream
of
the
cncf
and,
as
such
is
subject
to
the
cncf
code
of
conduct,
which
simplifies
down
to
please
be
excellent
to
one
another.
Please
do
not
add
anything
to
the
chat
or
questions
that
would
be
in
violation
of
that
code
of
conduct.
Basically,
please
be
respectful
of
all
your
fellow
participants
and
presenters
and
with
that
howdy
michael
I'd,
love
to
hand
it
over
to
you
to
kick
off
today's
presentation.
B
B
You
do
that
to
collect
traces
and
metrics
and
logs,
and
you
use
it
basically,
when
you
have
a
production
issue
when
you're
trying
to
debug
to
understand
to
troubleshoot,
what's
happening
with
your
system,
and
that
is
super
important
and
super
great
and
we
do
it
ourselves,
but
this
kind
of
raised
the
question
for
me:
we
are
paying
a
lot
of
money
to
have
this
data
to
collect
it,
to
store
it
to
analyze
it
it's
really
expensive
and
we're
doing
it
only
we're
using
it.
Only
we
when
we
have
issues
when
something
broke.
B
So
then
I
asked
myself:
okay,
I'm
paying
a
lot
for
that.
What
else
can
I
do
with
it?
Maybe
I
can
use
it
in
other
places
during
the
development
life
cycle
and
one
of
those
things
you
know
looking
at
open
telemetry,
we
are
collecting
data
at
runtime.
So
when
do
we
have
more
runtime
scenarios?
We
have
more
runtime
scenarios
when
we
are
working
in
our
local
and
we
are
running
tests.
B
B
Basically,
when
I'm
running
tests,
I'm
trying
to
use
runtime
to
validate
is
my
application
doing
what
it's
supposed
to
do
and
then
I
thought,
okay,
how
can
I
integrate
this
open
telemetry
data
into
my
test
and
with
that
not
only
to
use
it
when
something
doesn't
work,
but
also
to
use
it
in
order
to
validate
is
something.
Is
it
working
the
way
it
it
should
do?
B
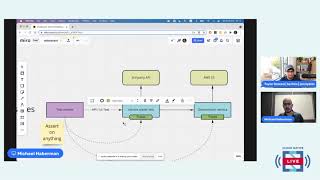
What
are
the
benefits
and
what
are
the
things
that
you
should
look
out
for,
so
I
have
here
some
imaginary
architecture,
but
quite
common
one
for
distributed
application.
So
you
have
a
test
that
you're
about
to
deploy
in
your
ci
and
you
want
to
run
some
tests.
Therefore,
it's
this
service
under
test
and
it's
a
process
that
you
spin
up.
It's
communicating
with
some
third
of
about
the
api
to
do
something.
B
B
B
So
I'm
basically
referring
to
any
type
of
network
testing
at
the
end
of
the
day.
So,
let's,
let's
review,
what
are
my
options
when
I'm
going
to
test
this
service?
The
first
and
probably
the
most
common
one
would
be
to
use
mocks
either
to
do
mocks
only
on
things
that
I
don't
control,
you
know
the
the
external
stuff
or
I
can
even
do
it
that
way
and
completely
isolate
my
service,
and
then
I
have
process
number
one.
That's
would
be
the
test
runner
sending
api
code
to
process
number
two.
B
That
would
be
the
service
standard
test,
and
this
thing
is
completely
isolated
from
the
word.
So
this
thing
is
super
useful.
It's
so
easy
to
spin
up.
You
just
run
the
service
mock,
whatever
you
whatever
depends.
It
has
and
you're
good
to
go.
You
can
test
it
from
operation
point
of
view.
That
is
the
simplest
as
it
can
be
from
application
perspective.
B
B
I'm
testing
how
the
service
of
service
perform
in
a
specific
scenario
of
how
to
thought
about
the
api,
with
response,
the
same
data
structure,
the
same
most
likely
the
same
values
and
also
the
amount
of
time
that
is
going
to
get
response
from
the
third-party
api.
The
same
goes
for
the
downstream
service
and
the
aws
sdk.
B
So
that's
like,
what's
good
and
bad
about
it
and
from
a
certain
perspective,
what
test
can
I
run?
So
the
test
runner
is
going
to,
let's
say,
send
an
api
call
and
then
get
a
response.
I
can
only
validate
the
response
and
I'm
not
trying
to
say
there
is
anything
wrong
with
this
approach,
but
it
has
its
benefits
and
it
has
its
drawback.
B
I
would
say
if
you
would
open
my
ci
in
different
services,
you
will
find
tests
like
that.
Those
are
great,
but
we
can
have
another
approach,
and
this
approach
is
saying
I
want
to
test
the
whole
thing.
I
want
my
test
running
to
send
an
api
call
to
the
service
under
test
and
then
real
http
calls
are
going
to
run
between
all
of
those
components
for
operation.
Point
of
view.
That's
a
nightmare.
You
need
to
spin
up
so
many
things.
B
You
need
to
make
sure
all
the
configuration
works
when
it
doesn't
work.
There
is
always
the
argument.
Is
it
application?
Is
it
the
devops?
So
you
have
a
lot
of
things
to
do.
However,
when
the
test
run
and
when
the
test
is
stable,
you
get
a
real
use
case
that
you
can
see
the
whole
view
of
your
application,
how
it's
performing
and
hopefully
how
it's
going
to
perform
in
production,
environment,
and
so
then,
because
what
I
did
here
is
not
mocked.
It's
you
know
it's,
it's
really
real.
B
So
if
the
downstream
service
is
going
to
upload
a
file
to
f3
or
object
to
f3,
then
I
can
test
not
only
the
response
from
the
service
under
test.
I
can
also
route
dedicated
code
in
my
test
runner
and
to
test
the
side
effect.
I
can
go
to
awf
3
and
ask
hey:
does
the
file
is
it
there?
Is
it
in
the
right
format
it
does?
B
It
has
the
right
permission
or
whatever
I
want
to
test,
and
basically
that's
super
important,
because
it
gives
me
a
whole
view
so
just
to
give
you
you
know
an
example.
If
somebody
is
purchasing
something
in
my
system
and
I
want
to
send
an
email
with
an
invoice
and
you
want
the
invoice
to
be
stored
in
f3,
you
want
to
validate
that.
It
was
used
there
right.
So
now
you
can
really
make
sure
it's
really
really
there.
The
drawback
in
this
scenario
would
be
two
things.
B
B
B
B
B
So
this
is
the
theory
behind
it
and
I
think
we
talked
enough,
and
now
we
can
jump
to
see
some
code,
so
the
code
that
I'm
going
to
show.
You
would
be
the
example
that
you
see
here,
so
we
would
see
two
services
communicating
with
one
another.
You
would
also
see
the
test,
the
test
runner
and
if
time
permits,
we
will
take
a
look
at
how
the
open
source,
by
the
way,
I
never
said
the
name
of
the
open
source
which
is
malabi.
B
B
B
B
B
So
let's
take
a
test,
for
example,
so
here
you
can
see
the
test
to
slash
to
do,
and
it's
less
to
do
is
sending
an
api
call
to
some
endpoint.
So
I
started
by
calling
slash
to
do
and
I'm
validating
the
response
so
far.
This
is
a
typical
api
integration
test.
You
will
probably
go
right
here
and
start
to
validate.
B
B
B
So
the
first
thing
that
we
are
doing
is
we
are
getting
the
telemetry
repository.
This
is
where
the
magic
happens.
This
is
where
the
test
process
is
going
to
communicate
with
the
service
under
test,
collect
the
telemetry
data
and
serve
it
in
your
test.
So
this
is
the
test.
We
have
access
to
our
telemetry
data,
and
here
we
are
running
our
first
assertion.
B
Go
to
the
telemetry
repository.
Take
the
spans
please
take
the
outgoing
http
calls.
Please
take
the
first
one,
and
we
assume
that
it's
going
to
send
an
api
call
to
this
specific
route
and
the
status
code
to
be
200
again.
This
is
the
internal
code,
so
we
have
like
two
api
calls:
the
service
under
tests
and
it
send
the
api
call
to
the
service
and
the
service
sent
an
outgoing.
So
we
are
testing
right
now.
B
The
internals
off
of
that
service-
and
this
is
like
trying
to
be
as
convenient
as
possible,
so
you
have
access
to
spends
and
spam
is
basically
the
event
that
every
interaction
between
services
or
between
dependencies
is
an
event.
And
here
you
can
see
a
whole
very
long
list
of
whatever
things
that
you
can
get,
whether
it's
aws
database
operations
messaging
systems
like
craft
cars,
qs
rabbit
mqs.
B
B
So
first
thing:
first,
we
assume
that
there
is
open
telemetry
installed
in
the
service
under
test
or
any
other
service
that
is
running.
To
make
your
life
easier.
We
chose
to
do
to
wrap
open
telemetry
with
using
motherb,
but
this
is
purely
open
telemetry.
If
you
already
have
open
telemetry,
you
don't
need
to
run
malabar
instrument.
You
can
tweak
a
bit
the
open
climate
you
already
have
and
then
it
it
would
work.
B
So
the
way
that
it
works
is
that
malabi
is
collecting
the
traces
collecting
the
spans
and
allow
them
to
be
collected
via
http
code.
So,
if
we'll
go
to
the
test
that
we
just
looked
so
we
have
here
the
get
telemetry
repository,
the
get
telemetry
repository
is
basically
a
function
that
is
fetching
the
remote
telemetry.
B
B
We
called
it
telemetry
not
spans,
because
open
telemetry
is
not
only
about
tracing
expenses,
also
about
logging
and
metrics
so
someday.
We
may
extend
it
to
collect
not
only
traces
but
also
you
know,
metrics
and
and
logs
and
stuff,
like
that,
okay,
so
just
to
to
go
through
the
process,
we
sent
an
api
call
that
calls
the
service
under
test
to
collect
the
traces,
keep
them
in
memory.
B
B
Okay,
so
let's
go
through
more
types
of
tests
that
we
may
do.
You
would
see
that
the
pattern
is
almost
similar.
So
if
we
are
looking
at
again
at
slash
users,
we're
sending
an
api
call
to
this
user
fetching
the
telemetry-
and
this
is
where
we
are
starting
to
have
stuff
that
are
not
http
based
so
sqlize,
if
you're
not
familiar
with
that,
that's
an
orm,
a
javascript
typescript
orm
to
communicate
with
your
database.
B
So
basically
we
are
validating
that
we
are
grabbing
a
sequel
activity.
We
assert
that
there
must
be
only
one,
so
if
you
have
a
bag
and
it's
going
to
be
suddenly
instead
of
one
query,
it's
going
to
be
10
queries.
Your
test
is
going
to
fail
and
then
you're
asserting
that
it's
a
select
and
you're
asserting
that
the
response
is
an
array.
B
Imagine
what
you
need
to
go
through
without
having
the
ability
to
look
at
your
picture
traces,
and
here
we
are
going
to
even
a
more
complex
scenario,
a
scenario
where
we're
calling
slash
invoice
and
when
you're
calling
slash
invoice.
You
have
two
hops,
so
the
service
under
test
is
the
test
framework
is
calling
service
on
their
test
and
service
under
test
is
calling
our
downstream
service
and
downstream
service
is
going
to
call
the
the
aws
sdk.
B
B
We
can
take
the
payload
that
we
sent
to
f3
and
validate
that
the
key
is
the
right
one,
so
that
is
like
being
able
to
go
all
the
way
through
and
one
of
the
use
cases
that
you
know
I'm
showing
right
now,
specifically
api
calls-
and
it
may
be
very
interesting
to
to
to
to
remind
that.
This
could
also
work
with
end-to-end
tests.
B
B
Nobody
guarantees
you
till
this
in
in
this
portion
of
the
code
that
the
data
is
going
to
be
found
in
your
in
your
cash
and
if
we
I
saw
companies
having
downtime,
because
this
thing
that
was
supposed
to
be
in
the
cash
wasn't
present
in
the
cash
and
it's
hard
to
test
it.
It
really
is
so,
let's
see
how
how
we
can
do
that.
B
So
again,
we
are
calling
get
telemetry
repository.
We
now
have
all
all
the
activities
available.
We
are
fetching
both
the
sqlize,
the
database,
one
and
the
radius
ones
and
first
thing.
First,
I
want
to
make
sure
that
the
first
interaction
so
sqlize,
the
first
interaction
the
dp
operation
was
insert,
and
that
is
because
our
first
api
was
inserting
to
my
to
to
the
database.
B
Then
what
we
are
doing
is
we
are
again
querying
a
database
and
running
a
select
statement,
because
we
want
to
fetch
the
the
user
from
the
database
and
then
we
expect
to
push
it
to
the
radius.
Let
me
go
and
show
you
like.
For
me,
this
is
a
very
good
use
case
of
of
malabar,
because
it
really
shows
the
power
of
of
what
you
can
do
with
it,
and
maybe
just
to
show
you
again
how
the
code
looks.
So
this
is
how
the
code
looks
like,
so
we
called
slash
user
with
jerry.
B
It
was
present,
so
not
that
so
we
are
proceeding
to
this
portion
of
the
code.
We
first
checked
if
it
was
present
in
our
cache.
If
it
was,
we
were
just
respond
with
it.
It's
not
present,
so
we
need
to
fetch
it
in
our
database
and
once
we
fetch
it
from
a
database,
we
can
push
it
back
to
our
to
our
radius.
B
B
B
So
the
instrument
function
is
basically
spinning
up
open
telemetry
with
a
very
few
changes,
so
change
number
one
that
we
are
doing
is
actually
set
up
a
sampler,
because
because
malabi
is
communicating
using
http,
it's
going
to
generate
spend
by
itself
and
you
don't
want
to
see
malabi's
pens
in
your
testing.
So,
basically,
what
we
are
doing
if
the
trace
the
http
target
starts
with
malabi,
we
are
not
recording
it,
so
we
won't
put
stuff
that
you
are
not
interested
in
in
your
test.
B
The
second
thing
is,
we
are
using
an
in-memory
exporter,
our
in
memory
exporter
collects
the
spend,
stored
them
and
waiting
for
them
to
be
fetched
and
I'll.
Show
you
how
it
looks
like
so.
Our
memory
exporter
is
a
very
simple
open.
Telemetry
exporter,
plain
pure,
open,
empty
exporter
with
two
functions,
get
spends
and
reset
spans,
which
are
calling
the
the
in-memory
exporter
functions
and
then
we're
doing
getting
all
the
auto
instrumentation
available.
For
that.
So
we
would
get
anything
possible
and
we
do
using
two
important
things.
B
The
first
one
is
to
collect
all
payloads,
so
that
is
giving
you
the
ability,
when
you're
sending
an
api,
call
writing
to
a
database
uploading
a
file
to
f3
that
gives
you
the
ability
to
look
at
the
payload
itself
and
assert
them.
So
it's
not
only
giving
you
the
ability
to
have
to
validate
the
interaction,
but
the
actual
data
that
is
being
transferred,
so
so.
This
is
why
we
use
to
collect
pale.
B
True,
and
the
second
thing
that
we're
doing
is
we
are
suppressing
the
internal
instrumentation,
and
this
is
kind
of
a
funny
thing
that
maybe
maybe
some
of
you
won't
be
aware,
but
when
you're
doing
like
a
aws
dot
put
to
object,
that
is
going
to
create
an
http
call
and
that
is
going
to
be
caught
in
your
instrumentation
by
default
and
again
you
don't
want
that.
You
don't
want
it,
you
don't
you're
not
going
to
try
and
make
sure
that
the
aws
sdk
the
structure
of
the
api
call
is
correct.
B
B
Slash
bands
would,
of
course,
delete
them
from
the
memory
exporter,
and
you
can
see
here
that
we
are
using
protobuf
the
reason
that
we're
using
protobuf
to
transfer
the
results.
The
traces
from
the
formality
from
service
to
malabi
is
because
we
do
want
to
support
different
programming
languages.
So
we
don't
want
it
to
be.
It
has
to
be
node.js
all
the
way.
B
B
B
So,
basically,
that's
how
malabi
is
collecting
the
data
and
transferring
it
from
place
to
place
the
other
thing
that
we
did
is
kind
of
making
your
life
easier
when
it
comes
to
finding
what
you're
looking
for
so
to
filter
all
the
spans
only
for
http,
for
instance.
This
is
something
that
you
need
to
know
how
to
do.
You
need
to
know
open,
telemetry
and
sometimes
to
know
quite
well
how
to
find
the
right
spin.
B
So
we
wanted
to
make
your
life
a
bit
easier,
so
those
would
be
the
functions
that
we
use
in
order
to
find
the
right
thing
that
you're
looking
for.
So,
if
you're
looking
for
a
message
received,
so
your
service
is
receiving
messages
from
through
kafka.
So
what
you
would
do
you
would
do,
spends
dot
messaging
receive
and
then
we
would
filter
only
for
the
right
the
right
spends
and
we
also
wrap
the
spans
themselves
in
order
to
make
sure
that
it's
also
easier
right
here.
B
B
So
that's
the
open
source
just
like
to
give
you
a
bit
of
a
roadmap
thing
that
what
are
the
main
thing
that
that
we
are
going
to
work
on
so
currently
the
test
runner
is
going.
Is
communicate
directly
with
every
service
which
could
be
rather
annoying,
so
we
want
to
have
a
kind
of
a
back
end.
So
all
the
traces
probably
today
are
shipping
the
traces
somewhere.
So
we
want
to
spin
up
some
traces
backhand
such
as
jager
zipkin
and
then
malabi
will
communicate
with
jaeger.
B
So
the
setup
would
be
even
easier.
You
just
point
the
test
run
it
together.
You
point
your
services
to
jager
and
everybody
is
happy.
So
that's
one
thing
that
we
are
going
to
add
also
support
for
metrics
and
logs
and
supporting
more
languages
right.
Then
we
support
only
javascript,
as
you
saw,
and
lastly,
we
very
much
want
to
add
instrumentation
to
the
text
framework
themselves.
B
B
A
Thank
you
so
much
michael
with
that.
I
I
do
have
a
few
questions,
but
just
as
a
if
you're
just
tuning
in
or
if
you've
been
with
us.
Thank
you
for
viewing.
If
you
have
any
questions
for
michael,
if
you
want
to
talk
about
traces
or
anything
like
that,
please
feel
free
to
throw
that
into
the
chat
and
we'll
get
those
questions
asked.
I
think
thank
you
for
sharing
that
repository
as
well.
Michael.
A
B
Yeah,
I
think
you
know
when
you
when
we're
looking
at
specifically
things
like
open
telemetry,
you
mostly
would
use
it,
for
you
have
a
production
issue
and
you
need
to
fix
it
and
you
need
to
fix
it
fast.
So,
if
you
would
ask
you
know
a
manager
in
an
rd
organization,
how
do
you
measure
how
open
telemetry
works?
You
will
probably
say
something
like
mttr
mean
time
to
resolve
recovery.
B
So
that's
how
you're
using
it
today
and
I
think,
every
time
that
you're
putting
this
investment
to
collect
data
about
your
application.
You
should
always
look
for
more
ways,
and
I
think
the
main
thing
that
interests
me
is
what
we
can
do
in
in
pre-production.
What
we
can
do
it
in
in
test.
We
can
do
it.
What
we
can
do
with
it
in
in
our
ci,
in
a
local
environment.
A
I
really
like
that
focus
that
you
had
too
on
testing
and
really
showing
examples
of
how
you
could
get
that
implemented.
I
I
did,
I
do
recall,
seeing
one
tweet
if,
if
I
can
find
it
I'll
share
it
a
little
bit
later
on
on
my
on
my
handle,
but
it
kind
of
goes
into
that
one
library
that
was
released
for
go-
and
in
this
case
and
talked
about
how
now
you
can
include
this-
for
you
know
your
testing
use
cases,
and
things
like
that.
I
really
like
that.
A
You
pointed
out
that
this
is
something
that
you
can
really
factor
in
or
refactor
in
and
get
a
sense
of.
What's
going
on
with
your
code
and
with
your
overall
stack
and
you
don't
have
to
necessarily
push
to
production,
to
get
some
of
those
insights
now
granted
it's
nice
to
have
that
instrumented
in
production.
B
Well,
with
open
telemetry
yeah
a
lot
and
and
specifically
with
with
testing,
I
think
the
people
who
use
it
are
mostly
using
it
in
a
ui
testing,
because
when
you're
doing
ui
testing
being
able
to
understand
what
happened
in
the
end
of
your
system,
the
other
end
of
the
ui
system
so
use
case
that
that
I
know
somebody
filled
the
form
using
some
ui
testing
tool
and
then
do
you.
The
form,
send
an
api
call
to
service.
B
Then
the
service
sent
in
kafka
message
and
other
service
would
consume
that
message
and
send
an
email
to
the
customer.
They
wanted
to
make
sure
that
the
email
really
gets
there,
so
they
did
all
kind
of
thing.
They
they
had
those
flaky
solutions
and
then
they
just
use
tracing
which
they
already
had.
It
was
really
simple
and
straightforward.
A
Interesting
interesting,
I
think
when
it
comes
to
have
you
also
seen
some
like,
I
know
when
it
comes
to
kubernetes
and
some
other
things
you're
able
to
take
those
metrics
that
data,
those
traces
and
use
that,
to
you
know,
say
scale
your
workload
horizontally
or
vertically
or
or
in
some
fashion.
Are
there?
Are
there
any?
Are
there
any
use
cases
that
you've
seen
like
that
where
people
are
using
open
telemetry
to
then
do
modifications
either
to
their
infrastructure
or
maybe
run
their
code
a
little
bit
differently
too?
B
B
A
B
So
I
think
it's
the
amount
of
work
that
you
need
to
put
in
to
solve
those
things,
so
you
have
an
application.
This
application,
you
it's
already
telling
you
what
it's
doing
so
when
you
grab
this
story
of
what
it's
telling
you
story
using
traces,
the
ability
to
validate
it's
already
there.
It's
it's!
It's
simple!
B
If
you
start
if
you
need
to
start
developing
dedicated
code
to
to
validate
the
test,
so
the
example
that
I
gave
is
a
write,
dedicated
code
and
fetch
whatever
was
uploaded
to
f3,
so
you
need
to
fetch
it
and
then
validate
it.
So
you
now
have
more
code
to
maintain
you
have
more
the
next
developer.
We
need.
We
need
to
work
harder
to
understand
how
it
works
as
opposed
to
traces
where
it's
just
it's
already
outputted
by
the
application.
So
it's
just
making
your
life
easier.
B
B
A
B
A
B
A
B
I
know
most
people
would
use
either
most
people
will
use
elasticsearch
for
that,
which
is
super
inconvenient,
because
you
already
have
a
grafana
kibana
on
top
of
it
and
it
allows
you
to
do
dashboarding
alerts
whatever
you
want
to
do
with
it.
So
that's
a
great
approach,
that's
what
I
chose
to
use.
I
know
some
other
people
are
using
cassandra,
but
I
think
the
recommended
thing
is
is
elasticsearch.
A
Awesome,
I
do
have
a
few
more
questions
here,
but
definitely
would
like
to
encourage.
If
anyone
watching
has
some
questions,
please
feel
free
to
throw
those
into
chat
and
I'll
be
more
than
happy
to
ask
on
that
front
awesome.
My
next
question
was,
as
people
start,
to
get
working
with
open,
telemetry
and
with
tracing
what
are
some
common
pitfalls
that
you
you'll
see
or
some
just
you
know
either.
B
B
You
can
in
some
sense
get
almost
the
same
thing
done
using
using
logs,
but
so
that
that
would
be
number
one
number
two
would
be
how
it's
going
to
affect
my
performance
and
number
three
would
be.
I
implemented
open
telemetry,
but
I
don't
see
all
of
my
data
the
way
I
wanted
to
to
to
look
like
so
looking
at
logs
versus
graces.
B
There
is
a
lot
of
stuff
to
read
around
that,
but
I
would
say
that
logs
are
great
to
to
tell
you
what
the
process
is
doing.
What
is
the
story?
The
single
process
is
going
to
to
tell
you
about
open.
Telemetry
is
about
the
context
about
the
path
that
is
happening
between
services.
It's
going
to
tell
the
story
throughout
services,
not
within
the
service,
about
performance.
Yes,
it's
going
to
affect
your
performance
like
any
other
library
that
is
going
to
instrument
your
your
your
service.
B
So
if
you
put
some
apm,
it's
affecting
your
your
performance,
but
I
think
the
performance
impact
is
definitely
worth
it
and
you
can
control
it
by
controlling
the
sampling
rate.
So
you
don't
have
to
collect
100
of
what's
happening.
You
can
take
a
portion
out
of
it
and
how
the
data
looks
at
the
end
of
the
day.
So,
first
of
all,
open
telemetry
is
quite
a
new
project.
A
Awesome
awesome,
no
and
I'm
kind
of
excited
to
see
what
comes
out
of
that
too,
because
I
know
you
know
looking
at
open,
tracing
and
open
census
and
kind
of
like
how
all
I
was
really
excited
to
see
these
communities
come
together
and
kind
of
converge
on
what's
important,
what
are
things
we
can
measure
and
how
do
we?
You
know?
How
do
we
help
elevate
others
within
the
same
space,
so
yeah
kind
of
kind
of
in
that
vein
are
there?
A
Gotcha
gotcha,
that
that
makes
sense
to
me
and
then
it's
it's
in
it.
It
can
be
a
hard
space
to
solve
these
problems
in
as
well.
So
I
I
can
imagine
too,
because
again,
you
know
context
is
always
key
when
trying
to
troubleshoot
or
find
out
some
of
these
things
too.
So
it's
it's
it's
interesting
and
and
exciting
with
with
that,
what
are
what
are
some
good
ways
to
get
started?
B
So,
very
funnily,
my
next
session
in
10
minutes
or
so
is
about
getting
started
with
open
telemetry,
so
we're
doing
like
an
open,
telemetry
boot
camp.
I
think
that
if
you're
starting
start
by
reading
the
docs
and
just
get
yeah
get
get
get
familiar
with
the
dogs,
the
terms
follow
like
a
getting
started
thing
and
look
for
a
good
guide
in
youtube
on
getting
started.
I
think
that
would
give
you
everything
you
need.
A
Awesome
awesome.
Well,
thank
you.
So
much
michael
this
was
just
incredibly
fascinating.
It
was
great
to
see
you
walk
through
the
code.
Thank
you
for
taking
the
time
to
kind
of
show
all
of
us
and
talk
more
about
open,
telemetry
and
tracing
and
really
how
to
get
started.
When
it
comes
to
your,
your
stack
really
really
appreciate
it.
A
Awesome
well,
thank
you
so
much
everyone
for
joining
the
latest
episode
of
cloud
native
live.
It
was
great
to
hear
michael
about
from
michael
about
trace-based
testing
with
open
telemetry.
Thank
you
all
for
jumping
in
and
attending.
We
really
liked
the
interaction
and
questions
from
the
audience
and
again
we
will
bring.
We
bring
you
the
latest
cloud
native
code
and
presentations
every
wednesday
at
11
a.m.
Eastern
time
next
week
we
will
have
scott
fulton
presenting
next
generation
observability
with
open
source
monitoring.
Thank
you
so
much
for
joining
us
today.