►
From YouTube: Cilium 1.12: Features and updates
Description
No description was provided for this meeting.
If this is YOUR meeting, an easy way to fix this is to add a description to your video, wherever mtngs.io found it (probably YouTube).
A
With
that,
let's
get
going
and
let's
look
at
what's
new
in
psyllium
1.12,
first
of
all,
very
high
level
overview
of
what
is
psyllium
for
those,
maybe
completely
new
to
Celia,
so
psyllium
originally
created
by
I
surveillance.
It's
our
company
is
ebpf
based
networking
security,
observability
and
new
in
1.12
also
service
mesh
Ingress.
Obviously
we'll
talk
quite
a
bit
about
both
service
mesh
and
Ingress.
Sodium
is
a
cncf
project.
It
is
at
incubation
level
and
we're
currently
completing
all
the
requirements
to
graduate.
A
Hopefully
later
this
year
or
early
next
year,
underlying
or
underneath
of
psyllium
are
two
chord
layers
of
Technology
one's
ebpf
and
we'll
do
a
very
super
quick
Deep
dive
on
that,
as
well
as
Envoy
for
layer,
7
processing
is
used
across
the
world.
Lots
of
different
users,
many
of
them
cncfn
users,
but
obviously
aren't
also
many
Enterprises
on-prem
clouds.
Telcos
slim
is
very
very
Universal.
A
Solomon
is
also
used
heavily
across
managed
kubernetes
platforms
such
as
Google's
anthos
gke,
as
well
as
eks
a1ga,
a
little
bit
earlier,
as
well
as
for
maybe
slightly
smaller
Cloud
Waters
like
digital
ocean
and
so
on.
So
you
may
in
fact,
already
be
using
sillim
if
you
use
one
of
those
kubernetes
distributions,
so
let's
dive
in
ebpf
in
one
minute.
So
what
is
evpf?
It
is
what's
driving
slim
underneath
it's
this
powerful
technology.
A
You
don't
really
need
to
understand
it
to
use
sodium
at
all,
but
it
is
very
exciting
because
it's
kind
of
the
enabler
for
what
psyllium
doesn't.
What
so
makes
unique
evpf
is
essentially
a
programmable
engine.
At
the
operating
system
level,
it
was
originally
written
for
11
chronal,
since
Microsoft
has
also
ported
its
windows.
So
it's
now
also
available
on
Windows.
In
a
nutshell,
evpf
is
quite
similar
to
what
JavaScript
is
to
a
browser
so
similar
to
how
JavaScript
is
making
a
Linux
is
making
a
web
browser.
A
Programmable
evpf
is
making
the
Linux
kernel
or
the
operating
system
programmable,
so
we
can
run
programs
when
certain
events
happen,
such
as
when
we
process
Network
packets,
when
a
system
call
is
happening
or
being
done
when
Trace
points
are
invoked
or
even
when
applications
call
certain
functions.
This
is
how
solimus
implemented
this
is.
This
is
how
many
other
EDP
based
product
projects,
leverage
to
provide
infrastructure
or
solve
user
use
cases.
If
you
want
to
learn
more
about
evpf,
feel
free
to
go
to
evpf.io.
A
It's
a
website
where
we
host
Community
oriented
content
around
ebpf,
tutorials
documentation,
videos.
You
will
also
find
the
link
to
the
evpf
summit
with
lots
of
recordings
of
former
ebpf
Summits.
We
actually,
we
have
the
ebpf
summit
coming
up
in
just
a
couple
of
months,
so
if
you're
interested
to
dive
deeper
on
evpf
itself
feel
free
to
sign
up
to
the
evpf
Summits
completely
free,
and
if
you
are
a
real
entry
vpf
and
want
to
still
submit
a
talk,
feel
free
to
reach
out
to
Bill
or
less
rice
on
our
slack
I.
A
Think
it's
not
too
late.
Yet
to
just
to
still
put
a
talk
in.
Let's
start
diving
in
sodium
1.12.
What
is
new
one
of
the
most
exciting
features
is
that
psyllium
now
is
a
fully
capable
Ingress
controller
as
well.
So
as
you
install
selling
1.12,
you
are
gaining
the
ability
to
run
sodium
or
to
enable
the
Ingress
controller.
This
means,
if
you
define
kubernetes,
Ingress
resources,
layer,
7,
load,
balancing
you
can
now
Implement
them
directly
with
psyllium
and
don't
need
to
install
another
or
an
additional
Ingress
controller.
A
This
allows
you
to
do
candy
releases
or
Canary
rollouts
path
based
routing
TLS
termination
and
so
on.
Some
of
these
features
have
been
available
before
in
psyllium,
with
manual
configuration
or
with
network
policy
configuration.
We
now
all
have
a
fully
conformance,
so
we
pass
all
the
kubernetes
Ingress
conformance
tests
fully
conforming
Ingress
controller
for
your
for
your
kubernetes
cluster.
This
applies
to
traffic
into
your
cluster
within
the
cluster,
and
you
can
even
use
Ingress
Acro
Cross
or
in
the
multi-cluster
scenario
as
well.
A
This
is
an
example
on
how
it
looks
like
when
you
probably
many
of
you
have
been
using
Ingress
before
no
surprise.
Here,
you
can
Define,
in
this
case
an
English
service
and
do,
for
example,
differ
or
hit
different,
low,
balancing,
back-ends
based
on
the
URL
or
based
on
the
path.
In
this
case,
when
a
user
hits
slash
details,
it
would
hit
a
different
set
of
backends.
A
Then,
if
the
user
hits
slash
or
the
root
of
the
URL
Ingress
is
implemented
using
the
existing
Envoy
integration,
so
it
is
using
Envoy
the
envoy
proxy
underneath-
and
this
has
all
the
the
functionality
and
the
performance
metrics
of
Ingress
or
of
the
envoy
proxy
Switching
gears
and
talking
about
service
mesh.
So
1.12
is
the
first
release
where
we
have
a
new,
exciting,
sidecar
free
data
path.
So
so
far
we
have
been
offering
option
number
two
on
this
slide,
which
is
the
istio
integration.
A
Some
of
you
may
have
been
using
STL
so
far
and
have
been
combining
that
with
psyllium
and
in
this
integration
mode.
You
essentially
made
a
psyllium
aware
of
an
existing
independent
sgo
configuration
or
installation,
and
sulin
will
provide
a
couple
of
additional
functionality
to
functionality
to
istio
such
as
removing
the
unencrypted
traffic,
as
well
as
giving
psyllium
the
ability
to
enforce
its
own
layer,
7
policies
in
the
sidecar
of
sdl.
So
this
is
what
we
have
so
far,
and
you
can
of
course
continue
using
this.
It
continues
to
be
fully
supported
with
112.
A
A
So
what
we're
adding
is
essentially
a
sidecar
free
option.
What
is
this
sidecar
so
in
in
general,
service
measures
so
far
have
been
implementing
service
mesh
with
a
so-called
sidecar
proxy.
This
is
the
green
box
on
the
left
side
here.
So
it's
essentially
a
proxy
that
would
run
one
instance
for
every
part,
so
for
every
blue
part
that
you're
running
here
on
the
right
side,
you
need
a
sidecar
proxy.
What
it
is
it's
linked
or
Envoy
or
or
or
nginx
or
some
other
proxy.
You
need
another
green
box,
this
so-called
sidecar
proxy.
A
So
you
need
like
a
lot
of
different
sidecar
proxies.
These
sidecar
proxies
would
be
injected
through
the
through
through
a
Network
iptables
rule.
So
you
see
this
first
blue
arrow,
that's
essentially
across
the
network
stack
here
and
an
iptables
rules
with
natural
work
kind
of
transparently
redirect
all
the
traffic
into
a
sidecar
proxy.
This
is
the
so-called
side
color
model
there's
a
this
is
how
service
measures
have
been
operating
so
far.
This
is
how
link
D
operates.
This
is
how
St
operates
and
so
on.
A
When
we
now
talk
about
site
called
free,
we
now
have
an
option
where
you
don't
have
to
run
one
side
color
per
part,
but
you
can
actually
run
a
sidecar
free
data
path,
and
this
operates
in
two
modes.
It
will
use
evpf
so
no
proxy
at
all
whenever
possible
and
we'll
we'll
look
into
when
that
is
the
case,
and
then,
if
it,
for
some
reason,
is
not
possible
to
do
the
required
functionality
any
DPF
itself,
it
will
use
a
per
node
Envoy
right
now.
This
is
a
per
node
Envoy.
A
This
proxy
could
also
run
at
a
different
granularity,
for
example,
per
namespace
or
per
service
account,
or
even
you
could
then
go
back
and
actually
do
still
per
part.
If
you
really
wanted
that
so
far,
we
essentially
offer
you
to
run
it
at
the
granularity
of
one
per
node,
very
similar
to
how
the
Ingress
controller
does
this
as
well.
A
Discus
gives
essentially
native
Network
performance
for
a
lot
of
the
use
cases
and
we'll
look
at
those
use
cases
where
we
don't
need
a
proxy
at
all
and
it
even
improves
the
performance
when
a
proxy
is
needed.
We're
also
introducing
this,
unfortunately,
didn't
make
the
cop
for
1.12,
so
it
will
be
included
in
one
113.
A
This
is
a
new
crd
that
allows
you
to
use
raw
Envoy
configuration
for
your
service
mesh
needs
in
particular
for
advanced
use
cases
and
then
a
choice
of
additional
control
plans.
What
we
have
implemented
so
far
is
istio
in
the
sidecar
model
model
Ingress
and
services
in
the
per
node
model,
Envoy
cod
in
the
pro
model
and
we're
now
completing
Gateway
API,
so
that
will
be
coming
as
part
of
113
and
will
probably
actually
be
available
independently
before
we
even
release
full.
A
The
full
1.13
spiffy
is
also
underway,
unfortunately,
didn't
make
the
feature
freeze
for
112,
but
will
be
merged,
hopefully
in
the
next
couple
of
months
as
well,
allowing
to
essentially
use
spiffy
identities
as
well
as
spiffy,
spec
or
spiffy
service
ideas
in
our
policies
and
bring
the
specific
certificates
to
the
mtls
model
for
observability.
You
can
leverage
the
existing
Integrations
that
we
have
so
far.
A
What
you're
used
to
Prometheus,
fluency,
grafana,
elasticsearch,
open,
Telemetry
and
so
on
I
said
it
will
look
kind
of
a
bit
deeper
into
this
site
called
free
mode
and
what
that
what
that
brings?
Obviously
it
brings
a
reduced
footprint,
so
you
you
run
fewer
proxies.
So,
instead
of
having
one
per
pod,
you
will
run
one
per
note.
This
can
massively
reduce
the
both
the
memory
and
to
compute
resources
you
require
because
you
don't
need
to
bootstrap
a
new
proxy
every
time.
A
You
start
a
pod,
for
example,
and
you
don't
need
to
shut
down
the
proxy
when
the
part
terminates
as
well,
but
it
also
has
performance
benefits
and
we'll
get
to
that.
But
before
we
see
kind
of
the
performance
impact,
this
shows
what
can
be
done
completely
in
evpf.
So
no
proxy,
no
sidecar,
nothing
and
what
still
needs
a
proxy
and
when
it
needs
a
proxy,
it
could
be
the
per
no
proxy
or
it
could
be
the
sidecar
proxy,
so
things
that
we
can
do
entirely.
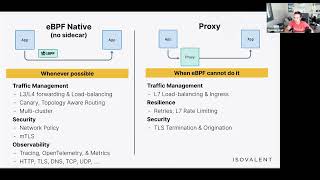
A
Bpf
traffic
management,
obviously
anything
at
layer,
3
layer,
four,
any
low,
highly
low,
any
load.
Balancing
at
layer,
C
layer,
4,
Canary,
rollouts
topology
without
routing
I
will
have
an
example
later
on
in
this,
as
well
as
all
of
the
multi-cluster
capabilities,
obviously
Network
policy
and
TLS,
and
then
very
interesting,
HTTP
or
layer,
7
observability
for
the
protocols,
HTTP
TLS,
DNS,
TCP
and
UTP.
This
data
can
be
exported
using
either
open
Telemetry,
traces
and
metrics
or
Prometheus
metrics
or
Json
tracing
data
as
well.
A
So
you
can
feed
this
into
existing
dashboards
or
assisting
existing
tracing
utilities
or
dashboards
that
you
have
when
you
configure
things
like
traffic
management,
this
means
layer,
7,
load,
balancing
so
path
based
routing
header
based
routing,
SNL,
Sni
or
hostname,
based
routing
as
well
as
Ingress.
This
is
when
we
still
use
a
proxy
and
it
will.
We
will
inject
Envoy.
A
Also
for
all
the
resilience
features,
retries
layer,
7
rate
limiting
you
can
you
can
limit
the
bandwidth
of
a
pod
without
a
proxy
using
network
bandwidth,
but
if
you
want
to
limit
number
of
HTTP
requests
per
second,
you
need
a
proxy
as
well
as
TLS
termination
and
origination
important
here.
This
is
not
mtls.
This
is
the
case
when
you
actually
want
to
terminate
TLS
on
behalf
of
the
app
or
you
want
to
originate
the
TLs
connection
on
the
app
of
the
app.
A
This
is
where
you
also
still
need
a
proxy
is
empty,
less
available
for
the
civilian
Community
Edition.
We
have
not
decided
this
yet
we'll
get
to
that.
As
we
as
we
release
it,
so
this
is
mtlers.
If
you
want
to
learn
more
about
this
new
mtls
model
that
essentially
decouples
the
the
payload
or
the
data
path
from
the
actual
authentication
piece,
there
is
a
detailed
block
that
you
can
find
linked
here.
So
as
we
share
the
slides,
you
can
click
on
this
link
and
get
the
details.
A
You
can
still
optionally,
secure
and
encrypt
them
with
ipsec
or
wireguard,
but
you
can
then
gain
or
add
the
authentication
piece
decoupled
from
this
for
more
details
refer
to
the
blog
and
reach
out
on
slack.
If
you
have
more
questions,
so
I
promised
a
couple
of
benchmarks
here
that
kind
of
show
the
impact.
The
left
side
is
one
case
where
we
can
do
something
in
child
and
ebpf.
In
this
case,
HTTP
visibility
or
tracing
so
parsing
HTTP
and
emitting
traces.
This
is
the
HTTP
request.
This
is
the
HTTP
response.
A
What
is
the
HTTP
return
code?
What
is
the
latency
between
request
response
and
so
on?
Blue
is
no
visibility,
enabled
so
no
parsing
red
is
the
latency,
so
just
a
tiny
little
overheads.
When
we
have
to
do
this
with
this
parsing
of
HTTP
in
edpf,
this
is
for
http1
and
HTTP.
2.
and
yellow
is
the
side
car.
This
latency
Edition
is
almost
the
same,
regardless
of
the
specific
sidecar.
Often
they
used
to
say
in
HTTP
processing
library
and
often
the
override
is
actually
injecting
the
proxy
and
not
the
proxy
itself.
A
A
Last
but
not
least,
the
psyllium
Envoy
config
or
Envoy
crd.
This
is
a
new
crd
that
allows
you
to
essentially
bring
Envoy
configuration
could
be
listener,
configuration
could
be,
retries
could
be
termination
could
even
be
tunneling
TCP
in
HTTP
or,
like
other,
very
complex
or
very
Advanced
Envoy
functionality
that
is
available,
and
you
can
configure
it
out
directly
in
the
crd
and
essentially
redirect
any
connection
you
want
into
that
Envoy
and
apply
that
configuration.
A
So
if
you,
for
example,
have
an
existing
Envoy
based
service
mesh-
and
maybe
you
have
written
your
own
control
plane,
you
can
actually
Port
that
over
and
potentially
use
our
data
path.
While
you
provide
the
envoy
configuration
or
you
have
been
using
Envoy
kind
of
with
manual
configuration,
and
you
can
now
automate
that
in
the
crd.
So
this
is
a
way
for
advanced
users
to
make
use
or
full
use
of
envoy's
capability
in
cilia,
some
of
the
higher
level
control
planes
and
Integrations
like
Ingress
and
Gateway
API,
actually
just
map
to
this
Envoy
crd.
A
Last
but
not
least,
here
on
the
service
mesh
sites,
Hubble
integration
with
open
Telemetry-
we
have
massively
extended
this
in
1.12,
so
you
can
use
both
the
network,
visibility
and
the
service
mesh
visibility
at
layer,
7
and
Export
metrics,
and
traces
in
open,
Telemetry
and
feedback,
for
example,
into
a
UI
or
a
dashboard
here
that
allows
you
to
show
spans
I
see
one
more
question
here:
can
you
explain
why
istio
needs
two
proxies
as
you
refer
in
your
performance?
Comparisons-
life?
A
Yes,
so
in
the
istio
case,
essentially,
what
istio
does
are
also
what
Linker
D
does
it?
It
starts
one
proxy
for
every
single
part
that
you
start
and
it
will
force
all
the
TCP
traffic
of
that
part
in
and
out
you
can
limit
that
to
certain
ports,
but
by
default
you
want
to
redirect
all
the
traffic
both
for
any
traffic,
that's
leaving
that
part
and
for
any
traffic.
That's
entering
this
part.
A
So
in
a
service
mesh,
you
essentially
go
through
two
proxies
unless
you
find
a
way
to
somehow
disable
that
one
of
those
two
sidecars
as
soon
as
you
start
running
mtls
in
the
sidecar
model,
you
need
to
proxies,
because
the
TLs
connection
will
be
between
the
two
sidecars.
The
apps
themselves
cannot
or
will
not
talk.
Tls.
You
will
need
the
origin
originating
sidecar
proxy
to
initiate
the
TLs
connection.
You
will
need
a
receiving
sidecar
proxy
to
terminate
TLS
perform
mtls
and
then
the
actual
app
that
receives
the
traffic.
A
There
is
a
psyllium
service
mesh
site
called
free
blog
post
on
I
surveillance.com.
I
will
also
list
that
in
the
chat,
I
think
Cornelia
can
take
care
of
that
and
list
that
that
goes
into
details
of
how
this
works
and
and
why,
how
a
sidecar
operates
and
how
we
can
remove
sidecars
in
certain
in
certain
situations.
A
Switching
gears
a
bit
and
talking
about
cluster
mesh
cluster
mesh
is
the
ability
of
psyllium.
So
it's
not
service
mesh.
It's
not
psycho
related.
This
actually
existed
for
several
years
now.
It's
the
ability
to
connect
multiple
clusters,
multiple
kubernetes
clusters
together
purely
on
the
network
level,
and
it
essentially
enables
you
to
connect
them.
Enforce
Network
policies
across
clusters,
gain
visibility
across
clusters
and
also
do
service,
Discovery
or
Global
low,
balancing
across
multiple
kubernetes
clusters
as
well,
exciting
new
feature
in
1.12.
A
A
So
this
is
The
annotation
that
marks
this
kubernetes
service
AS
Global,
which
means
it
should
be
low,
balancing
across
multiple
clusters,
and
you
can
now
add
a
service
affinity,
and
you
can
say
please
prefer
a
local
backend,
and
what
this
now
does
is
that
if
there
are
backends
available
both
in
the
local
or
in
the
remote
cluster,
it
will
always
prefer
the
local
backend
or
the
local
instance
until
no
local
instance
is
available,
and
then
it
will
go
to
the
remote
instance.
You
can
obviously
also
turn
this
round
and
say:
please
prefer
remote.
A
So
to
illustrate
this.
This
is
kind
of
how
it
looked
before
what
you
can
have
what
you
have
been
able
to
do
before,
so
you
can
Define,
let's
say
a
backend
service
which
is
backed
by
both
Parts
in
both
clusters
and
the
front
end
talking
to
this
backend
service.
It
would
balance
equally
here.
In
this
case
you
could
not
Define
a
particular
Affinity.
A
What
you
can
now
do
is,
you
can
say,
set
it
to
local
and
then
it
will
always
stay
local
to
that
cluster
whenever
possible,
but
as
soon
as
the
the
backends
in
that
local
cluster
die,
they
become
zombies.
So
for
some
reason,
then
it
would
fail
over
and
actually
go
into
to
backends
in
the
remote
cluster.
So
this
is
a
great
way
to
do
h,
a
or
to
make
Services
highly
available
with
a
backup
cluster,
which
means
you
can
stay
local.
You
can
benefit
from
the
local
latency.
A
You
can
avoid
cross
region
cross
across
AC
traffic,
which
is
expensive,
but
have
the
failover
opportunity
into
another
cluster
that
may
be
running
in
a
different
region
same
here.
If
we
set
it
to
remote,
it
would
go
always
prefer
remote
first
and
only
use
the
local
instance
when
required.
This
can
be
useful
if
you,
for
example,
want
to
do
if
you
want
to
log
to
a
centralized
logging
service,
but
you
have
a
backup
available
in
the
local
cluster.
So
for
some
reason
the
remote
cluster
is
not
available.
A
Then
you
want
to
fail
over
and
actually
log
to
a
local
logging
instance.
For
example,
another
exciting
feature
around
cluster
mesh
is
the
ability
of
running
essentially
minimalized
or
miniature
to
miniature
clusters
and
connect
them
together.
So
you
no
longer
need
to
bring
the
full
cluster
mesh
control
plane
in
every
cluster.
You
can
have
essentially
small
Edge
clusters.
This
is,
in
particular,
useful
for
external
workloads
or
Edge
use
cases,
or
you
maybe
only
want
to
run
a
couple
of
parts
and
these
Edge
clusters
or
remote
clusters.
A
They
can
leverage
the
control
plane
of
a
centralized
cluster
or
several
centralized
clusters,
so
this
allows
you
to
run
cluster
mesh,
in
particular
for
Edge,
use
cases
minimize
the
footprint
at
the
edge
or
for
the
remote
clusters
and
centralize.
If
you
want
more
of
the
control
plane
infrastructure
for
more
details
on
this,
the
the
release
Blog
has
plenty
of
details
on
this
external
workloads.
We
had
massive
improvements
around
the
integration
of
external
workloads,
external
workloads
or
non-cubernetes
workloads.
You
can
integrate
them
into
your
psyllium
cluster
or
psyllium
mesh.
A
So
you
don't
need
to
contain
rice
or
integrate
everything
directly
or
run
everything
as
part
of
kubernetes.
You
can
run
psyllium
on
a
virtual
machine
or
on
a
metal
machine
and
integrate
workloads
on
that
machine
directly
with
a
cubitis
cluster.
While
we
have
improved
in
1.12,
here
is,
first
of
all,
the
egress
Gateway
was
promoted
to
stable.
So
this
is
the
egress
Gateway.
A
We
have
added
net46
support
to
the
load,
the
launcher
very
exciting.
You
can
now
translate
between
ipv4
and
IPv6
at
the
service
level,
so
you
can
have
an
IPv6
only
pod
or
even
an
entire
cluster
running
only
in
IPv6
and
then
expose
that
part
with
an
ipv4
service
IP
and
then
at
the
service
IP
level
at
the
local
answer,
level
syllable
automatically
translate
from
ipv4
to
IPv6,
so
you
can
essentially
have-
and
this
is
what
this
feature
was
developed
for.
A
You
can
have
a
cluster
with
hundreds
of
thousands
of
Parts,
where
IPv6
is
incredibly
useful
because
you
will
have
an
unlimited
amount
of
IP
addresses
or
virtually
unlimited,
but
then
still
expose
those
parts
with
an
ipv4
address,
and
you
don't
need
to
give
the
parts
themselves
an
iPhone
4
address.
You
can
essentially
do
that
at
the
service
level,
where
you
need
much
fewer
or
a
lot
fewer
IP
addresses
so
very
exciting.
This
is
supported
for
the
standard
local
answer.
A
Bgp
enhancements
bgp
has
been
supported
for
a
couple
of
releases
in
psyllium
in
1.12.
We
have
added
full
IPv6
support
and
we
have
also
changed
the
online
mechanics
of
the
BG
implementation
to
support
additional
bgp
control
plans.
This
means
that
we
no
longer
only
depend
on
the
metal
lb
implementation,
but
we're
can
actually
go
from
metal
lb
to
go
bgp
which
has
additional
functionality,
including
IPv6.
With
this
move
we
have
also
become
a
more
more
plugable
or
more
model
modular,
so
we
can
actually
support
additional
vgp
implementations
if
required.
A
Vtap
integration,
great
contribution
where
we
can
now
integrate
psyllium
with
an
existing
vxlan
tunnel,
endpoint,
that's
potentially
running
in
a
traditional
data
center.
So
if
you
have
existing
vxlan
tunnel
endpoints,
what
are
these
are
routers
or
Advanced
switches
or
other
network
appliances?
You
can
now
essentially
terminate
or
create
a
vxlan
connection
from
a
pause
directly
to
avtap
security.
A
Obviously
I
think
most
of
you
probably
have
not
missed
this.
We
have
released
tetragon,
so
tetragon
is
essentially
our
entry
or
psyllium's
entry
into
runtime
security,
for
both
a
observability
and
from
an
enforcement
perspective.
So
we're
bringing
our
knowledge
of
evpf
to
the
runtime
security
world.
We
have
released
tetragon.
Initially.
This
was
part
of
our
Enterprise
distribution.
We
have
open
sourced
large
parts
or
vast
parts
of
tetragon
into
into
open
source
and
have
contributed
it
to
the
cncf.
A
All
of
this
is
collected
based
on
so-called
tracing
policies,
which
are
crds
and
they
are
then
exported
either
as
Prometheus
metrics
or
open
Telemetry,
metrics
or
via
Json
or
fluent
D
into,
for
example,
an
SIM.
So
you
can
have
logs
traces
and
metrics
for
all
of
these
security,
relevant
observability
data.
So
it's
obviously
very
deep
visibility.
It's
completely
transparent
because
it's
using
ebpf,
so
no
app
changes
are
needed.
The
applications
don't
even
notice
or
understand
when
they
are
being
observed.
It's
low
overhead
thanks
to
evpf
and
it
brings
all
of
the
existing
Integrations.
A
We
had
so
far
on
the
observability
side.
So
if
you're
already
running
grafana
and
Prometheus
metrics
for
your
psyllium
deployment,
you
can
neatly
integrate
tetragon
observability
as
well.
Tetragon
also
offers
enforcement
here.
The
big
difference
to
existing
Solutions
like
Falco,
is
that
the
enforcement
happens
in
the
kernel
itself,
so
the
rule
engine
what
should
be
allowed?
What
should
be
not
allowed
when
certain
things
are
being
observed?
A
How
to
react
on
that
is
all
in
the
comma
for
other
systems
like
Falco,
they
export
the
visibility
user
space
and
have
this
filter
engine
in
user
space,
which
means
they
need
to
react.
Asynchronously
in
user
space
tetragon
essentially
enforces
and
reacts
almost
in
real
time
in
the
kernel
and
can
thus
prevent
a
lot
more
attacks
instead
of
reacting
to
them.
Integrations
right
now
there
is
a
kubernetes,
cre
and
obviously
Json
Imports
so
touched
on
is
not
kubernetes
specific.
It
is
aware
of
kubernetes,
but
you
can
run
tetragon
outside
of
kubernetes
as
well.
A
We
have
also
improved
psyllium
as
a
security
model
in
112.
Actually
massive
improvements.
We've
worked
with
several
external
contributors,
we're
very
interested
in
improving
the
security
posture
of
silim
itself.
This
means
that
we
actually
removed
a
lot
of
privileges
that
were
previously
required
by
psyllium.
The
most
notable
one
is
that
now
psyllium
can
be
run
unprivileged,
so
you
no
longer
need
to
run
it
with
just
privileges.
It
still
needs
capnet
admin
capabilities,
but
it
is
obviously
a
lot
less
or
a
lot
a
lot
smaller
service
than
a
full
privileged
container.
A
Also,
if
available
cap
BPF,
we
have
also
massively
reduced
the
the
number
of
kubernetes
privileges
that
we
need
in
terms
of
objects
that
we
need
to
have
that
we
need
to
modify
or
even
have
read
access
for
a
variety
of
the
objects.
We
have
been
able
to
move
modifications
to
either
completely
remove
them
or
to
move
them
from
the
cylinder,
an
agent
which
runs
per
node
to
the
psyllium
operator,
where
you
have
essentially
just
a
few
deployments.
A
It's
it's
a
kubernetes
deployment,
so
you
will
run
one
two
or
three
to
one
two
or
three
replicas
with
leader
election,
so
you
can
actually
run
them,
particularly
on
particular
nodes
where
you
may
have
no
untrusted
users
on
it
for,
for
example,
so
you
can
lock
down
psyllium
further.
From
that
perspective,
we
will
continue
to
prove
on
this
side,
based
on
what
we
learn
and
kind
of
what
we
hear
backend
as
psyllium
progresses
from
from
a
number
of
deployments
perspective.
A
We
obviously
have
more
and
more
people
looking
into
this
as
well
now,
switching
over
to
the
networking
site,
so
bbr
for
pods
bbr
is
a
very
exciting,
relatively
new
congestion
algorithm
for
TCP.
It
has
been
primarily
developed
by
Google
and
it's
essentially
allowing
to
improve
latency
massively
in
a
lossy
network
like
the
internet.
A
So
if
you
are
exposing
Services
kubernetes
Services
publicly
on
the
internet,
which
I
assume
many
of
you
are,
you
can
now
use
bbr
and
actually
improve
the
latency
of
those
Services
massively
one
of
our
Engineers
has
done
an
extensive
talk
about
the
bbr
at
the
last
qcon,
including
a
very
impressive
demo,
where
we
had
a
as
a
video
being
streamed
over
the
wi-fi
at
kubecon,
and
it
was
lossy
of
course,
right.
There
was
a
Wi-Fi.
A
I
saw
that
I
missed
one
question
on
touchdowns:
let's
do
this.
Does
tetragon
have
an
impact
on
applications
performance?
Yes,
it
does.
It
will
differ
greatly
on
the
level
of
policy
that
you
that
you
implement.
So
if
you
go
back
to
here
and
if
we
say
if
you
want
to
log
every
single
system
call
that
is
being
invoked,
every
single
write
system
call
every
single
open
system
call
and
so
on.
A
Then
writing
all
of
the
all
of
those
logs
even
to
a
local
Json
file,
will
consume
CPU
cycles
and
in
fact
writing
to
file
and
doing
the
Json
encoding
and
so
on.
That
will
actually
be
the
the
biggest
portion
of
the
overall
overhead.
So
the
first
kind
of
factor
will
be
amount
of
observability
that
you
want
so
number
of
log
lines
per
second
and
then
metrics
are
more
efficient
than
locks.
A
So
going
back
to
the
networking
piece,
we
talked
about
bdr
the
the
slide
deck
here
will
link
to
the
to
the
video
that
actually
has
a
full-blown
demo
of
this
feature,
as
well
as
the
qcon
recording.
We've
also
promoted
the
bandwidth
manager
to
stable
the
bandwidth
manager
is
able
to
control
the
network
resources
of
a
pod.
So
you
can
limit
the
traffic
of
a
pod,
for
example,
to
five
megabytes
per
second
or
so
certain
number
of
packets
per
second.
So
you
can
actually
do
a
resource
control
very
similar.
A
How
you
can
do
this
with
CPU
and
memory
as
well.
This
supports
the
standard
annotations
that
are
available
in
kubernetes
deployments
and
pods,
and
you
can
also
automatically
configure
the
the
TCP
congestion
algorithm
and
optimize
it
so
syllable
automatically
enable
a
variety
of
Kernel
level,
TCP
optimizations,
that
will
improve
the
performance
of
the
network
for
your
particular
pods
by
understanding
what
the
parts
require
Dynamic
allocation
of
pod
cider.
So
this
is
exciting.
We
can
now,
instead
of
doing
part
side
or
ipam,
so
one
big
block
per
node.
A
We
can
now
do
multiple
blocks,
which
means
we
can,
for
example,
assign
slash,
26
or
slash
2028
or
slash
30
and
then
nodes,
as
they
run
out
of
ips.
We'll
go
grab
a
new
block,
so
this
is
kind
of
the
middle
ground
between
doing
let's
say
a
slash,
24
pod
cider
per
node,
where
you
will
quickly
run
out
of
your
toe
lip
space
or
doing
slash
32
individual
IPS,
which
is
very
expensive
because
the
control
plane
it
needs
to
do
a
lot
of
work.
So
Dynamic
allocation
of
pod
cider
is
the
middle
ground.
A
This
is
in
particular
grade
for
bgp
integration,
because
you
need
to
announce
a
lot
fewer
number
of
prefixes
on
the
pgp
network,
quarantining
service
backends.
You
can
now
in
kubernetes,
with
kubernetes
Services,
actually
quarantine,
a
particular
backend,
which
means
States
backend
will
stop
receiving
connections.
This
means
you
can
gracefully
shut
down
Parts.
What
most
people
do
today
is
actually
just
scale
down
the
deployment
and
it
will
just
cut
off
connections
to
that
spot.
A
So
if
this
is
a
public
publicly
exposed
service,
whatever
customers
or
clients,
are
accessing
the
backend
that
is
being
scaled
down,
they
will
just
have
their
connection
cut
off,
because
the
part
is
turning
off
with
quarantining.
You're,
essentially
stop
redirecting
new
connections
to
a
back
end,
and
as
soon
as
no
existing
connections
exist,
you
can
safely
shut
down
or
scale
down
the
pod
improved
multi-homing
for
load
balancers.
So
we
are
adding
the
ability
to
essentially
have
multi
for
the
Standalone
low
plants
to
support
multi-homing.
A
This
was
not
really
optimized
so
far
for
for
multi-homed
nodes.
We've
now
added
the
capabilities
for
this.
This
means
that
if
you
have
nodes
which
are
in
a
multi-homed
architecture,
so
that
are
part
of
multiple
networks,
they
have
multiple
network
interfaces.
You
can
now
Define
exactly
how
the
local
answer
should
behave
in
this
environment,
for
example,
should
the
client
connect
should
they
be
coming
in
from
one
interface
and
then
should
it
pick
back
ends
on
another
interface
and
so
on?
A
This
is
very
useful,
in
particular,
if
you're
on
premise
or
if
you
have
more
traditional
Network
use
cases
AWS
cni
prefixed
delegation,
so
we
can
now
finally
really
scale
with
our
AWS
in
I
integration,
and
we
now
support
the
the
new
prefix
delegation
mode
of
AWS
enimo.
This
means
that
you
can
essentially
run
a
lot
more
parts
per
note
and
have
a
more
efficient
IPM
mechanism.
A
If
you're
running
on
AWS,
with
the
AWS
in
I
iPad
mode
enabled
also,
we
have
a
new
EC
ec2
instance
tag
filter
for
air
for
for
ipam,
with
additional
capabilities
details
here
on
the
slide
or
in
the
release
block
nice.
This
feature
was
contributed
by
an
end
user
from
New
York
Times.
We
love
when
we
see
new
features
getting
added
by
end
users.
A
And
I
see
another
question
from
Jerry:
how
to
accomplish
zero
downtime
upgrade
from
111
to
112,
I
drive
with
psyllium
CLI
and
Helm
chart.
Not
all
of
the
sodium
agent
parts
or
slim
operator
will
come
up
properly.
That
sounds
like
a
bug
approaches
on
on
slack,
we're
also
happy
to
hook
you
up
with
one
of
our
our
solution.
Architects.
This
is
psyllium,
supports,
rolling
upgrades
or
rolling
pod
upgrades.
You
should
have
near
zero
or
zero
impact
upgrades.
A
There
are
a
few
components
that
will
have
build
impacted,
such
as
proxies
or
in
the
open
source
version,
the
DNS
proxy,
but
in
general
you
should
not
have
drops
and
all
the
ceiling
Parts
should,
of
course
come
up
when
you
upgrade
so
reach
out
to
us
and
I
see.
We
also
have
a
bug
report.
One
of
the
getting
started
docs
does
not
exist.
We
will
get
that
fixed.
You
may
need
to
change
the
url
from
latest
to
stable.
That
may
actually
just
be
a
stale
URL
that
we
need
to
fix.
A
So,
whoever
wrote
that
question,
if
you,
if
you
change
that
link
or
if
you
just
go
to
the
doc
to
docs.7.io
and
click
through
service
mesh,
you
should
find
the
right
post
kind
of
cve
be
a
trigger
for
a
quarantine
of
a
pod.
Yes,
you
can
use
whatever
whatever
trigger
you
want.
The
typical
use
case
is
scaling
down,
but
of
course
you
can.
Essentially,
if
you
believe
that
a
pod
has
been
compromised,
you
can
quarantine
it.
A
One
asked
we
have
received
a
lot
is
that
the
psyllium
CLI
is
great
at
automatically
deriving
the
ideal
configuration
of
psyllium
for
a
particular
environment,
so
it
will
automatically
detect
your
cluster
is
running
in
AWS
or
it's
an
AKs
cluster
or
it's
gke
or
it's
Rancher
or
like,
and
it
will
automatically
generate
the
rights
or
the
best
potential
configuration
on
how
to
run
psyllium
with
the
latest
112
release.
This
feature
is
now
available
where
it
essentially
emits
Helm
flax.
A
So
instead
of
Auto,
detecting
the
values
and
simply
installing
right
away,
you
can
essentially
audit
the
vector
values
and
emit
home
flags
and
then
install
psyllium
using
your
own
Helm
Helm
pipeline,
or
your
existing
Helm
workflow
assure
bring
your
own
cnis
or
sure
Cloud
added
a
new
feature
called
bring
your
own
cni,
which
essentially
allows
to
install
AKs
on
Azure
without
any
cni
installed.
This
massively
simplifies
the
installation
of
sodium.
A
We
have
a
screenshot
here
before
and
after
so
before,
you
had
to
do
a
lot
of
different
steps
to
install
AKs,
including
creating
node
groups
and
tainting
nodes,
to
make
sure
that
psyllium
is
installed.
First
on
the
Node
before
any
other
pilot
gets
scheduled
very
complicated
with
bring
your
own
cni.
This
essentially
becomes
very
trivial.
You
install
a
new
AKs
cluster
and
bring
your
own
cni
mode,
and
you
can
simply
install
sodium
using
the
default
installation
path.
No
special
workarounds
required
anymore,
unfortunately
bring
your
own
cni
is
only
available
for
new
AKs
clusters.
A
A
We
have
released
an
extension
or
a
new
version
of
Hubble
tinescape
Timescape
is
the
time
series
database
that
we
offer
where
you
can
store
all
the
observability
data
of
hobble
of
service
mesh
on
the
networking
side,
on
the
tetragon
runtime
side
and
so
on
and
feed
that
into
a
Time
series
database.
So
you
can
store
that
data
persistently
over
time
and
then
query
it
Hubble
or
Hubble.
Timescape
is
based
on
click
house.
A
A
network
operation
use
cases,
openshift,
certification
updates,
of
course,
with
1.12.
We
have
renewed
all
the
certifications
for
both
Enterprise
and
OSS.
So
we
of
course
remain
completely
certified
on
openshift
or
certified
operator,
as
well
as
a
certified
cni.
We
have
added
offline
installation
support
in
1.12.
So
that's
a
new
addition
with
the
latest
release:
Network
visibility.
This
is
a
new
functionality
that
comes
via
tensorcon.
Enterprise
is
essentially
the
ability
to
look
into
a
lot
of
very
low
level.
A
Network
metrics
and
network
data
completely
passively
and
passively
means
that
we're
not
actually
parsing
the
network
traffic
directly.
So
we're
not
really
in
the
data
path,
so
we're
adding
no
additional
latency
but
we're
essentially
parsing
or
understanding
what
the
TCP
or
the
Linux
networking
stack
does
itself
and
can
extract,
for
example,
round-trip
times
of
connections,
or
we
can
understand
TLS
handshakes
or
we
can
instead
understand
number
of
like
amount
of
traffic
by
looking
at
the
sockets
or
the
socket
counters,
instead
of
trying
to
parse
and
count
network
number
of
network
bytes.
A
So
this
can
give
you
essentially
the
ability
to
monitor
your
network
even
in
a
super
low
latency
environment.
This
particular
feature
has
been
implemented
for
environments
such
as
Financial
Financial
transactions
with
very
low,
fixed
latency
guarantees
that
need
to
be
met.
So
it's
essentially
a
feature
that
allows
you
to
over
to
monitor
your
networks
and
to
gain
visibility,
engine
Network
at
extremely
low
overhead
without
introducing
additional
latency
in
the
in
the
actual
workload
traffic
mha
proxy.
So
this
is
now
fully
stable
and
has
been
released
as
part
of
the
Enterprise
version.
A
So
this
feature
is
now
available
in
a
highly
available
fashion,
which
means,
if
you
upgrade
psyllium,
if
you
restart
psyllium,
if
psyllium
is
down
for
some
reason,
the
fqdn
or
adenos
proxy
is
separate
and
is
highly
available,
which
means
the
part
can
continue
to
resolve.
Dns
even
as
psyllium
is
restarted
and
connections
are
not
impacted.
A
A
You
can
simply
click
on
that
if
you're
interested
and
pick
a
time
slot
that
works
for
you
and
we
will
schedule
a
demo
session
during
that
time
with
you,
we
also
have
Labs
or
Hands-On
tutorials
they're
instruct
based,
which
is
amazing,
because
it
gives
you
essentially
within
a
couple
of
minutes,
a
full
syllium
environment
where
you
can
play
around
with
new
features,
for
example
with
the
service
mesh
piece
without
having
to
install
selim
yourself.
So
you
can
get
hands
on
and
actually
walk
through.
A
And
then,
last
but
not
least,
we
have
a
a
webinar
series
around
evpf.
So
if
you
want
to
learn
more
about
ebpf,
if
you're
interested
in
what
is
going
on
around
ebpf
here
this
exciting
technology,
maybe
you
have
seen
let's
rise
talk
about
ebpf
and
you
really
want
to
learn
more.
What
is
under
the
hood
of
psyllium,
we
have
essentially
a
ebpf
webinar
series
how
the
hive
came
to
be
where
we
will
specifically
Deep
dive
on
the
evpf
site.
Cornelius
just
posted
the
link
there
as
well.
A
That
only
way
you
can
run
Cinema
evpf
mode
in
Google
is
by
bootstrapping
your
own
cluster-wide
Cube
admin
which
we
can,
which
we
may
not
want
to
do.
How
do
we
navigate
this
challenge?
So
what
we
can
offer
you
as
ice
surveillance
is
surveillance,
does
have
a
partnership
with
Google.
If
you
want
to
run
ISO
valence
slim
Enterprise
on
gke,
then
we
can
help
you
there.
A
Unfortunately,
Google
does
not
allow
running
psyllium
OSS
easily
on
GK
itself
right
now.
Unfortunately,
I
cannot
give
you
a
better
answer.
If
you
want
to
run
the
full
feature
set
of
psyllium
your
best
option
right
now
is
come
talk
to
us
and
we
can
bring
you
into
the
essentially
the
I
surveillance
psyllium
version
on
GK
I
know:
that's
not
the
perfect
answer,
but
that's
the
the
best
answer
that
we
can
provide
right
now.
A
Let
me
double
check.
If
I
got
all
the
questions,
I
saw
that
regarding
the
service
mesh,
there
was
one
question:
can
you
explain
the
option
two
a
little
more,
so
let
me
talk
a
little
bit
about
that.
So
that's
the
istio,
the
istio
integration,
so
the
istio
integration
has
existed
for
several
years
in
this
mode.
You
install
sodium,
as
you
do
normally
no
change
required.
Then
you
enable
the
istio
integration
and
then
you
install
istio,
as
you
would
normally
do.
There's
instructions
in
the
docs.
A
What
this
will
result
to
it
will
actually
change
the
specific
Envoy
version
that
is
running
as
part
of
the
sidecar,
so
it
will
bring
psyllium's
Envoy
filter
into
istio
as
well.
What
this
means
that
you
can
now
run
psyllium
and
STL
side
by
side,
and
this
channel
will
run
a
site
called
proxy
in
this
mode
whenever
you
define
a
psyllium
or
policy
or
when
you
Define
layer,
7
observability
and
the
policy
contains
layer,
7
aspects,
these
aspects
will
be
enforced
or
done
via
the
side.
A
Color
of
istio,
so
silly
will
not
start
its
own
Envoy
proxy.
It
will
use
istio's,
sidecar
proxy.
This
mode
will
also
optimize
and
it
will
quickly
go
back
to
the
slide,
because
it
will
make
this
a
lot
clearer.
So
if
we
go
all
the
way
back
to
the
the
complicated
injection
strategy
of
istio
or
service
meshes
with
facade
current
Channel,
here
we
go
there.
We
go
so
this
initial
kind
of
hook.
Here
this
blue
hook
all
the
way
down
on
Instagram
service
mesh
or
a
service
mesh
sidecar
proxy
with
psyllium
issue
integration.
A
We
can
essentially
have
this
blue
line
connect
at
the
socket
level
right
away,
so
we
can
essentially
Short
Circuit
the
sockets
directly
together.
This
actually
works
for
other
node
local
traffic
as
well.
It's
not
sidecar
or
service
mesh
specific.
If
this
feature
enables
any
connection
that
remains
on
the
Node,
you
can
optimize
this
way.
A
It
means
that
there
is
no
network
connection
really
or
no
network
payload
anymore,
for
the
path
from
the
app
to
the
sidecar,
which
also
means
that
nothing
is
left
unencrypted,
because
if
you
run
ntls
in
a
sidecar
mode,
this
initial
blue
Hook
is
actually
unencrypted,
because
the
sidecar
proxy
will
store
TLS,
which
means
only
the
connection.
That's
leaving
the
sidecar
will
be
TLS
encrypted
and
with
the
istio
integration,
because
that
blue
hook
gets
short
and
there
is
no
actual
TCP
involved.
A
It
means
that
there
is
no
network
packets,
unencrypted
on
even
a
virtual
wire
for
more
information.
There
is
an
istio
guide
in
the
docs
that
you
can
follow
to
get
started
with
this,
otherwise
reach
out
to
us
on
slack
and
we're
happy
to
help
going
back
to
the
Q
a
and
we'll
check
one
more
time.
If
we
have
any
more
questions
that
came
in
all
right,
we're
right
there
lots
of
slides.
Here
we
go.
A
Downgrade
we
we
covered
CV
recovered.
Yes,
I
think
I,
think
that
was
all
the
questions
so
again.
Thank
you
very
much
for
joining
this
webinar
I
hope
this
was
useful.
Please
give
us
feedback
again
if
you
want
to
learn
more
feel
free
to
check
out.
One
of
the
links
here,
of
course,
also
feel
free
to
join
slack.
A
If
you
have
not
done
so
far,
simply
go
to
cillian.io
click
on
the
slack
link
and
you
can
get
in
contact
with
the
team
if
the
devs
with
me
and
so
on,
reach
out
for
follow-up
questions
and
with
that
I
would
like
to
thank
everybody
for
participating
and
I'm
looking
forward
to
the
next
release.
Webinar
113.
thanks
a
lot.
Everybody.