►
Description
No description was provided for this meeting.
If this is YOUR meeting, an easy way to fix this is to add a description to your video, wherever mtngs.io found it (probably YouTube).
A
Hi
welcome
to
today's
webinar
I'm,
Stephen
A
Solutions
architect
versus
civio.
Today,
we'll
discuss
resource
allocation
in
kubernetes.
Some
of
the
challenges
with
kubernetes
resource
allocation
and
House
of
Sevilla
is
tackling
these
problems.
Please
place
your
questions
in
the
comment
section
below
and
we'll
answer
them
as
soon
as
possible.
A
Today
we
will
start
with
a
brief
introduction
to
sicivio.
We
will
then
discuss
the
biggest
challenges
of
kubernetes
resource
allocation
and
how
socivio
is
solving
these
challenges.
With
our
application,
profiling
module,
we
will
dive
into
the
civio's
application
profile
and
the
benefits
of
using
sevilla's
novel
methodology
called
Data
swirling
to
fuel
our
profiling
recommendations.
A
A
This
means
we
are
able
to
constantly
observe
cloud
data
environments
detect
when
certain
behaviors
will
lead
to
critical
failures,
determine
the
root
cause
of
those
issues
and
alert
users
of
failure.
Events
as
they
unfold
in
real
time
foreign.
By
taking
action
early,
we
prevent
small
issues
from
becoming
catastrophes
which
saves
companies
from
filling
the
business
impact
of
an
outage.
A
It
plays
along
the
nautical
theme
of
kubernetes
and
literally
means
life
jacket
and
Greek.
Yes,
socivia
is
your
life
jacket
on
your
kubernetes
voyage.
Everyone
is
excited
about
kubernetes.
How
could
you
not
be
kubernetes
adds
in
vital
automation
that
greatly
assists
in
developing
microservices
at
scale
developers,
love
the
benefits
of
faster,
easier
and
flexible
ways
to
build
and
deploy
applications.
A
This
translates
to
an
approved
user
experience,
increased
Revenue,
a
shortened
time
to
Market
and
much
more
Enterprises,
see
kubernetes
as
a
key
to
unlocking
lower
cost
applications
by
utilizing
several
small
containers
versus
an
entire
VM
or
physical
server.
While
the
benefits
are
undeniable,
the
hidden
secret
is
that
kubernetes
is
actually
complex.
A
Kubernetes
is
dynamic,
workloads
are
ephemeral,
but
they're
not
always
treated
as
such.
There
are
several
layers
underneath
the
kubernetes
abstraction
layer.
Each
one
of
these
layers
has
a
lot
going
on
and
when
there
is
an
issue,
it's
much
more
difficult
to
find
versus
when
dealing
with
a
single
layer.
A
A
This
early
momentum
breeds
excitement
and
supports
moving
more
applications
over
to
kubernetes.
At
some
point
that
momentum
slows
or
even
stops
abruptly,
but
why
teams
start
to
experience,
kubernetes
complexity
in
the
business
impact
of
unresolved
issues
in
their
impacts
on
neighboring
applications
within
the
cluster,
like
over-allocated
resources,
which
will
cause
other
applications
to
throttle
intermittently
or
even
crash,
as
companies
increase
adoption.
These
issues
compound
exponentially
and
result
in
both
significantly
more
complexity
and
a
significantly
higher
Cloud
Bill
than
anticipated
manually
trying
to
find
and
allocate
resources
is
difficult
and
impossible
to
do
at
scale.
A
The
safe
and
easy
option
is,
to
just
add
a
few
more
resources
than
you
think
you
will
need
for
a
single
application.
It's
really
not
an
issue,
but
multiply
this
waste
across
several
applications
or
in
most
cases
thousands
and
becomes
clear.
It's
causing
significant
waste
and
it's
definitely
not
scalable.
A
A
It's
like
being
thrown
off
a
ship
into
the
ocean
and
being
told
okay
now
learn
how
to
swim
while
you're
treading
in
water
with
your
head
sinking,
lower
and
lower
socivio.
Is
the
life
jacket
that
lifts
you
back
up?
Brings
you
back
to
the
ship
and
allows
you
to
continue
your
kubernetes
journey
as
companies
migrate
to
Cloud
native
applications
and
adopt
either
a
cloud
or
hybrid
Cloud
approach.
They
need
to
start
thinking
about
capacity
while
cloudnative
brings
a
promise
of
smaller,
more
agile
applications.
It
inherently
removes
a
physical
limitation
for
maximum
capacity.
A
If
you're,
given
a
thousand
nodes
with
a
set
of
Hardware,
you
know
your
maximum
capacity
and
it's
impossible
to
exceed
it
without
requesting
and
installing
new
hardware.
This
is
a
natural
ceiling
on
capacity
as
much
of
a
headache
as
it
might
be
to
go
through
the
process
to
buy
more
servers.
It
is
a
natural
barrier
to
not
exceeding
your
spend
in
it
infrastructure
cloud.
Service
providers
make
this
barrier
much
less
significant
and
much
easier
to
exceed,
and
they
are
incentivized
to
make
you
do
this.
A
They
surely
have
more
than
enough
capacity
for
companies
to
grow
into
and
allowing
your
iot
infrastructure
to
grow
is
in
their
best
interest
as
a
business.
The
cloud
enables
a
lot
of
innovation
and
Agility,
but
also
opens
the
door
to
much
more
waste.
Having
more
space
to
use
while
not
being
thoughtful
about
resources
is
a
double-edged
sword,
because
the
more
space
that
is
used,
the
more
likely
there
is
going
to
be
a
higher
amount
of
wasted
resources.
A
Overall
capacity
is
important
as
we
want
to
tame
costs
from
getting
out
of
control,
but
it's
also
important
on
a
per
node
level
as
well.
We
care
about
capacity
per
node
for
performance
reasons,
cost
at
a
per
node
level,
isn't
really
a
problem,
but
performance
can
be
destroyed.
If
we're
not
careful,
one
container
is
wasted
or
non-restricted
resources
affect
every
other
container
running
on
the
same
node.
You
may
have
heard
the
term
Noisy
Neighbor
before
which
refers
to
this
issue.
A
It's
actually
more
analogous
to
having
a
hostile
neighbor,
who
is
wreaking
havoc
across
the
entire
neighborhood.
For
example,
if
one
container
is
using
a
large
portion
of
resources
and
every
other
container
rely
on
those
wasted
resources,
they
could
be
throttled,
killed
or
not
even
deployed
in
the
first
place.
This
translates
to
a
poor
customer
experience
and
lost
Revenue.
A
A
A
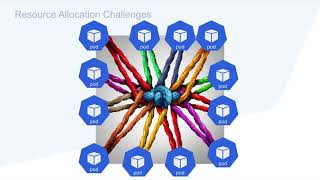
Imagine
every
application
in
the
cluster
has
a
piece
of
rope
tied
to
it
and
the
other
applications
on
the
cluster
one
polar
rub
has
second
and
third
order
effects
across
the
entire
cluster.
Adjusting
one
pod's
resources
affects
the
other
pods
to
interact
with
it.
If
your
backend
applications
are
under
allocated
and
they
cause
timeouts
with
the
front
end,
then
it
causes
user
issues.
A
This
is
only
a
very
basic
example
and
gets
exacerbated
in
highly
complex
at
scale.
Watching
analyzing
and
adjusting
resources
for
a
cluster
could
easily
be
a
full-time
job
for
someone,
even
with
a
swap
cluster,
it's
impossible
to
do
this
manually
for
most
companies.
Now
most
developers
are
simply
guessing
or
over
allocating
to
ensure
they
have
enough
resources.
A
This
is
where
socivio's
application,
profiling
really
shines.
Application.
Profiling
enables
users
to
get
live
feedback
and
recommendations
for
resource
allocation
to
fully
optimize,
both
cost
and
performance
of
applications
for
your
entire
environment,
with
just
a
click
of
a
button.
This
enables
developers
and
operations
teams
to
maintain
the
velocity
at
which
they
intend
to
deploy
new
applications.
A
A
A
We
have
discussed
that
there
are
financial
and
performance
sets
you
take
if
you
don't
properly
profile
your
applications.
For
example,
if
you
under
allocate
resources,
you
could
get
pods
being
om,
killed
and
throttled.
If
you
over
allocate
resources,
you
could
get
pods
being
throttled
or
wasting
resources.
If
you
elect
to
not
specify
any
requests
or
limits
to
resources,
then
you
could
have
pods
being
om,
killed
or
throttled,
but
why
do
these
events
happen?
First,
let's
define
what
CPU
and
member
request
limits
are.
A
For
example,
let's
say
we
wrote
an
application
that
can
Digest
100
000
requests
a
second
and
it
will
consume
512
megabytes
of
memory,
so
I
tell
kubernetes
that
this
application
that
it's
about
to
deploy
is
going
to
require
at
least
512
megabytes
of
memory.
That's
the
request.
This
is
why
kubernetes
knows
how
to
take
an
application
and
put
it
on
a
node
that
has
at
least
512
megabytes
of
memory
free.
If
we
don't
set
a
request,
then
kubernetes
would
just
put
it
anywhere
and
hope
for
the
best.
A
In
the
case
that
pod
gets
assigned
to
node,
with
only
100
megabytes
of
memory
available,
the
Pod
will
crash.
If
it
consumes
more
than
100
megabytes,
it
would
reach
that
100
megabyte
limit,
try
to
consume
a
little
bit
more
and
then
get
om,
killed.
It's
likely
to
restart
again
and
again
and
again.
The
same
applies
for
CPU
requests,
but
because
CPU
is
a
rechargeable
resource,
the
negative
effects
are
throttling
and
poor
application
performance.
The
second
resource
allocation
parameter
that
we're
going
to
talk
about
is
the
limit.
A
The
limit
actually
instructs
kubernetes
to
set
a
limit
for
that
process,
and
it's
actually
for
the
control
group
in
which
the
process
is
running
on
the
Node
in
which
it
will
deploy
the
application
cannot
cross
that
limit
without
being
killed
or
throttled
for
memory
and
CPU
respectively.
The
reason
to
do
that
is
to
protect
all
of
the
other
applications
on
the
cluster
itself.
A
A
First,
we
collect
all
the
raw
data.
We
would
need
to
make
an
informed
decision.
Second,
we
measure
the
data
over
our
set
time
interval
to
determine
how
the
application
behaves.
Finally,
we
adjust
the
code
and
or
resources
to
meet
the
application's
needs.
Raw
data
collection
can
be
done
with
a
variety
of
scripts
or
tools.
A
On
the
top
of
the
screen,
we
have
the
exact
same
pod
display
at
the
exact
same
time
intervals
only
in
socivious
live
metrics
dashboard.
Clearly
we
can
see
the
level
of
detail
that
cessivia
provides
over
the
most
commonly
used
tool.
Today,
if
we're
at
a
profile
CPU
based
on
the
kirfana
dashboard,
then
we
would
say
my
CPU
never
exceeded
half
a
core
and
we
would
set
our
CPU
requesting
limits
accordingly.
A
In
reality,
the
CPU
is
much
more
active
with
the
CPU
reaching
over
half
a
core
15
times
and
even
up
to
1.4
cores
profile
in
this
application
with
0.5
cores
would
cause
consistent,
throttling
causing
very
bad
application
performance
timeouts
in
a
variety
of
other
issues
that
can
stem
to
every
other
pod
that
interacts
with
socipio's
data
is
much
different
than
what
Prometheus
is
displaying.
We
can
easily
see
that
data
granularity
greatly
affects
how
we
would
accurately
allocate
resources
to
this
application.
A
Imagine
how
this
discrepancy
in
accurate
data
affects
every
other
application
running
on
your
kubernetes
cluster.
The
single
example
becomes
a
massive
issue
at
scale.
Using
inaccurate
data
clearly
leads
to
issues
that
are
exacerbated
at
scale.
So
how
do
we
start
with
accurate
and
granular
data?
How
do
we
work
with
the
data
collectors
out
there
today
if
they're
not
usable?
Well,
we
don't
so
severe
recognized
this
issue
and
we
opted
to
build
our
own
high
performance
data
collectors
that
overcame
the
challenges
of
Open
Source
data
collectors.
A
Data
collectors
are
incredibly
resource
friendly
and
completely
optimized
for
kubernetes
they
collect
metrics
at
a
much
more
granular
level
than
any
other
open
source
tool
in
existence.
Today
we
speak
about
this
in
our
other
webinar
in
data
swirling,
which
talks
about
sussivia's,
novel
approach
to
both
Gathering
granular
metrics,
and
also
finding
and
preemptively
detecting
kubernetes
issues
with
custom
data
collectors,
utilizing
data
scrolling,
socivio,
collects
and
analyzes
massive
amounts
of
data
at
lightning
speed.
A
A
We
determine
what
pieces
of
data
are
relevant
by
immediately
evaluating
every
data
point
that
we
collect.
We
only
analyze
the
currently
relevant
data
within
our
set
of
machine
learning.
Microservices
data
is
processed
and
analyzed
100
in
memory
and
immediately
swirled
to
the
next
machine.
Learning
microservice
for
processing
in
parallel
live
metrics
are
displayed
in
our
dashboard
in
applications,
resources
are
profiled
and
optimization
recommendations
are
provided.
A
This
is
different
than
every
other
tool
today,
because
they
all
collect
data
stored
on
disk
in
a
database,
then
process
that
data
and
then
send
back
results
after
an
incident
has
happened
or
display.
Metrics
that
are
computed
averages
and,
frankly,
not
usable.
Also
many
tools
today
are
highly
intrusive.
They
require
instrumentation
code
injection
data,
offloading
or
variety
of
other
security
and
stability
risk.
A
Let's
talk
about
a
few
more
approaches
to
determining
resource
allocation
and
why
they
fall
short.
I
have
talked
to
multiple
people
who
sit
there
using
a
vertical
pod,
Auto
scaler
and
wants
to
know
why
it's
not
the
right
solution.
Well,
first
and
foremost,
it
competes
against
horizontal
scaling,
which
is
a
key
principle
to
Cloud
native
architecture.
The
entire
purpose
of
a
containers
is
to
use
as
few
resources
as
possible
and
to
be
elastic
or
scale
horizontally.
A
By
doing
this,
you
won't
run
into
limitations
of
a
single
machine
if
architected
properly
and
you
can
handle
a
load
that
is
limited
only
by
our
entire
infrastructure
or
kubernetes.
Cluster
right
size
in
your
application
is
essentially
fully
automated.
At
this
point,
the
second
issue,
with
the
vertical
pod
Auto
Skiller,
is,
if
you
don't
set
or
incorrectly
set,
then
Max
allowed
for
your
resources.
Then
it
will
continue
to
add
more
resources
to
your
applications
without
knowing
or
caring
about,
the
repercussions
have
enough.
A
Resources
are
added,
the
Pod
will
be
om
killed
and
you
would
need
to
go
through
the
process
of
determining
the
proper
request
and
limits
anyway,
on
top
of
recovering
from
a
failed
application.
The
third
issue
is
that
you
should
set
boundaries
for
your
resources.
These
are
called
the
men
and
Max
allowed
in
the
vertical
pod.
Auto
scaler
question
is,
without
accurately
profiling,
your
application.
How
do
you
get
a
Min
and
Max
allowed?
A
You
would
be
relying
on
bad
data
in
most
cases
and
again
it
negates
any
time
that
you
think
you
save
by
relying
on
the
vertical
pod
Auto
scaler.
If
those
are
not
good
enough
reasons,
then
I'll
leave
you
with
this.
There
is
a
reason
that
the
kubernetes
committee
rejected
the
vertical
pod
Auto
scalar
project
inside
your
own
risk
to
use
it.
A
A
If
you
have
the
time
to
manually,
do
this
for
each
and
every
version
of
an
application
to
deploy
and
you're
only
utilizing
kubernetes
for
a
few
small
applications
and
go
for
it.
This
is
usually
never
the
case,
and
one
can
argue
that
you
should
not
bother
using
kubernetes
if
it's
first
single
application
or
only
a
handful
and,
of
course,
you're
not
going
to
use
trial
and
error
with
massive
production
deployments
in.
Furthermore,
not
when
scaling
trial
and
error
simply
does
not
work
at
scale.
A
It
would
require
an
extensive
amount
of
people
to
do
this
as
a
full-time
job.
Load.
Testing
should
only
be
done
to
determine
the
minimum
viable
settings
needed
to
run
a
base
unit
of
a
microservice.
This
means
that
we
need
to
find
how
small
we
can
make
a
pod
to
handle
the
smallest
semi-upload.
Our
application
will
receive.
A
The
problem
is
that
most
companies,
even
if
they
claim
they
are
experienced
kubernetes
users-
are
performing
load
testing
on
an
application
and
trying
to
determine
how
big
they
should
make
it.
We
talked
about
manually,
observing
metrics
already,
but
as
a
recap,
it's
time
consuming
and
open
source.
City
collectors
don't
provide
accurate
enough
data
to
you.
A
We
collect
detailed
metrics
for
all
of
your
applications
and
feed
that
into
our
application
profile
and
microservices.
These
microservices
are
constantly
observing
the
application's
behavior
in
resource
consumption.
There
are
a
number
of
tools
today
which
can
greatly
assist
in
resource
profiling.
However,
so
sibio
has
an
advantage
in
that
we
leverage
our
state-of-the-art
data's
role
in
technology,
which
is
our
real-time
and
disconnected
data
collection
and
Analysis
architecture.
A
Of
course,
the
Civil
will
alert
you
if
your
applications
are
non-cloud
native
and
it
will
still
recommend
resource
allocations
based
off
best
practices
for
a
cloud
native
design.
If
you
do
run
into
this
warning,
it's
a
great
thing.
It
means
there's
room
for
improvement
in
your
application
design
and
we
have
identified
it.
This
process
makes
your
applications
significantly
more
stable,
robust
and
scalable.
A
One
in
common
scenario
is
that
socivio
generates
lower
resource
requested
limits
than
a
developer
has
allocated,
and
thus
incorrectly
thanks
should
be
allocated
which
scares
developers,
the
application
will
run
and
throttle
when
it
hits
a
certain
load.
The
proper
method
of
allowing
more
capacity
is
to
scale
horizontally
by
adding
more
replicas.
This
ensures
we
are
utilizing
Cloud
native
design
principles
to
achieve
unlimited
elasticity
with
their
applications.
A
The
problem
is
that
newer
or
inexperienced
developers
who
apply
the
lift
and
shift
mentality
are
not
prepared
to
add
replicas,
but
rather
scale
up
this
poor
application
design
can
lead
to
lost
data
and
or
poor
performance.
Keep
in
mind
that
this
is
100
tied
to
poor
application.
Design
This
goes
against
the
entire
point
of
kubernetes
and
microservices
socivious
application
profile.
Not
only
gives
you
the
right
recommendations,
but
it
can
make
your
developers
better
prepared
for
cloud
native
world.
A
Let's
take
a
look
at
an
over-allocated
application
to
see
how
we
can
quickly
free
up
resources
on
our
cluster
and
reduce
our
Cloud
spend
on
the
top
of
the
screen.
We
have
socivious
live
metrics
on
CPU
consumption,
for
our
grafana
deployment
of
note.
Sycivious
live
metrics
are
always
free
and
are
much
more
granular
than
what
Prometheus
provides
on
the
bottom
of
the
screen.
We
have
the
same
application
during
the
same
time
period
only
they
are
displayed
in
openshift,
Via,
prometheus's
live
metrics
and
CPU
consumption.
A
By
looking
at
sicivio,
we
can
see
that
the
application's
behavior
is
pretty
erratic.
With
several
repetitive
spikes
in
CPU.
We
will
take
a
look
at
the
memory
consumption
as
well.
We
can
see
it's
fairly
consistent
over
the
same
time
period.
Okay,
now
normally
we
would
have
to
start
writing
down
the
data
points
for
CPU
and
memory.
Consumption
determine
how
the
application
behaves
calculate
the
resources
used
while
balancing
that
against
the
application's
behavior
to
determine
our
resource
requests
and
limits.
A
A
A
We
were
also
over
allocated
on
CPU
by
quite
a
bit,
so
sevilla's
recommendations
are
reflective
of
the
actual
consumption
of
a
grafana
and
the
best
part
is.
We
didn't
have
to
waste
time,
tracking
and
analyzing
all
this
information.
We
simply
click
execute
recommendation
into
civio-adjusted
resource
requests
and
limits
for
us
saving
precious
resources
in
our
cluster
that
can
be
allocated
to
other
applications
to
improve
their
performance
or
make
space
for
more
applications
to
be
deployed
on
our
same
cluster.
A
Let's
take
a
look
at
one
more
application.
This
time
we
will
look
at
a
pod
that
is
under
allocated
and
throttling
we'll
take
a
look
at
the
live
metrics
for
the
Pod
to
better
understand,
Cecilia's
recommendations,
the
memory
consumption
is
relatively
low
and
there
are
no
real
concerns
there.
Let's
take
a
look
at
CPU
consumption.
We
see
that
CPU
consumption
is
continuously
hovering
around
the
limit.
It
is
likely
throttling.
A
We
will
take
a
look
at
the
throttling
page
and
we
can
see
that
it
is
in
fact
throttling,
as
the
graph
is
at
100
percent.
We
will
navigate
over
to
application
profiling
and
take
a
look
at
the
recommendations.
Of
course,
the
recommendations
for
CPU
resources
are
higher
and,
given
that
the
application
is
constantly
throttling
we're
going
to
apply
the
recommendations,
we
simply
click
execute
recommendations
and
lets
the
cevio
adjust
the
resources
for
our
application.
A
Thank
you
for
attending
today's
webinar.
Are
you
ready
to
give
cecibia
a
try
for
free,
follow
the
link
on
the
screen
to
try
to
save
your
premium
free
for
four
weeks?
There's
no
need
to
speak
to
any
sales
rep
or
enter
any
form
of
payment.
After
the
four
week
periods,
the
civio
will
automatically
convert
back
to
the
civio
Community
Edition,
which
is
free
forever.
You
have
nothing
to
lose
to
try
it
out.
If
you
have
any
questions
or
comments,
please
feel
free
to
contact
me
at
Stephen
sociv.io,
thanks
for
watching.