►
Description
Krius is a CLI tool to set up and manage Prometheus, Thanos & friends across multiple clusters easily for scale.
A
A
B
At
the
pre-sales
and
growth
part
of
the
company,
along
with
the
general
project
execution,
let's
talk
briefly
about
the
agenda
for
today,
let's
discuss
the
pro
the
reason
why
we
built
careers
in
the
first
place.
What
were
the
factors
that
drove
us
to
write
a
utility
like
3s,
which
can
set
up
an
observability
stack
in
a
multi-cluster
fashion
in
an
easier
manner?
I
will
talk
briefly
about
the
solution.
That
Chris
is
a
brief.
B
Topology
of
you
can
showcase
a
brief
brief
topology
that
can
be
set
up
using
careers,
and
then
yachika
will
run
you
through
a
demonstration
of
careers
and
how
do
you
use
it
so
on
and
so
forth.
So
moving
on
the
state
of
monitoring
today
and
some
Salient
points
which
actually
drove
us
to
write
something
like
Chris
in
our
experience
talking
to
our
customers,
they
are
help.
They
are
moving
towards
offering
their
products
as
a
service
to
their
end.
Customers
right
so
essentially,
sassification
programs
were
existing.
B
Customers
need
to
follow
tenancy
and
isolation
requirements
in
any
case
right
and
the
metric
data
that
you
observe
for
your
applications
is
no
different.
That
needs
to
be
isolated.
That
needs
to
be
well
preserved
for
a
longer
duration,
so
that
you
can
run
analytics.
You
can
identify
patterns.
You
can
reduce
alert
fatigue.
You
can
start
drilling
down
into
monitoring
what
really
matters
and
constantly
iterate
and
get
better
at
looking
at
what
signals
you
can
observe
so
that
you
are
proactive
right
with
this
in
mind.
B
I
think
companies
with
a
complicated
deployment
topology
such
as
this
and
tenancy
and
isolation
requirements
and
the
high
availability
requirements
that
come
along
with
it.
Companies
are
increasingly
finding
the
need
to
adopt
Monitoring
Solutions
such
as
Thanos,
cortex,
Victoria,
metrics,
so
on
and
so
forth.
Right,
and
that
is
exactly
what
creas
allows
you
to
do.
It
allows
you
to
bootstrap
these
highly
available
Monitoring
Solutions,
which
are
purpose
built
and
modular
in
nature,
which
can
run
across
multiple
clusters.
B
A
Yeah,
thank
you
Rishi.
So
Chris
is
a
CLI
tool
to
easily
install
your
observability
stack
on
multiple
clusters,
as
I
mentioned
right
and
so
far
we
have
added
support
for
from
ethias
and
Thanos
using
Chris.
You
don't
have
to
worry
about
wiring
all
these
components
together.
You
just
use
the
create
CLI
tool
to
install
to
generate
a
spec
file,
which
is
a
single
source
of
Truth
on
which
crease
depends,
and
then
you
just
apply
it
now.
A
What
that
config
file
is
it's
a
it's
just
a
declarative
file
like
any
declarative
file
in
kubernetes.
So,
for
example,
like
a
pod
where
you
mentioned
like
this,
this
kind
of
setup-
or
this
is
a
template
for
that
pod,
where
you
need
this
image
or
container
and
stuff.
You
just
mentioned
these
kind
of
statements
in
your
config
file,
where
you
mentioned
that
this
stack
like
Prometheus
or
Thanos,
is
needed
in
cluster
one
or
cluster
2
or
cluster.
A
Three
clusters
are
just
kubernetes
clusters,
and
then
you
just
apply
that
spec
file
using
crease,
so
it
is
Korea's
responsibility
to
bring
that
expected
change
into
a
desired
distinct.
Now
you
can
generate
any
complicated
deployment
topologies
using
Chris
I'll
show
you
a
sample
deployment
topology,
which
is
this.
Where
you
can
see
there
are
multiple
kubernetes
clusters
is
running
over
them.
A
It's
a
federation
kind
of
system
where
multiple
prometheuses
are
remote,
writing
to
Thanos
or
Thanos
is
scraping
metrics
from
Prometheus
using
the
Thanos
sidecar
running
along
with
Prometheus
in
multiple
clusters.
Now
you
can
observe
all
the
all
of
these
metrics
for
your
applications
in
Thanos
querier,
which
is
right
here
in
the
left
side
of
the
box,
and
you
can
visualize
all
of
your
metrics
in
grafana
dashboard.
Also
by
adding
that
query
store.
Query
query
as
a
store
or
the
end
point
of
that
query
or
in
your
grafara,
oh
dashboards.
A
You
can
also
be
all
of
your
metrics
in
query
or
front
end.
There
is
a
component
called
query
front,
end
or
queryer
itself
also
and
to
achieve
a
long-term
storage
capabilities.
There
is
a
object,
storage
also,
which
is
in
the
right
side
of
the
screen,
where
Prometheus
and
Thanos
all
of
them
are
posting
metrics
to
achieve
long-term
storage
capabilities
using
any
S3
gcp
or
is
your
blob
storage
or
we
can
even
use
local
Min
iOS
setup.
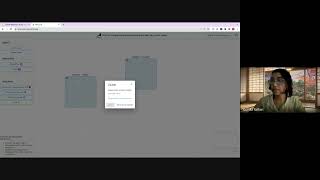
A
A
Now,
on
top
of
create
CLI,
we
have
built
Chris
UI,
which
is
a
tool
which
is
a
UI
tool
to
design
or
create
your
monitoring
deployment.
Topologies,
you
can
add
multiple
clusters
on
the
left
side
of
the
screen
you
can
see.
There
are
multiple
draggable
components.
You
can
drag
all
these
components
to
the
canvas
and
put
it
inside
the
Clusters
configure
them
attach
them
and
then
add
some
object,
storages
and
then
download
the
export,
the
values
and
apply
it.
This
UI
tool
is
highly
extensible
or
highly
customizable.
A
A
A
Yeah,
so
this
is
a
page
I'll.
This
is
a
product
tour
which
we
are
getting
here.
I'll
just
walk
you
through
it.
You
can
see,
you
can
add
a
pretty
big
template
over
here
and
then
you
can
also
build
your
deployment
apology
from
scratch.
By
dragging
these
components
and
then
I'll
as
I
mentioned,
I'll
create
a
deployment
topology.
A
If
you
put
it
outside
the
cluster,
it
says
just
put
me
inside
a
cluster
because
it's
of
no
use
putting
it
outside
a
thinner
or
a
cluster
and
then
I'll
also
need
object.
Storage,
I'll
use
a
AWS,
S3
I'll
name
it
something
like
my
AWS
bucket
I'll,
not
fill
on
I'll
fill
in
these
details.
As
of
now
I'll
configure
Prometheus
server.
A
Oh
I
have
to
answer
these
few
questions
that
if
I
need
a
fresh
installation,
yes
or
no,
no
means
there's
already
a
Prometheus
server
running
and
we
just
add
thano
sidecar
along
with
Romiti
server
and
then
I'll
name
it
something
resistance
to
a
sample
name.
You
can
give
it
anything.
Namespace
I
want
everything
in
monitoring
namespace.
If
any,
if
I
need
a
sidecar
or
a
receiver
mode,
sidecar
mode
is
where
Prometheus
Prometheus
server
will
have
a
sidecar
Thanos
sidecar
running
alongside
it,
and
then
it
will.
The
Prometheus.
A
The
Thanos
server
will
scrape
metrics
from
that
Sidecar.
So
I
am
designing
a
sidecar,
topology
I'll
just
say
a
sidecar
and
if
you
notice
there's
a
sidecar
is
added
with
this
Prometheus
server.
I'll,
add
same
kind
of
things,
for
my
other
I
mean
he's
running
in
another
cluster
too,
in
same
namespace
and
then
Sidecar.
A
I'll
I
will
connect
Prometheus
with
Thanos,
and
this
also
because
Thanos
needs
to
access
the
Prometheus
server
and
then
to
achieve
long-term
storage
capabilities.
I'll
connect,
Prometheus
server
to
AWS
S3,
also
because
the
sidecar
will
add
these
metrics
to
this
bucket
and
then
server
also
need
access
to
S3,
because
there
is
a
store
Gateway
in
front
of
a
queryer
to
query
these
long
term
stored
metrics.
A
Now
the
deployment
apology
is
ready
and
then
what
we
can
do
is
we
just
export
these
values?
We
got
these
values
based
on
the
questions
or
whatever
we
have
create
designed
with
which
says
is
there
are
three
clusters
cluster
one
cluster
two
and
cluster
3
and
cluster
ones
type
is
Prometheus,
and
then
it
says
that
installation,
yes,
we
have
to
do
the
new
installation.
A
Name
is
Prometheus
namespace
mode
which
is
Sidecar
and
then
the
object
store
config,
which
is
this
Prometheus
server
is
connected
to,
and
then
cluster
2,
which
is
also
Prometheus,
and
then
there's
a
cluster
33,
which
is
of
type
Thanos
and
and
some
values
of
those
of
the
of
Thanos.
And
then
in
the
end,
we
have
this
object,
storage,
config
list.
A
We
can
add
multiple
object
strowers
here,
but
as
of
now,
we
have
only
S3
and
then
there's
this
name
unique
name
for
all
the
object
store,
and
this
name
I'm,
referring
here
in
my
monitoring
components
right
so
I
wanted
to
show
this.
Also,
we
can
add
a
pre-baked
template
also
which
has
receiver
or
sidecar
mode.
We
designed
the
sidecar
mode
I'll
show
you
a
receiver
mode
also.
This
is
not
very
different
than
that,
but
the
value
is
different.
A
Where
it
has
this
receiver
config,
also
where
this
Thanos
Prometheus
server
is
remote
writing
to
Thanos
server.
There
is
no
sidecar
running
thano
server
is
not
scraping
the
matrix
it's
it's
Prometheus,
which
is
remote
writing
using
the
remote
right
apis
to
the
Nano
server,
but
it
has
all
the
same
object,
long-term
storage
capabilities
and
Thanos
server,
and
all
these
things
right,
I
I
can
even
show
you
the
values
which
is
pretty
much
same
by
adding
a
pre-bake
template.
You
will
get
a
template
and
then
some
pre-populated
values
also.
A
I'll
show
you
to
apply
how
to
apply
this
config
file
I
already
applied
it
because
it
takes
some
time
so
I
applied
it
before
starting
the
demo.
You
just
run
careers
pick
apply
config
file
in
the
config
file
name.
What
it
does
is
it
validates
the
yaml
file
run.
Preflight
error
checks
in
all
of
your
clusters,
which
says
that
it's
according
to
the
schema
or
not,
you
cannot
add
any
extra
value
in
your
spec
file
because
it
done
it.
A
It
runs
all
the
schema,
checking
and
stuff,
and
then
it
it
it
installed.
Prometheus
and
Thanos
whatever
is
written
inside,
though
clusters
will
verify
that
all
the
boards
print
running
state
and
yes,
I'll,
show
you
oh
I'll,
put
forward
this
tunnel
Square
here.
Service
and
I'll
show
you
the
metrics
from
multiple
room
atheists.
A
A
Oh,
it's
35
97,
74
and
62.
yeah,
so
both
the
Clusters
Prometheus,
one
and
Promises
to
are
sending
metrics,
are
accessible
to
queryer
and
then
I
can
run
a
sample
metric
show
you
some
Matrix
so
yeah
these
are
the
metrics
coming
you
can
see
there
are
these
nodes
are
from
cluster
one
and
few
nodes
are
from
cluster
two
and
all
the
metrics
are
coming
from
multiple
clusters:
yeah
anything
Rishi.
You
want
to
add
here
about
crease,
UI
or
config
file.
Anything.
B
Yeah
so
I
think
the
general
idea
or
the
general
user
experience
that
we
will
create
within
mind,
which
is
by
the
way
covered,
was
that
you,
you
model
your
deployment,
topology
of
your
observability
stack,
be
it
a
receiver
mode
or
a
sidecar,
or
a
hybrid
of
both
of
them,
along
with
long
term
storage,
so
on
and
so
forth,
and
configure
that
entirely
and
you
get
a
single
source
of
Truth,
which
is
the
ml
schema.
That
yachika
did
walk
you
through
right
now.
B
The
yaml
schema
is
basically
a
subset
of
all
the
configuration
values
that
Thanos
or
Prometheus
by
themselves.
Allow
you
to
configure
the
reason
for
that
is
because
we
felt
that
these
are
the
values
that
we
most
Tinker
around
with
when
we
are
wiring,
these
multi-cluster
sort
of
Prometheus
Thanos
their
endpoints,
the
side,
current
Point
exposed
to
the
queryer,
the
store
Gateway
the
front
end,
and
there
are
several
components
that
you
have
to
sort
of
configure
right
as
we
move
along.
B
We
will
start
adding
more
and
more
configuration
options
in
the
yaml
specification,
anyways
right
and
you
can
create
any
sort
of
topology
out
of
the
crease
UI.
At
the
end
of
the
day,
you
should
be
able
to
export
these
values
out
which
serves
as
a
single
source
of
Truth,
so
that
you
know
what
is
deployed
in
production.
B
When
you
actually
apply
that
spec
and
the
entire
orchestration
happens
through
careers
right,
we
would
eventually
be
adding
more
and
more
features,
so
we
adopt
a
githubs
pattern
for
the
single
source
of
Truth
or
the
yaml
that
you
have
specified
so
that
we
could
keep
reconciling
on
that
and
so
on
and
so
forth.
But
we
encourage
anybody
and
everybody
to
sort
of
this
is
a
completely
open
source.
Tool
you'll
find
it
in
the
infra
Cloud
GitHub
organization,
with
the
careers
with
careers.
A
B
A
Thank
you
so
much
yes,
so
this
was
the
demo
part.
We
get
aggregated
view
for
all
of
your
clusters
for
all
of
your
Prometheus
running
on
multiple
clusters,
and
that
was
it
please
check
out
Chris
repo,
it's
here,
github.com.io
Chris
and
we
have
also
written
a
published
a
blog
post.
Please
go
through
it.
Try
using
it
report
issues
yeah
thank.