►
Description
No description was provided for this meeting.
If this is YOUR meeting, an easy way to fix this is to add a description to your video, wherever mtngs.io found it (probably YouTube).
A
Before
proceeding
further,
let
me
take
a
moment
to
mention
Capital
one's
commitment
to
the
open
source.
Community
Capital
One
made
an
open
source
first
declaration
in
2014
and
that's
when
we
made
our
first
contributions
to
the
open
source
Community.
We
sponsored
Pinos
python,
continuous
delivery
and
the
cloud
native
Computing
foundations
to
help
keep
open
source.
Sustainable
Capital
one's
contributions
to
the
open
source.
Community
have
been
significant
and
we
have
released
more
than
40
of
our
own
software
projects.
A
B
Our
platform
runs
ML
and
data
processing
pipelines
at
scale
on
kubernetes.
We
seek
to
make
it
easy
to
run
out
of
the
box
analytics
on
the
desired
data
sets
in
a
standardized
secure
manner.
In
this
talk,
we're
going
to
cover
our
journey
in
using
kubernetes
cover
some
of
the
foundational
processes,
design,
considerations
and
pepper
in
some
examples
of
incidents
to
elucidate.
While
getting
these
patterns
right
is
crucial.
Now,
before
we
dive
deep
on
any
one
area
on
the
agenda,
it's
important
we
level
set
on
what
are
requirements
in
high
level
architecture.
Look
like.
B
As
for
requirements,
we
need
a
one
to
be
able
to
run
batch
jobs
on
demand
that
connects
to
end
users,
data
stores,
two.
We
need
to
be
able
to
enable
non-technical
users
to
configure
and
launch
these
jobs
via
a
UI
and
three.
We
need
to
enable
lease
privilege,
flexible
data
access
now
as
a
large
organization,
it's
important
that
we
adopt
a
multi-tenant
architecture
in
order
to
help
ensure
lease
privileged
data
access.
We
wouldn't
want
people
to
be
able
to
access
data
they
shouldn't
be
able
to.
B
You
know
one
of
those
important
requirements
for
this
platform.
Is
that
not
not?
Everyone
is
going
to
be
an
engineer
with
direct
system
access
to
our
cluster.
Rather,
we
need
to
be
able
to
serve
users
via
UI.
In
addition
to
API
Services
accomplishing
the
above.
Provisioning
of
a
job
is
not
as
simple
as
having
someone
run
a
coupe
cuddle
apply,
regardless
of
where
the
user
Journey
starts.
We
must
ensure
the
same
properties
of
compute,
Network
and
data
isolation.
B
Now,
in
this
diagram,
we
have
somewhat
of
a
stripped
down
basic
version
of
what
our
system
does
as
a
given
to
this
presentation,
we're
running
on
a
kubernetes
cluster
more
on
that
later
and
like
any
platform,
we
have
apis
uis
databases
and,
most
importantly,
our
platform
does
something
of
hopefully
value
to
the
end
user.
In
this
case
running
some
standardized
analytics
jobs.
B
Now
what
the
jobs
do
for
this
presentation
doesn't
matter
all
that
much
other
than
the
fact
they
might
require
a
customized
networking,
but
these
jobs
need
to
be
able
to
connect
to
the
end
user's
desired
data
sets,
as
we
see
here
on
the
right.
So
a
huge
part
of
this
platform
is
running
a
reliable
kubernetes
cluster.
How
do
you
upgrade
across
your
production?
Well,
production
configuration
meets
the
requirements
for
your
Enterprise.
What
add-ons
are
necessary
for
the
operation
of
your
platform?
These
aren't
easy
questions.
B
We
have
a
central
SRE
team,
whose
responsibility
is
to
provide
platform
teams
like
ourselves
the
automation
tools
to
provision
and
manage
a
production
grade
cluster.
This
is
the
Bedrock
on
which
our
platform
is
built
upon.
Without
it,
we
cannot
securely
or
reliably
do
any
of
the
fun
things
like
running
thousands
of
Pipelines.
B
It
is
important
to
mention
that
a
central
SRE
team
does
not
mean
we
run
all
kubernetes
workloads
at
Capital,
One
on
One,
big
old
cluster,
rather
for
large
organizations
where
you
may
have
many
complex
platforms
that
is
not
advisable
to
share
clusters
across
platforms
needs.
May
differ
much
lower
in
the
stack
making
coordination
of
releases
thorny,
to
say
the
least.
B
This
Hub
and
spoke
model
provides
the
best
of
both
worlds
of
a
central
team
of
experts
and
the
right
size
scope,
limited
clusters
with
more
predictable
Behavior
now
on
to
the
next
layer
in
our
architecture,
this
is
a
big
one,
our
platform
apis.
It
is
conceivably
the
entry
point
for
all
user
interactions
on
the
system.
An
entire
talk
can
be
dedicated
just
to
how
to
build
multi-tenants
offers
of
service
applications.
But
that's
not
the
purview
of
this
talk
rather
what's
important
about
our
platform.
B
Apis
is
how
they
interact
with
our
cluster
and
the
layers
below
it.
When
building
a
multi-tenant
system
like
this
you're,
always
faced
with
the
question
of
whether
you
want
to
provision
a
copy
of
your
stack
per
tenant
or
utilize,
a
shared
service
model,
what
does
that
mean
in
terms
of
terms
of
kubernetes?
B
If
you
have
a
platform
API
that
needs
to
create
jobs
on
behalf
of
users?
Is
it
better
to
have
a
single
service
that
has
permissions
to
deploy
jobs
for
all
users,
perhaps
across
many
namespaces?
Or
is
it
preferable
to
have
a
deployment
of
your
service
for
each
tenant,
where
the
permissions
of
each
API
is
specific
to
each
tenant?
B
B
Regardless
of
whether
you
have
more
of
a
single
tenant
model
for
your
services
or
a
shared
multi-tenant
model,
we
still
need
to
manage
resources
on
behalf
of
our
users,
which
leads
us
to
the
next
part
of
our
architecture.
Next
slide,
please,
the
primary
function
of
this
layer
is
to
maintain
and
manage
the
specifications
of
resources
for
your
users.
B
The
API
is
not
much
different
in
responsibility
from
your
SRE
job
function,
maintaining
say,
Helm
charts
for
deployment.
The
engineer
must
maintain
and
upgrade
the
deployment
when
appropriate,
deprecate
it
when
it's
time
and
have
a
disaster
plan
in
place
for
when
the
service
or
cluster
goes
down.
Only
in
this
instance,
instead
of
an
engineer
committing
code
to
Version,
Control
and
kicking
off
builds,
all
of
this
management
has
to
be
codified
and
automated
as
to
be
repeatable
arbitrarily
many
times,
which
leads
us
to
this
layer.
B
The
tenant
sandbox
for
our
example
platform
we're
running
jobs
for
our
users.
We
want
to
limit
what
these
jobs
are
capable
of
doing
as
we
laid
out
in
our
initial
requirements.
We
want
a
minimal
Network
surface,
a
limited
set
of
capabilities,
permissions
and
available
resources
as
to
avoid
any
one
tenant,
causing
problems,
or
maybe
even
snooping
where
they
should.
One
of
the
primary
functions
of
the
outer
platform
apis
is
to
automate
the
provisioning
of
the
sandbox
whenever
a
new
tenant
signs
up
for
the
platform,
and
if
we
manage
the
environment.
B
Well,
then
the
next
part
should
be
simple
enough.
We
get
to
run
our
meaningful
workloads
for
our
users
when
indirectly
opening
up
what
can
run
on
your
cluster
to
a
large
number
of
people
of
varying
skills
and
backgrounds.
Problems
at
this
layer
are
bound
to
arise
in
this
presentation,
we're
going
to
cover
techniques
to
catch
problems
as
they
arise
and
avoid
classes
of
errors,
and
with
that
I'm
going
to
hand
it
over
to
Christian.
C
Thank
you,
David
all
right,
so
I'll
talk
to
you
about
how
to
go
about
updating
your
cluster,
though
it
can
feel
a
more
mundane
and
routine
part
of
your
deployment
process
than
say
your
platform
deployments.
Cluster
upgrades
require
equal
presentation,
preparation
and
attention
to
detail.
Your
cluster
is
the
foundation
upon
which
your
platform
is
built
and
therefore
can
have
and
lead
to
unintended
consequences
when
that
Foundation
changes
unexpectedly.
C
Such
a
plan
is
equally
important,
whether
you
own
your
cluster
scripts
or
if
they
come
pre-packaged
for
your
use,
like
in
our
case
and
a
good
cluster
plan,
includes
the
following
steps:
first,
listen
for
upcoming
cluster,
upgrade
dates
or
deadlines
and
prepare
your
team
to
have
a
resource
or
resources
on
standby
for
potential
failures,
rollbacks
or
hotfixes.
Ideally,
these
support
resources
have
been
set
aside
already
as
part
of
standard
a
standard
support
rotation
and
have
been
prepared
with
this
action
plan
in
advance.
C
Second,
make
sure
you
review
the
change
log
and
any
relevant
documentation
for
the
upcoming
upgrade
and
identify
known
breaking
changes
and
suspected
points
of
failure.
Third
prepare
for
the
upgrade
if
you
have
identified
definite
breaking
changes,
make
a
plan
to
implement
the
necessary
changes
before
the
update
deadline.
It's
important
to
review
upcoming
changes
well
enough
in
advance
to
make
these
preparations.
C
Second,
if
you
suspect
any
changes
might
be
problematic
or
cause
failures,
ensure
your
tests
and
monitors
and
alerts
cover
those
potential
points
of
failure,
so
that
they
can
be
quickly
identified
post,
upgrade
four
test,
monitor
and
alert
for
regressions
during
and
after
the
cluster
upgrade
ensure
that
your
entire
test
Suite
is
run,
including
integration
tests,
end-to-end
tests
and
performance
tests.
These
are
powerful
Tools
in
identifying
regressions
quickly.
No
test
Suite
is
a
complete
picture.
C
However,
so
it's
equally
important
to
monitor
your
logs
performance,
metrics
and
application
Health
wherever
possible,
using
whatever
tools
are
in
Your
Arsenal
five.
After
the
upgrade
conclude,
there
are
no
regressions
introduced
into
your
platform
and
you
can
safely
sign
off
on
the
cluster
upgrade
as
a
success
in
the
current
environment.
C
However,
if
regressions
have
been
discovered,
ensure
you
communicate
your
Discovery
and
determine
whether
you
need
to
roll
back
and
deploy
a
fix
only
after
a
successful
assessment
of
your
current
environment.
Should
you
elevate
your
cluster
upgrade
to
your
next
higher
environment,
6.
performing
the
elevation?
It
is
crucial
that
any
change
to
your
cluster
or
your
platform
that
will
ultimately
end
up
in
production
begins
in
your
lowest
possible
environment.
Only
after
explicit
approval
in
a
lower
environment
should
any
deployment
be
elevated
to
the
next
level.
C
C
These
higher
error
rates
were
not
caught
by
our
alerts,
nor
did
we
have
sufficient
monitoring
dashboards
in
place
to
help
identify
its
source
of
these
failures
after
triaging
and
assigning
a
lead
to
this
issue,
as
well
as
informing
stakeholders
and
clients
about
this
issue.
We
began
investigation
due
to
our
lack
of
foresight
to
plan
for
issues
like
this.
This
investigation
did
in
fact
have
to
be
done
manually
and
touched
many
aspects
of
our
ecosystem
that
many
of
us
were
only
tangentially
familiar
with.
C
Unfortunately,
after
concluding,
a
regression
was
not
introduced
within
our
platform
code.
Our
team
struggled
to
identify
the
source
of
these
errors,
let
alone
the
root
cause
or
solution,
and
all
that
we
could
conclude
was
that,
due
to
the
nature
of
our
HTTP
error
codes,
we
were
seeing.
Network
traffic
was
severed
somewhere
along
the
way,
though
after
some
thorough
investigation.
We
discovered
logs
from
our
Ingress
controller,
which
pointed
to
it
as
our
source
of
failure.
C
Further
Network
testing
on
the
Ingress
controller
confirmed
a
high
rate
of
connectivity
problems
between
it
and
our
server
pods.
Further
investigation
along
our
Network,
along
with
our
Network
administrators,
revealed
an
undocumented
regression
in
our
cni
plug-in
psyllium,
which
was
blocking
internode
traffic
for
pods
attached
to
certain
outdated
Network
policy
definitions.
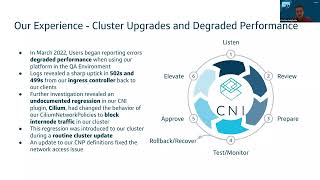
C
The
this
trial
by
fire
introduced
our
team
to
aspects
of
our
platform
ecosystem
which
were
previously
unfamiliar
and
revealed
to
us
many
new
potential
points
of
failure,
worth
testing
and
monitoring.
For
example,
the
image
on
the
right
summarizes
all
the
Hops
skips
and
jumps
our
Network
takes
our
Network
traffic
takes
to
get
from
our
client
to
our
server
and
Back
Again.
As
we
locked
a
Consolidated
view
of
our
system,
we
had
to
start
at
both
ends
of
this
flow
and
test
and
inspect
each
stage
for
network
issues
manually.
C
C
Since
then,
we
have
since
made
efforts
to
consolidate
our
logs
from
each
stage
into
a
dashboard
on
Splunk,
as
well
as
monitor
each
stage
for
health
and
performance
metrics
using
tools
such
as
New,
Relic
and
cloudwatch.
We've
also
revitalized
our
knowledge
transfer
sessions
to
teach
our
team
about
the
various
supporting
actors
in
our
overall
platform
ecosystem.
C
So,
let's
analyze
our
experience
with
this
particular
cluster
upgrade
what
went
right.
What
went
wrong?
How
could
we
have
improved
our
experience
with
a
proper
action
plan
like
we
described
earlier,
starting
with
the
positives
to
ensure
customer
questions
and
issues
were
promptly
addressed?
We
have
built
a
multi-layered
support
system
and
this
support
system
worked
as
intended
in
the
resolution
of
the
issue.
C
Additionally,
despite
our
setbacks,
we
were
able
to
identify
the
root
cause
of
failures
and
iterate
quickly
to
deploy
the
fix
and
before
the
cluster
hit
our
production
environment.
We
were
able
to
resolve
the
issue
and
continue
as
normal.
However,
despite
our
quick
turnaround
on
this
particular
issue,
we
did
expose
ourselves
as
insufficiently
prepared
for
cluster
upgrades.
In
general,
a
few
glaring
issues
can
be
identified
from
auditing
the
upgrade
process
from
the
perspective
of
a
platform
team.
C
First,
while
we
were
reviewing
the
release
notes
for
perspective,
this
prospective
cluster
upgrade,
we
failed
to
identify
the
psyllium
version,
update
as
a
potential
source
of
failure
correctly.
Identifying
this
risk
would
have
narrowed
our
investigation
significantly
and
since
we
have
taken
care
to
call
out
any
version
upgrades
coming
down
the
pipeline
to
investigate
first
in
case
of
detected
regressions.
C
Second,
our
testing
monitoring
and
alerting
Suites
proved
insufficient
to
notify
us
of
any
failures
outside
of
the
scope
of
our
immediate
platform
components.
We
only
discovered
this
particular
issue
after
being
notified
about
degraded
performance
from
our
clients
and
when
investigating
we
had
to
call
Cobble
together
logs
and
metrics
from
disparate
sources.
A
Consolidated
testing
strategy
and
monitoring
Suite
would
have
identified
this
regression
quickly
and
we've
since
begun,
consolidating
long
streams
into
centralized
dashboards.
C
Third,
before
this
instant
incident,
many
of
our
development
teams
members
had
a
tentative
grasp
at
best
on
some
of
the
systems
in
our
platform
ecosystem
outside
of
our
immediate
platform
components,
a
firm
understanding
of
these
systems
would
have
resulted
in
a
more
confident
and
robust
debug
process.
We've
since
ensured
that
our
team
has
several
smes
of
our
platform
ecosystem
and
Beyond,
and
we
also
do
regular
knowledge
transfers
to
elevate
the
rest
of
the
team
by
addressing
the
above
gaps.
D
Thanks
Christian,
so
turning
now
to
observability
I
think
it's
really
helpful
to
frame
any
discussion
or
any
work
around
observability
in
terms
of
the
target
outcomes,
and
so
for
us.
There
are
really
two
outcomes
that
matter
and
and
all
of
our
observability
work
drives
towards
enabling
these
outcomes.
D
First
is
the
stage
where
you're
actually
waiting
for
your
on-call
engineer
to
detect
that
there's
an
issue
and
so
that
it
can
be
measured
as
the
time
to
detect
and
then
once
the
on-call
engineer
knows
about
the
issue,
there's
another
delay
as
they
figure
out
how
to
restore
the
issue
or
rather
how
to
fix
the
issue.
Is
it
our
issue
to
fix,
and
so
that
diagnostic
process,
we
can
kind
of
capture
as
the
time
to
repair
and
so
by
thinking
about
time
to
restore
in
those
two
categories.
D
It
helps
direct
our
investments
to
the
most
valuable
work,
and
so,
in
the
case
of
alerting
alerting,
is
there
to
help
minimize
that
time
to
detect.
It
helps
us
learn
about
issues
before
our
customers
come
and
report
them
to
us
as
Christian
mentioned
earlier,
and
then
we
have
other
levers
to
pull
to
minimize
the
time
to
repair.
D
So,
specifically,
that's
things
like
having
a
run
book
so
that
some
common,
some
common
remediation
steps
are
easy
and
apparent
to
the
on-call
engineer
and
also
having
very
fine-grained
application,
performance,
monitoring
or
APM,
and
that
also
looks
like
having
distributed
traces
and
even
metrics.
That
can
point
to
very
specific
parts
of
your
stack
so
that
you
can
easily
see
where
the
issue
likely
is,
and
so
by
thinking
about
the
time
to
restore.
In
terms
of
these
two
components.
D
If
you
have
a
situation
where
only
the
experts
know
about
this
one
piece
of
the
ecosystem,
then,
if
that
is
where
the
incident
is
occurring,
then
you
have
to
get
that
expert
on
the
phone.
But
if
you've
done
a
good
job,
instrumenting
the
system
and
centralizing
those
signals
to
be
viewed
in
one
or
a
few
places,
then
suddenly
everyone
can
kind
of
be
an
expert
in.
D
In
that
sense,
we've
we've
really
like
improved
the
team's
ability
to
respond
to
issues
and
to
understand
what's
happening
in
the
system,
and
so
we
can
also
think
about
our
dashboards
as
opportunities
to
sort
of
to
answer.
Some
known
questions
of
some
frequently
asked
questions,
but
even
that
has
limitation,
and
ultimately
we
want
to
have
opportunities
to
ask
any
question
of
the
system
with
logs
that
are
really
rich
with
context
and
traces,
which
also
can
show
the
interdependencies
between
the
system
and
help
us
even
diagnose.
D
System,
as
mentioned
earlier,
because
we're
living
in
this
layered
world,
we
have
a
couple
of
unique
challenges.
So
the
first
one
is
our
shared
responsibility
model.
Our
mlas
team
is
going
to
own
the
compute
infrastructure
and
the
platform
apis
that
ultimately
help
orchestrate
our
work,
our
workers
or
whether
our
workflow
jobs,
that
our
users
are
running,
but
then
the
individual
users,
those
tenants
they
have
their
own
code-
that
they
have
to
attend
to
their
settings.
Certain
resource
specifications,
obviously
the
right,
adding
the
logic
that
could
go
wrong
and
so
oftentimes.
D
Our
users
workloads
is,
we
have
very
short-lived
pods
and
in
some
cases,
the
pods
that
are
most
problematic,
the
ones
that
our
users
want
to
debug
and
dive
into
further.
Those
are
the
pods
that
are
only
living
for
a
few
seconds
if
that
long,
and
so
it
turns
out
that
there
are
several
tools
in
the
observability
in
the
ecosystem
that
rely
on
a
pool
based
mechanism
and
so
we'll
learn
how
that
has
become
problematic
in
some
cases
to
to
sort
of
outline.
D
A
few
of
these
tools
that
are
operating
at
different
layers
in
the
stack
I
think
that
this
this
diagram
is
useful
yet
again
for
illustrating
core
observability
plays
at
each
level.
So
at
the
cluster
level,
we
really
do
rely
on
our
cluster
to
provide
some
of
those
foundational
capabilities
of
collecting
metrics
and
logs
and
traces
and
shipping
those
to
our
tools
of
choice.
D
We've
learned
that
alerting
on
anything
that
our
on-call
engineer
actually
can't
resolve
has
been.
It's
been
really
frustrating
and
it's
been
hard
to
actually
understand
what
issues
are
worth
interrupting
and
and
beginning
to
triage.
And
so
we've
really
just
tried
to
focus
all
of
our
alerting
efforts
on
this
platform.
Api
layer
and
that's
really
helped
over
reduce,
toil
and
reduce
churn
on
the
part
of
the
on-call
engineer
and
then
moving
on
to
the
pla
to
the.
B
D
We
don't
yet
have
metrics
and
traces
and
structured
logs
throughout
those
batch
jobs
that
we're
pursuing
those
those
opportunities
right
now,
as
mentioned
earlier,
there
are
a
couple
of
interesting
considerations
when
you
have
short-lived
pods,
so,
for
instance,
with
Prometheus,
you
might
actually
not
scrape
that
pod
before
the
Pod
dies,
and
so
there
is
a
chance
that
your
pod
metrics
wouldn't
be
presented,
or
they
would
present
be
presented
in
an
incomplete
form
and
then
for
the
observability
and
the
road.
The
instrumentation
of
the
individual
API
calls
using
things
like
open
Telemetry.
D
We
know
that
there's
a
non-zero
performance
impact
to
that
instrumentation
and
so
we're
trying
to
find
ways
to
measure
that
impact
and
quantify
it
and
then
ultimately
give
our
users
an
out
opportunity
to
opt
in
and
maybe
even
control
the
granularity
or
the
the
sampling
rates
so
that
they
can
essentially
make
those
trade-offs
themselves.
And
so
that's
sort
of
the
the
state
of
of
open,
Telemetry
and
and
those
those
more
advanced
mechanisms
of
tracing
within
our
individual
batch
jobs.
D
E
E
This
comes
with
a
seemingly
handy
Cube,
fluent
D
operator
self-described,
as
a
fluent
D
config
manager
with
batteries
included
con
config
validation
no
needs
to
restart
with
sensible
defaults
and
best
practices
built
in
based
on
a
theme
of
verifying
defaults,
as
well
as
the
studies
foreboding
title,
the
question
becomes
which
of
the
defaults
was
not
so
sensible
for
our
environment
and
I.
Ask
that
because
verifying
the
defaults
has
been
a
cause
of
several
logging
pains,
especially
the
default
resource
specifications.
E
To
answer
that
question
we'll
look
at
how
a
log
message
is
built
using
this
pattern,
so
the
log
starts
its
journey
and
the
data
scientist's
job,
hoping
to
tell
the
world
about
the
looming
issue
in
prod,
just
as
all
little
logs
do.
The
log
is
written
to
the
file
system
and
Screen
scraped
by
a
fluency
file
source.
E
Finally,
the
enriched
log
is
sent
to
Splunk
to
be
United
with
its
engineer
by
default,
the
log
router
queries
the
cube
API
every
one
minute,
which
is
time,
which
is
fine
for
long
running
pods
such
as
web
servers
and
the
like.
However,
in
an
environment
with
many
moving
Parts,
which
blogs,
would
you
suppose,
people
are
most
interested
to
find
the
ones
with
errors?
E
E
No
logs
without
labels
are
now
impossible
to
search
for
with
so
many
logs.
In
our
Splunk
index,
we
found
that
logs
without
labels
provide
little
more
value
than
no
logs
at
all.
In
fact,
some
of
the
configurations
users
add
a
sleep
greater
than
a
fluent
D's
refreshing
interval.
Just
to
avoid
this
issue.
Of
course,
another
option
is
to
configure
the
fluent
D
query
to
query
the
cube
API
more
frequently,
but
some
jobs
have
a
sub-second
lifetime,
so
there's
a
limit.
How
often
you
can
do
it?
E
Thus
we're
moving
towards
a
structured
logging
approach
to
remedy
these
missing
logs
by
enabling
the
kubernetes
downward
facing
API
the
pods.
Creating
the
logs
can
also
retrieve
the
kubernetes
metadata
required
to
make
them
searchable,
as
shown
here,
we
can
more
reliably
provide
meaningful
logs
by
entirely
avoiding
the
fallible
enrichment
step.
The
fluent
D
operator
offers,
in
short,
our
logs
themselves,
are
created.
Batteries
included.
E
Also,
as
a
last
note,
when
it
comes
to
logging,
your
logging,
it
is
helpful
to
enable
fluent
D
metrics
in
our
case,
for
me,
dsn's
fluent
dmetrics,
for
the
number
of
errors
in
the
Q
buffer
length
to
New
Relic
for
alerting
this
lets
you
keep
tabs
of
even
the
logs.
You
missed
enough
of
this
use
case,
though
I'm
handing
it
back
to
Christian.
C
Thank
you,
Trevor
I
will
now
be
discussing
how
to
isolate
your
tenants
compute
within
your
cluster
and
your
platform
and
I'll
discuss
how
the
machine
learning
as
a
service
platform
does
so
so
at
its
core.
The
machine
learning
as
a
service
platform
provides
its
clients
known
as
tenants.
The
means
to
author
manage
and
execute
their
data
workflows,
given
the
unique
and
open-ended
functional
capabilities
of
a
workflow.
Each
running
instance
of
said,
workloads
considered
its
own
application,
thus
as
The
Trusted
host
of
such
applications.
C
Therefore,
machine
learning,
as
a
service
platform
uses
kubernetes
namespaces
to
implement
a
multi-tenancy
model
for
compute
isolation
as
namespaces
provide
a
means
to
house
or
isolate
groups
of
resources
within
a
cluster.
In
this
use
case,
namespaces
are
used
to
house
tenants,
running
workflows.
Every
tenant
has
their
own
namespace
and
tenant
workloads
run
in
their
designated
namespace.
Only
isolating
tenants
to
their
own
namespace
allows
us
to
administer
tenants
individually
with
their
own
configurations
limits
and
permissions.
C
Primarily,
we
use
namespaces
to
ensure
lease
privilege
access
and
to
manage
resources
on
a
tenant
level,
for
example
using
network
policies
and
role-based
access
control.
We
can
configure
least
privileged
Network
and
resource
permissions
respectively,
allowing
us
to
limit
which
services
our
tenants,
workflows
can
communicate
with
and
which
resources
they
can
modify.
C
C
Now
namespaces
are
a
powerful
tool
for
administrating
and
organizing
your
tenants
in
your
platform,
but
in
practice
you're
going
to
run
into
some
overhead
when
it
comes
to
configuring
and
deploying
said
namespaces.
The
primary
consideration
to
tackle
when
administering
name
spaces
is
determining
the
minimum
permissions
needed
by
the
fewest
entities
to
meet
your
namespace
Administration
requirements.
C
In
this
case,
the
custom
resource
would
consist
of
potentially
a
single
definition
file
which
wraps
a
definition
of
a
namespace
and
any
additional
resources
which
live
within
that
namespace.
The
operator
would
then
manage
the
deployment
and
maintenance
of
this
custom
resource
and
therefore
the
namespace
and
objects
defined
within
it.
C
If
you
choose
to
follow
this
pattern,
consider
the
following:
when
choosing
a
namespace
operator
first,
as
these
operators
deal
with
a
critical
cluster
scoped
resource
and
therefore
can
have
a
cluster-wide
impact
in
case
of
failure,
discuss
the
permissions
this
operator
needs
and
the
impact
on
existing
name
spaces
in
your
cluster
with
cluster
administrators
and
any
other
applications
on
your
cluster.
Before
deploying
such
an
operator
to
your
cluster
and
second
research,
the
level
of
developer
support
this
operator
has
whether
it's
open,
source
or
in-house.
C
You
should
see
how
frequently
The
Operators
contributed
to
and
whether
it
has
any
critical
outstanding
issues
and
is
repository
and
whether
any
developer
team
exists
to
offer
integration
to
drug
support.
We
had
to
consider
these
items
when
deciding
between
two
such
operators
to
conduct
our
namespace
management
for
our
platform.
These
operators
were
the
hierarchical,
namespace
controller
and
open
source
operator
and
Embark
a
namespace
operator
within
our
organization.
C
In
our
case,
this
Paradigm
would
allow
us
to
create
tenant
name
spaces
as
children
of
our
application's
main
namespace,
to
which
we
would
automatically
propagate
standard
Network
policies,
roles,
role,
bindings
and
other
resources.
Automatically
changes
to
these
resources
and
configuration
items
in
the
application's
namespace
would
then
automatically
reflect
in
the
child
name
space.
C
Our
second
option:
Embark,
is
an
operator
developed
within
our
organization,
which,
alternatively,
defines
and
operates
a
custom
resource
called
a
super
namespace.
This
super
namespace
object,
lets
you
define
namespace
and
any
resources
within
it
like
Network
policies,
roles
and
role
bindings
within
a
single
yaml
file,
deploying
or
modifying
any
of
those
items
can
be
done
by
simply
modifying
the
super
namespace
definition
itself
and
deploying
that
object.
The
operator
handles
the
rest.
C
This
option
would
have
allowed
us
to
configure
all
of
our
attendant
namespaces
from
one
single
standard
template
and
deploy
a
super
namespace
per
tenant,
which
would
thus
deploy
their
namespace
and
all
of
their
resources.
A
promising
option.
Embark
was
only
lacking
one
feature,
and
that
was
the
ability
to
configure
custom
additional
resources
on
a
individual
super
namespace
level.
C
If
we
contributed
to
Embark
to
fill
this
feature,
Gap,
both
operators
from
a
functional
perspective
would
have
provided
a
viable
solution
to
host
our
namespace
management.
However,
after
taking
into
account
the
considerations
mentioned
in
the
previous
slide,
even
with
that
feature,
Gap
Embark
stood
out
to
us
as
our
only
single
viable
option
for
namespace
management.
For
the
following
reasons.
C
First,
the
hierarchical
namespace
controller
lacked
an
official
Helm
chart
to
install
and
maintain
it
on
our
cluster
instead
requiring
installation
through
a
tool
called
crew.
As
crew
is
not
a
supported
tool
in
our
Enterprise
clusters,
we
would
have
had
to
take
the
time
to
create
and
maintain
our
own
Helm
chart
for
this
operator.
C
This
was
the
main
issue
we
had
with
the
project,
and
that
was
that
the
hierarchical
namespace
controller
has
a
very
broad
impact
on
the
rest
of
our
cluster
Beyond.
Just
simply
the
tenant
name
spaces
we
wanted
to
create
using
it
by
default.
The
operator
placed
web
books
on
every
single
namespace
in
a
given
cluster,
which
would
therefore
trigger
admission
controllers
on
upon
any
namespace
modification
that
would
be
for
tenant,
namespaces,
our
platform
namespace
or
any
additional
namespace
that
exists
in
our
cluster
for
other
purposes.
C
We
wanted
to
minimize
the
scope
and
impact
of
any
operator
we
install
in
our
cluster,
and
this
control
over
non-tenant
namespaces
proved
too
big
of
a
risk
for
us
to
take
on,
especially
without
a
standard
Helm
chart
for
us
to
install
embark,
on
the
other
hand,
had
no
such
issues,
establishing
no
admission
controllers
or
web
Hooks
and
having
no
impact
on
namespaces,
not
managed
by
the
super
namespace
custom
resource.
In
other
words,
the
only
namespaces
that
Embark
would
have
touched
would
be
those
which
we
were
creating
for
the
purposes
of
our
tenants.
C
Because
of
these
two
reasons,
ultimately,
our
team
chose
Embark
to
manage
our
tenant
namespaces,
and
we
were
confident
in
that
decision,
having
weighed
the
impact
and
level
of
support
for
each
operator.
So
if
you
are
in
this
situation,
in
which
you
want
to
manage,
10
namespaces-
and
you
want
to
offload
this
to
an
operator-
certainly
consider
the
same
things
that
we
considered
for
that
purpose.
I
will
now
hand
this
off
to
Patrick
to
discuss
rate
limiting
and
resource
management.
F
Thanks
Christian,
in
order
to
reduce
the
impact
one
user
can
have
on
the
overall
system
influencing
rate
limiting
per
client
on
our
apis
and
important
stuff
we
can
take.
The
goal
is
to
put
limits
in
place,
so
one
client
cannot
push
the
services
over
and
cause
outages
for
all
other
users
of
the
platform
or
cause
a
response
times
to
fall
beneath
what
is
defined
in
our
SLA.
F
The
biggest
consideration
from
implementing
rate
limiting
is
at
what
layer
of
the
application
stack
to
put
the
limits
in
place.
The
API,
Gateway
Ingress
controllers
and
the
app
layer
were
all
taken
into
consideration
in
their
pros
and
cons
for
weighed.
Not
all
of
our
traffic
goes
through
the
API
Gateway.
Something
between
at
this
layer
would
not
catch
all
traffic,
possibly
leaving
us
exposed
still
we're
limiting
an
Ingress
controller
layer
was
considered.
F
F
Other
Ingress
controllers,
such
as
traffic,
were
explored
but
similar
pitfalls
and
needing
to
add
an
additional
layer
to
architecture
led
to
us,
beginning
looking
at
limiting
on
the
application
layer.
Since
our
API
is
written
in
Python,
we
explored
the
rate
limiting
packages
that
exist
and
found
the
offerings
for
to
be
what
we
were
looking
for.
Asgi
rate,
limiting
is
the
package
we
are
currently
testing
with
its
simple
implementation,
rule-based
rate
limiting
and
custom
authorization
function.
We
found
a
solution
that
is
easy
to
maintain
moving
forward
and
does
not
require
major
architectural
changes.
F
With
the
amount
of
jobs
running
in
our
cluster,
we
have
seen
some
situations
that
required
manual,
cleanup
of
PODS
and
hanging
States
and
other
resources
that
stuck
around
kubernetes
offers
a
TTL.
This
only
applies
to
pods
and
jobs
in
a
finish,
State.
The
kubernetes
D
scheduler
offers
a
way
to
configure
Max
runtime
on
pods.
This
is
just
a
hard
limit
and
could
lead
to
preemptively
terminating
workflows
that
do
not
meet
our
criteria
to
clean
up.
F
This
led
to
a
design
of
a
cleanup,
Nanny
process
deployed
in
our
clusters,
using
kubernetes,
cron
jobs.
We
have
a
job
schedule
that
checks
multiple
criteria,
such
as
logs
of
a
pod,
to
determine
if
a
workflow
is
still
running,
the
job
terminates
resources
in
our
cluster
and
then
issue
status
updates
to
our
database,
if
applicable,
to
reduce
the
load
on
these
cleanup
processes.
We
deploy
a
cleanup,
Crown
job
in
each
of
our
tenant
name
spaces.
This
also
helps
reduce
the
blast
radius.
If
one
cleanup
job
fails
rather
than
one
cleanup
job
handling
the
entire
cluster.
F
This
also
helps
tenants
stay
within
the
resource
quotas.
This
nanny
process
that
handles
jobs
and
pods
has
been
generalized
to
handle
other
parts
of
our
system
as
well.
We
did
face
unintended
consequence
of
this
cleanup
job
where
it
was
actively
hurting
our
cluster's
health.
The
queen
of
trap,
identified,
failed
pods
to
delete.
However,
the
jaw
remained
active
and
it
continued
to
spin
up
failing
pods
as
this
cleanup
job
deleted
pods.
It
was
also
resetting
the
failed
pod
count
for
that
job,
never
letting
the
job
fail.
F
We've
resolved
this
by
not
cleaning
up
the
pods
directly,
but
by
just
letting
the
job
fail
and
cleaning
up
the
job
itself.
The
delete
on
the
job
propagated
to
clean
up
the
respective
pods
cleaning
up
everything
with
the
implementation
of
this
nanny
process
to
clean
up
resources.
In
our
cluster
we
saw
a
saving
of
over
a
million
dollars
in
compute
spend
per
year
now
I'll
handle
back
to
David
to
wrap
up.
B
Awesome
thanks
Ashley
yeah,
so
to
wrap
up
We've
laid
out
the
requirements
for
our
sample
platform,
and
we
took
a
bit
of
a
tour
of
all
of
the
organizational
processes
and
Technical
considerations.
We
found
important
in
building
and
maintaining
this
platform
for
those
building
higher
order
systems
on
top
of
kubernetes.
B
We
really
implore
you
to
spend
time
up
front
toward
establishing
these
types
of
processes
for
maintaining
a
production
production
grade
cluster
and
its
upgrades
having
full
observability
throughout
your
stack,
ensuring
least
privileged
access
and
finally,
when
building
platforms
that
pseudo
extend
the
kubernetes
control
plane
be
mindful
about
what
your
services
actually
exposed
to
your
end
user.
In
part.
Those
safeguards
to
avoid
the
eventual
non-ideal.