►
Description
No description was provided for this meeting.
If this is YOUR meeting, an easy way to fix this is to add a description to your video, wherever mtngs.io found it (probably YouTube).
A
And
that
way
we
will
hopefully
have
a
little
time
at
the
end
hi.
Everyone
thanks
for
joining
us
today
for
cncf's
live
webinar
running,
distributed
load
tests
with
the
grafana
k6
operator,
I'm,
Libby,
Schultz
and
I'll
be
moderating
today's
webinar
I'm
going
to
read
our
code
of
conduct
and
then
hand
over
to
Paul
balog,
developer
Advocate
with
grafana
Labs
a
few
housekeeping
items
before
we
get
started
during
the
webinar.
You
are
not
able
to
talk
as
an
attendee.
A
There
is
a
chat
box
on
the
right
hand,
side
of
your
screen,
please
feel
free
to
drop
your
questions
there
and
we'll
get
to
as
many
as
we
can.
At
the
end.
This
is
an
official
webinar
of
the
cncf
and,
as
such
is
subject
to
the
cncf
code
of
conduct.
Please
do
not
add
anything
to
the
chat
or
questions
that
would
be
in
violation
of
that
code
of
conduct
and
basically,
please
be
respectful
of
all
of
your
fellow
participants
and
presenters.
A
Please
also
note
the
recordings
and
slides
will
be
posted
later
today
to
the
online
programs
page
at
community.cncf.io,
under
online
programs
they're
also
available
via
your
registration
link
and
the
recording
will
be
available
on
our
online
programs.
Youtube
playlist
with
that
I
will
hand
things
over
to
Paul
to
kick
off
today's
presentation.
All.
B
Right
well,
thank
you
very
much
and
welcome
everyone.
Hopefully
you
know
for
me
it's
lunch
time.
So
hopefully
everyone's
already
had
their
launch
and
don't
have
growling
stomachs
to
distract
them
from
all
this
information
that
you're
going
to
be
getting
here
today,
so
but
yeah
so
again.
Thank
you
Libby.
My
name
is
Paul
balog.
I
am
a
developer
Advocate
on
the
k6
open
source
project
with
grafana
Labs.
You
can
contact
me
at
javaducky
on
Twitter
or
I'm
now
also
with
the
same
moniker
on
Mastodon
so
anyway.
B
So
let's
go
ahead
and
we'll
go
ahead
and
get
right
into
this
now
I'm
I'm
on
a
massive
I'm
on
my
my
screen
is
hugely
enlarged,
so
I'm
hoping
that
everybody
will
be
able
to
see
all
the
aspects
of
the
demonstration
fine.
So
hopefully
so
anyway,
if
we
go
ahead
and
start
it
off,
let's
go
ahead
and
start
with.
B
You
know
what
is
k6
now
I
was
at
kubecon
two
weeks
ago
in
Detroit
and
I
was
working,
the
grafana
booth
and
one
of
the
issues
was:
was
that
really
people
don't
know
what
what
it?
What
exactly
is
k-6
or
that
we
were
actually
part
of
grafana
labs,
so
we're
part
of
the
CNC
app.
So
if
you
look
here
on
the
landscape,
that's
that's
us.
In
that
upper
right
hand
corner
there
we're
in
there
we
are
formerly
known
as
load
impact.
We've
been
open
source
since
2016.
B
we
have
about
coming
up
on
19
000,
GitHub
Stars,
so
we've
got
a
couple
likes
out
there
and
we
really
promote
the
whole
shift
left
testing
movement
I
have
our
the
k6
repository
again
we're
fully
open
source
and
we're
always
by
the
way
looking
for
additional
contributors
and
to
help
out
now
with
grafana,
we
were
acquired
in
2021
June
of
2021,
and
we
are
now
under
that
umbrella.
Now,
when
we
were
acquired,
Raj
dot
he's
the
CEO
for
grafana
labs
he
mentioned
about.
You
know
this
was
a
perfect
match.
B
This
was
a
match
made
in
heaven,
I
mean
really
because
you
figure
with
k6
we're
on
the
front
end
we're
trying
to
prevent
and
detect
before
your
production.
Your
you
know
before
your
software
goes
out
to
production
and
with
the
grafana
labs
other.
You
know
the
other
items
in
the
grafana
space
that
gives
you
that
observability
to
be
able
to
view
what's
going
on
on
your
system,
so
we're
going
to
create
the
problems.
Grafana
will
let
you
see
the
problems
now.
This
right
here
is
the
most
important
slide
in
this
entire
deck.
B
B
So
if
you
think
of
reliability
testing
as
just
kind
of
this
umbrella
term,
there's
there's
several
different
types
of
testing
that
are
included
in
that
of
which
load
testing
is
one.
So
you
can
utilize
k6.
As
you
know,
for
contract
testing,
you
can
do
chaos,
testing,
which
that's
a
fun
thing,
always
right
who
who
doesn't
want
to
try
to
break
things
and
see
what
happens?
We
even
have
product
where
you
can
do
browser
testing,
actual
end-to-end
testing.
B
You
know
controlling
a
Chrome
browser
and
you
know
seeing
the
you
know
like
the
the
old
you
know,
the
the
piano
the
automated
automated
piano.
So,
just
a
little
bit
more
about
us,
you
know
patting
ourselves
on
the
back
thought.
Works
had
this
nice
thing
to
say
about
us,
you
know
we
are
we
pride
ourselves
in
being
the
easiest
tool
for
developers,
testers
sres
to
utilize?
That's
that's
big
in
our
DNA
is
that
we
really
want
to
make
sure
that
we're
we
have
a
low
barrier
to
entry.
Now.
B
I
will
just
add
to
this.
It's
not
on
this
slide,
but
thought
works
with
their.
It
was
just
here
in
October,
now
their
latest
radar
we're
actually
moved
into
the
adopt
ring
of
the
tools,
platform
or
platform
quadrant,
so
kudos
to
the
ks
k6
developer
team.
So
again
you
know
reliability
testing.
So
our
big
thing
is
again
that
we
are
open
source
and
we
are
very
much
into
the
whole
open
source
concept.
We
want
to
promote
that.
B
We
want
to
bring
more
people
in
all
that
good
stuff
so
makes
us
fit
in
perfectly
with
cncf.
So
it's
what
we
do.
You
know
we
wanted
to
make
again
sure
that
our
tools
are
scriptable,
because
again
we
want
to
make
sure
that
we
we
can
be
used
in
automation.
We
want
to
make
sure
that
you
can
use
your
testing
in
your
CI
CD
platform
so
that
you
can
pass
fail
based
on
you
know,
certain
thresholds
that
you
set.
We
are
performance,
so
our
application
is
written
and
go.
B
We
do
interpretive
of
some
JavaScript
test
cases
and
we're
very
extensible.
We
have
a
an
extensions
platform
which
is
actually
what
I
work
with
primarily
or
an
extensions
framework.
I
should
say,
but
we
invite
go
developers
to
join
with
us
and
work
on
expanding
the
capabilities
of
k6
where
they
compiled
in
so
as
new
Protocols
are,
you
know,
thought
up
or
created.
We
can
include
those
and
then
you
can
do
load
testing
with
that
or
I
should
say.
B
Is
the
key,
so
I
kind
of
alluded
to
it
that
you
know
here?
If
we
look
at
this
stack,
the
actual
tests
that
you
create
or
write
are
actually
written
in
JavaScript
now
that
goes
through
an
an
interpreter
that
is
written
and
go
it's
another
open
source
project
called
goja,
and
then
that
will
allow
you
to
utilize
these
k6
extensions,
where
you
can
incorporate
again
different
protocols
and
different
products,
and
then
all
that
is
written
or
I'm.
Sorry,
all
that
is
run
in
the
go
run
time.
B
So
that
was
the
quick
and-
and
you
know
wanting
to
make
sure
that
we
have
the
time
here
so
so
now,
let's
go
ahead
and
go
into
what
is
load
testing
all
right.
So
when
you
go
out
there
and
start
googling
things
and
that
the
internet
will
tell
you
that
load
testing
is
all
about
putting
Demand
on
a
system
and
measuring
its
response.
So
now
again,
this
is
where
we
we
find
ourselves
in
that
whole
shift.
B
Left
area
so
k6
again
we're
we're
at
the
developer
side,
we're
kind
of
at
the
front
end
and
then
you're
going
to
create
some
scenarios.
This.
This
high
demand
and
then
with
the
grafana
stack,
you
can
measure
those
responses
and
make
sure
that
your
systems
are
going
to
be
running
smoothly
after
that
Super
Bowl
ad.
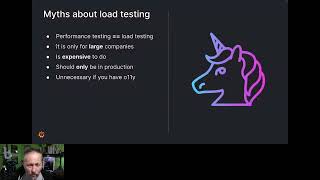
So
now,
if
we
talk
real,
quick,
just
a
quick
mention
about
some
of
the
myths
about
load
testing,
so
typically
you
hear
about
load
testing.
B
You
think
it's
for
you
know
it's
for
large
companies
that
you
know
oh
Mom
and
Pop
Shop
they're
not
going
to
be
able
to
do
anything
with
load
testing.
That's
it's
ridiculous,
but
no!
That
is
not
the
case.
It's
it
and
in
here
as
well,
expensive
to
do
it
doesn't
have
to
be
I
mean.
Obviously
you
can
you
can
recreate
your
entire
production
environment
and
pay
a
lot
of
money
and
test
against
that.
But
you
don't
have
to
you
know
you
don't
have
to
test
just
in
production
test
it
beforehand.
B
You
know
again
like
we
want
to
incorporate
things
into
your
CI
CD
pipeline.
So
you
can.
You
can
run
a
limited
test
or
just
you
know,
on
samples
and
make
sure
things
are
running
as
expected
and
that
they'll
run
at
higher
load
and
now
here
we
have
the
the
regular
old
hockey
stick
chart
here.
So
what
we
want
to
do
with
the
load
testing
is
that
we're
trying
to
find
that
portion
where
you're
you're
gonna
start
scaling
up.
B
You
want
to
find
that
breaking
point
where
all
of
a
sudden,
your
user
experience,
is
going
to
get
worse.
Your
response
times
are
going
to
increase
at
a
certain
point,
so
you
want
to
make
sure
that
you
know
how
to
handle
that
when
it
does
happen
and
with
defining
slos
now
slos
there's
slos
slas
slis.
These
are
all
your
service
level
in
this
case
objectives
with
the
O's.
So
you
want
to
define
those
and
then
you
can
run
your
tests
and
make
sure
that
your
systems
are
operating
within
the
the
expected
thresholds.
B
So
you
want
to
make
sure
with
that
you
can
use
different
types
of
load
tests.
There's
you
know
many
different
types.
So
now,
in
this
case,
I
just
have
four
small
examples.
Very
brief.
Just
you
know
your
typical
one
is
to
just
apply
an
average
load
and
just
see
how
things
behave
over
a
few
minutes.
You
know
a
spike
test
is
a
very
traditional
test.
That's
that's
your.
B
You
know
your
Black
Friday
scenario,
where
your
usage
is
going
to
go
way
up
and
you
just
want
to
make
sure
that
things
are
handled
in
those
spikes.
The
soak
test
now,
in
this
case,
it
may
not
be
able
to
see
that,
but
this
is
a
test
that
you
would
run
actually
for
over
eight
hour
period
or
even
longer.
Actually,
this
is
going
to
be
the
thing
that's
going
to
find
your.
You
know
your
your.
A
B
Memory
leaks
or
maybe
you're
handling,
resources
incorrectly.
You
know
things
aren't
being
returned
to
a
pool.
You
know
a
soak
test
is
where
you're
really
going
to
see
that
over
a
long
period
of
time
and
then
with
the
the
break
point
test.
This
is
where
you
gradually
increase
things
to
find
that
you
know
that
elbow
or
whatever
and
not
the
hockey
stick
where
things
are
just
going
to
fall
off
a
cliff
essentially.
B
So
these
are
the
different
types
of
tests
that
you
can
do
with
k6
now
in
the
implementation.
I
won't
go
into
the
details
on
each
of
these,
but
you
can
you
can
basically
pattern
or
shape
your
activity
using
what
we
call
executors
and
we
have
of
various
types
that
have
different
behaviors
now.
This
is
actually
a
little
snippet
there
on
the
right
side
showing
some
of
the
configuration
for
tests.
So
now
you
can
actually
have
layers
of
testing
going
on,
so
you
can
basically
add
noise
in
the
background
activity.
Noise.
B
In
the
background
of
another
test
that
you're
trying
to
do
in
the
foreground-
and
you
know,
mix
and
match
it's
there's
loads
of
options,
and
you
know
sky's
the
limit
essentially
so
now
all
that
is
the
background
for
what
is
k6
just
on
its
own.
Now,
normally
we
run
these
as
a
binary.
This
is
just
going
to
be
a
single
binary.
You
know
it
could
be
on
a
quality,
Engineers
desktop
they're,
actually
doing
things
directly.
It
could
be
in
your
CI
CD
pipeline.
B
B
So
that's
you
know,
simulating
40
000
different
users
running
through
a
similar.
You
know
it
could
be
an
auth
authentication
flow
or
or
something,
but
all
that
happening
at
a
single
time.
So
with
k6
operator,
you
can
even
expand
that
further
and
distribute
that
load
across
multiple
machines.
So
you
know
four
four
pods
you
could
have.
Maybe
you
know
160
000
virtual
users
simulated
now.
One
of
the
things
that
we
really
like
to
promote
is
that
you
know
you
can
run
it's
not
a.
B
But
this
just
kind
of
shows
demonstrates
what
each
of
the
pods
are
going
to
be
doing
in
that
they'll
they'll
pull
in
their
configuration.
They'll
apply
the
script
options
that
are
on
the
the
test.
Script
that
are
in
the
JavaScript
they'll
apply
the
environment
variables,
and
then
you
know
it's
just
as
if
you
have
four
different
instances
of
the
same
binary
now
again
with
k6
operator.
We
do
some
there's
not
it.
It
splits
up
the
the
actual
number
of
virtual
users
and
how
many
iterations
are
going
to
happen.
B
It's
going
to
split
that
across
how
many
parallel
instances
that
you're,
looking
for
in
your
request,
so
let's
say
check
the
time
here:
okay,
perfect
so,
hopefully,
I
didn't
just
fly
through
that
too
awful
fast,
but,
like
I,
said,
I
wanted
to
make
sure
that
I
had
enough
time
to
really
demonstrate
this
and
go
through
collect
any
questions
that
folks
are
having
and
actually
let
me
take
a
look
at
the
chat.
I've
been
I've,
been
bad.
I
asked
Libby
to
interrupt
me
in
case.
If
any
questions
did
come
up,
so
we.
B
B
So
let
me
go
ahead
and
pull
up
my
IDE
in
this
case
I.
You
know
I'm
kind
of
in
the
go
world,
so
I
have
learned
to
love,
go
land,
so
I
have
my
demo
in
this.
For
now
so
and
there's
some
of
the
some
of
the
tooling
I
have
listed
in
here
as
well,
so
you
you'd
be
able
to
go
through
this,
like
I,
said
line
by
line
and
then
actually
recreate
this
and
just
I
guess
for
a
just
for
a
little
bit
of
the
housekeeping.
B
B
In
here
and
I
do
have
those
prerequisites
listed
as
well,
so
now
I've
already
downloaded
the
the
actual
source
code
for
the
operator
and,
as
I
mentioned
I'm
going
to
be
using
this
Prometheus
output,
and
that
is
not
by
default
in
the
k6
binary.
Normally
it's
just
a
we
just
emit
a
summary
to
the
console
like
I
said.
This
is
typically
run
as
a
binary
on
some
a
single
machine,
and
then
the
output
would
be
just
displayed
directly
there.
So
now,
because
we
are
using
output
to
Prometheus
right
now.
B
We
have
that
as
a
extension,
so
it
does
require
a
custom
compilation,
step
and
again,
that's
totally
dockerized
in
this
example.
So
as
long
as
you
have
docker,
you
should
be
good.
You
can.
You
can
run
all
this.
You
can
build
this
so
and
again
here
in
this
step.
This
is
actually
where
I
would
go
and
pull
down.
I
create
a
custom
image
of
k6.
That
includes
those
that
extra
extension
and
then
I
push
it
up
to
my
own
personal
Docker,
Hub
repository.
B
That's
one
key
is
that
this
has
to
be
k6
has
to
be
embedded
into
an
image
and
that
image
has
to
be
in
something
publicly
accessible,
so
I
I,
guess
I
can
go
ahead
and
run
those
so
I
have
them
already
locally.
So,
but
just
for
demo
I
will
go
ahead
and
run
through
these
steps
again,
and
hopefully
it
doesn't
take
up
too
much
time.
B
All
right,
but
yeah,
so
I'll
go
ahead
and
just
describe
what's
happening
here,
though,
is
that,
with
this
Docker
file,
I'm
using
a
separate
build
stage,
so
I'm
pulling
down
the
source
code
for
the
extension
and
I'm
utilizing
a
utility
that
k6
has
called
xk6,
which
anyone
familiar
with
the
caddy
server,
there's
something
very
similar.
In
fact,
we
originally
started
with
a
fork
of
xcaddy,
but
it's
just
a
way
to
actually
build
a
new
go
binary,
including
these
these
modules.
B
B
B
There
we
go
all
right
and
now
we'll
go
ahead
and
I
have
this
local
image:
okay,
as
long
as
I
didn't
just
destroy
it.
Let's
see,
let
me
switch
over
here
all
right,
all
right,
so
let
me
go
ahead
and
list
about
my
Docker
images,
and
hopefully
this
is
here:
yes,
okay.
So
this
is
the
the
image
that
I
just
built,
we'll
just
say
that
for
cases
of
the
demonstration
so
I
have
this
now
locally
and
now
I
can
go
ahead
in
this
project.
I
have
these
test
scripts.
B
So
if
we
look
here
so
simple.js,
this
is
probably.
This
is
a
very
simple
test
case
and
hopefully
folks
can
read
that
well
enough,
but
here's
where
I'm
defining
our
options.
So
here
I'm
going
to
say
this
test
case
is
going
to
have
10
virtual
users,
so
I'm
going
to
simulate
10
people
doing
this
over
a
duration
of
10
seconds
here,
I'm
going
to
throw
an
exception
or
basically
kill
the
process
or
return
a
non-zero
return
code.
B
From
my
build
to
say,
if
the
rate
does
not
exceed
10
requests
per
second,
then
to
fail
the
tests
now
I'm
not
going
to
exceed
that,
so
we
won't
have
to
worry,
but
the
test
is
going
to
just
hit
this
test
URL
that
we
happen
to
have
on
on
the
k6
website.
So
it's
test
k6.io,
so
I
have
this
script
here,
which
I'm
going
to
run
this
directly
from
my
Docker
image.
B
So
if
I
go
ahead
and
I'm
going
to
run
it
from
this
console
here
hey-
and
this
is
how
normally
things
are
run
on
the
local
machine.
Now
this
will
just
execute
for
10
seconds
here
and
then
we
will
see
the
actual
output
from
the
test.
Okay,
all
right!
This
is
better
here
with
it
wide,
but
yeah
so
we'll
see
that
okay,
in
that
10
seconds,
we
went
ahead
and
we
created
1494
actual
HTTP
requests
against
that
website.
B
We
see
here
that
the
again,
the
virtual
users
we
had
were
10
for
the
duration
of
the
test
and
everything
was
successful.
Let's
see
yeah,
so
we
were
all
good.
We
everything
returned
to
200,
so
we
were.
We
were
fine
with
that
and
we
reached
a
rate
of
148
requests
per
second,
so
that
which
far
exceeds
the
10
in
the
threshold.
B
Now
this
will
just
take
a
moment
here
again,
it'll
be
fully
started
and
then
I
will
use
another
once
this
has
started,
I
will
use
another
awesome
project
called
K9s
to
actually
look
at
our
cluster,
so
you'll
see
here
we
have
some
of
our
containers,
creating
just
for
the
overall
system,
I'll
pop
into
namespaces
here
now,
and
then
we'll
see
that
these
are
our.
We
have
these
name
spaces
available
so
now
for
our
testing
I'm
going
to
go
ahead
and
I'm
going
to
create
a
different,
let's
go
ahead
and
install
the
operator
first.
B
B
And
now
do
this
all
right
pop
into
there
all
right
and
here's
all
these
resources,
so
these
were
actually
just
created.
We
utilize
underneath
the
covers.
Oh
boy,
customize
sorry,
mind
went
for
a
moment
so
customize
to
create
all
your
resources,
and
then
we
push
those
in
so
now.
If
I
go
ahead
and
check
for
the
k6
resource
I,
you
see
that
it
is
actually
showing
there,
but
there
are
no
instances
of
that
resource.
Just
yet
now
think
of
the
resources
actually
in
this
case
as
being
a
trigger
for
a
a
load
test.
B
I
created
My
k6,
Demo
namespace
I'm,
going
to
create
now
a
config
map
which
contains
all
the
test
scripts.
So
now
again,
these
are
different
scripts
for
actual
different
load
tests
that
I've
created
and
have
available
in
the
project.
Again,
when
you
download
this
you'll
get
all
these
and
I'm
going
to
bundle
those
up
into
a
single
config
map,
so
that
config
map
will
just
be
basically
a
repository
now,
ideally
in
normal
use,
you
would
apply
good,
get
Ops
practices,
and
maybe
you
know,
as
scripts
are
altered.
B
So
we
have
that
in
there
now
we'll
see
that
there's
the
namespace
and
now,
if
I
go
into
config
Maps,
we'll
see,
there's
my
test
scripts
and
again.
This
is
just
all
those
different
scripts.
I
could
edit
it
from
here
as
well.
But
you
know,
through
the
git
Ops
thing:
do
it
and
get
that
would
be
better
all
right.
So
now
that
we
have
those
set
up,
let
me
go
back
to
my
cheat
sheet
here.
B
B
So
now,
when
you
do
that,
you'll
want
to
create
obviously
some
API
keys
and
since
you
do
not
want
to
commit
those
in
any
kind
of
you
know,
resources
that
are
in
GitHub,
of
course,
I'm
going
to
have
them
here.
I
have
my
script,
which
I
will
actually
create
some
secrets
to
have
these
environment
variables
set
up
as
config
maps
and
secrets.
B
A
B
And
see
that
they
are
there
created
all
right
so
now
that
we
have
those
set
up,
we
can
go
ahead
and
actually
trigger
a
distributed
load
test.
So
again,
as
I
mentioned,
you
know,
I
ran
that
example
directly
with
the
image
of
a
single
instance.
Now
those
again
that
shows
that
these
these
particular
scripts
that
are
in
here
again
I
didn't
I,
didn't
modify
them.
There
was
no.
B
The
k6
operator
will
run
the
exact
same
test
scripts.
That
I
did
with
the
direct
single
instance.
So
there's
no
modifications
there.
The
only
difference
will
be
that
we
will
use
these
resources
to
actually
determine
how
many
what
our
parallelism
is.
So
in
this
case,
I'm
going
to
go
and
use
this
one
here
to
Output
to
graphana,
Cloud,
okay
and
I'm,
going
to
have
it
here
that
we're
gonna
have
four
four
pods
will
be
created
and
distribute
the
load.
That's
in
that
load
test.
B
Let's
see-
and
here
it
just
points
to
the
config
map,
we're
having
containing
all
the
scripts
and
I'm
going
to
tell
it
to
run
simple
JS.
So
again,
that
was
all
strictly
in
that
config
map
that
I
just
loaded
a
few
minutes
ago.
Arguments
to
the
actual
Kasich
binary
itself
now
here,
I'm,
just
adding
something
in
here
just
to
distinguish
between
the
script:
executions,
so
I'm,
using
this
tag
in
there
to
be
able
to
have
a
you
know,
create
this
custom
label
in
Prometheus
to
say
that
this
is
my
test.
B
Id
everything
is
going
to
have
this
name
of
k6
output,
graphana
Cloud,
that's
just
kind
of
making
things
easier
to
tie
back
I'm,
giving
the
name
of
my
Custom
Image.
So
obviously
you
can
use
this
one,
but
you
wouldn't
be
able
to
modify
it,
not
unless
you
did
some
underhanded
things
and
got
to
my
account.
So
please
don't
no!
But-
and
this
determines
that
the
binary
should
output
to
Prometheus
remote.
B
B
So
now
we'll
start
seeing
that
the
whole
life
cycle
of
the
what
the
operator
is
doing
so
you
know
obviously
with
the
creation
of
the
resource.
Now
it's
going
to
go
in
there
it's
going
to
create
the
initializer
which
is
going
to
inspect
your
script
and
then
it's
going
to
determine
how
many
pods
to
create
and
it
will
actually
spawn
up
another
one.
B
We
should
see
yeah
here
we
go
the
starter,
which
is
going
to
look
at
the
the
script
and
then
determine
say
that
oh
here
in
this
script,
let's
see
here
we're
running
this
simple
one
says:
okay,
we
wanted
to
run
10
virtual
users,
so
this
is
going
to
divvy
up
amongst
the
pods,
the
10
users,
so
one
pod
will
get
two
users.
Another
pod
will
get
two
users
and
then
the
other
two
will
get
three
each.
B
So
we
have
the
the
full
10
virtual
users
are
accounted
for
and
then
each
will
run
four
ten,
the
the
duration
of
10
seconds.
So
obviously
we
see
here
that
that's
that's
already
been
completed
so
now.
If
we
pop
into
this,
we
can
go
ahead
and
look
at
any
one
of
these
at
the
logs
and
then
we'll
see
that
here.
B
A
B
So
now
you
can
also
do
things
too,
where,
if
with
the
grafana
free
Cloud
I
could,
if
I
had
say
what
is
it
grafana
agent
or
oh
prom
tail
is
the
other
project.
I
could
have
had
these
logs
also
going
up
to
Loki,
which
is
our
log
aggregation
Service,
and
then
we
could
see
all
that
output
directly
in
Griffon
as
well,
but
I've
only
done
the
Prometheus,
the
metrics
output.
So
let's
go
ahead
and
pop
over
to
grafana
all
right
and
then
I've
created
a
couple
dashboards.
B
Now
this
is
not
actually
in
the
project
in
the
the
source
code
repository.
But
if
we
look
here
now
we'll
see
that
here
is
that
test
ID
that
I
I
noted
on
there
that's
actually
being
put
as
the
to
the
command
line
of
each
k6.
So
that
way
we
can
pull
into
there
and
then
just
you
know
and
I'll
I'll
be
the
first
to
admit
my
my
grafana
skills
are
lacking.
Grafana
Foo
is
not
my
best.
A
B
A
B
Is
correct?
Yes,
yes,
so
what
I
just
did
here
with
the
the
actually
creating
the
resource?
So
if
you
were
running
in
kubernetes,
obviously
you
could
have
your
CI
CD
pipeline
actually
apply
that
that
resource
to
trigger
the
test.
So
and
then
you
can
have
things
that
are
you
know
into
your
observability
stack,
let's
say
just
in
case:
if
you're
not
using
grafana
or
if
you're
using
you
know
you
could
be
using
datadog,
you
could
be
using
really
anything
else.
Grafana
is
in
the
big
tent.
B
So
we
we
want
to
be
able
to
play
with
everyone
nicely
so
yeah.
You
could
have
things
that
are
checking
into
that
and
checking
the
state.
And
then
you
know
you
can
fail
a
test.
Now,
if
you're
using
the
k6
binary
directly
in
your
CI
CD,
you
can
get
that
non-zero
return
and
then
that
way,
then
you
could
fail
a
build
directly.
B
So
there's
there's
definitely
options
so
now,
but
yeah
so
coming
back
here
in
my
test.
Results
we'll
see
that
overall,
between
the
four
instances
of
the
Pod
we
have
1521
requests.
The
P95
for
those
requests
were
71
milliseconds
and
then
I
can
drill
into
this
and
again,
like
I
said
my
my
grafana
Foo
is
lacking.
So
please
don't
laugh
at
some
of
my
dashboards,
I'm
learning
but
yeah.
So
here's
the
results.
This
is
this
is
digging
into
the
actual
test
run
here
and
I.
B
Think.
Actually
we
need
this
piece
here.
We
can
look
at
this
and
then
we'll
see
all
the
the
request
rate
you
know
as
it
was
running
through,
so
it
kind
of
had
a
little
bit
of
a
ramp
up
in
a
way,
but
the
gray
line
here
is
the
number
of
vus
all
together.
So
again,
this
is
we
had
the
10
virtual
users
simulated
and
then
this
line
yeah
for
the
response
time.
So
it
looks
like
yeah
they're,
60
milliseconds
there.
B
B
B
Unless
you
know,
unless
there
are
certain
restrictions
on
like
hitting
a
you
know,
maybe
a
Ingress
isn't
publicly
accessible
or
you
know
if
you,
if
you
have
things
like
that,
where
maybe
a
special
service
account
or
whatever,
but
but
yeah,
no
there's,
no
real.
No
real
restrictions,
let's
see
went
through
here,
could
allow
you
to
load
test
private
endpoints
yeah
right.
B
B
So
now
the
extensions
ecosystem,
which
again
that's
that's,
what
I
work
more
with
so
I'm
a
developer
background,
and
primarily
in
Java
for
like
25
years
or
whatever,
like
wow,
I'm
old,
but
I've,
been
in
the
go
area
for
the
last
four
years,
roughly
but
anyway,
but
yeah
so
I
work,
primarily
with
go
developers
to
extend
our
to
enhance
the
Integrations
that
we
have
in
our
in
our
extensions.
So
you
can
do
things
like
you
know.
B
You
could
actually
embed
the
git
API
so
that
you
know
from
your
actual
scripts
your
test
scripts.
You
could,
you
could
do
git
commands
in
your
test
script.
So
you
know
if
you
wanted
to
actually
test
git
itself.
You
could
do
that
and
we
do
actually
have
a
repository
out
there
called
xk6
git
if
I'm
recalling
it
correctly.
That
will
let
you
do
that.
I
see
a
mention
there
about
xk6
chaos.
Yes,
that's
very
similar!
B
We
even
have
one
for
xk6
kubernetes,
where
you
can
do
things
from
your
test
script.
You
can
actually
say:
oh
yeah,
yeah
create
a
unique
namespace,
maybe
create
something,
a
random
namespace
to
run
these
things
in
and
install
and
maybe
do
a
update
to
the
config
map
or
things
like
that.
And
then
you
know
you
can
have
chaos
spawn
by
killing.
Pods
randomly
or
you
know,
see
what
happens
so
a
lot
of
stuff
a
lot
of
stuff.
B
Let's
see,
can
k6
tests
against
application
running
outside
of
kubernetes
cluster
and
then
VMS
yeah
again
as
long
as
it
can
hit
the
URLs
that
that's
all
up
for
grabs.
Let's
see
yes,
yeah
yeah
chaos.
There's
we
there's
multiple
things.
K6
chaos
is
actually
a
JavaScript
library
which
has
different
chaos.
Experiments
that
utilize,
the
xk6
kubernetes
extension
to
actually
do
things
directly
with
kubernetes.
B
B
It
also
supports
things
like
you
know,
other
protocols
with
websockets.
Let's
see
what
else
I
mean
there's
even
things
in
there
with
extensions,
where
I
mean
you
can
test,
you
can
load
test
an
SMTP
server.
If
you
really
want
to
so
yeah
it's
it's
a
it's
a
large
ecosystem,
there's
lots
of
options
so
but
yeah.
So
let
me
take
a
look
back
here
and
I.
Think
of
the
questions
of
slowed
down
or
cooled
off
there.
B
So,
okay,
let
me
go
ahead
and
I'm
gonna
run
another
example,
so
this
is
going
to
be
a
little
bit
more
I.
Don't
know
it's
not
a
massive
example.
It's
still
pretty
simple,
but
this
will
try
to
somewhat
describe
a
spike.
So
now
I
mentioned
about
these
executors.
Oh
I,
better
hurry
up
through.
Here
we
have
these
executors.
They
can
Define
different
shapes,
so
in
this
case
I'm
using
ramping
arrival
right
and
what
that
does.
B
So
it's
going
to
go
from
10
to
150
in
a
matter
of
five
seconds
and
then
once
it
reaches
that
level,
it
will
remain
there
at
10
seconds
and
then
I
have
it
start
coming
down
a
little
bit,
but
not
as
sharp
as
what
the
initial
entry
Spike
was.
So
we
can
go
ahead
and
we
can
run
this
script
as
well.
So
now
all
I
have
to
do
is
now
on
this
particular
resource.
So
I
was
outputting
to
grafana
Cloud.
B
B
Let's
say
you
know
my
k6
Alpha
Club
door,
Boxster,
okay,
all
right!
So
everything
else
is
the
same.
I'm
just
gonna.
Have
it
run
a
different
script
so
again,
I
have
to
recreate
that
that
resource
now
this
this
is
one
of
the
things
is
that
it
appears-
and
this
is
kind
of
early
days
with
the
operator
as
well.
So
you
know
if
there's
any
issues
be
feel
free
to
write
them
up.
You
know
any
contributions
feel
free
to
contribute.
B
So
if
I
come
back
here,
sorry,
if
I'm
popping
around
too
much
here
so
I'm,
going
to
go
ahead
and
apply
the
same
resource
again
and
then
that
will
then
recreate
it
there.
Okay,
I'm
gonna
go
over
switch
over
to
pods
and
then
now
there
we
go
we'll
see
that
yeah
we're
we're
running
six
different
pods.
Now
those
are
all
going
so
I
can
come
back
here.
B
Let's
see,
let
me
keep
refreshing
here,
because
we
should
start
seeing
this
coming
in
there
we
go
here's
the
door
buster
now
is
showing
up.
You
can
look
in
here
to
the
details
and
then
yeah,
it's
again,
I
could
probably
with
work.
I
can
make
this
a
prettier
graph
as
this
is
coming
through,
but
but
yeah.
So
this
is
all
going
through
Prometheus.
Now,
all
right,
so
now,
I
next
I
wanted
to
show
you
real,
quick,
the
grafana
cloud,
so
I've
already
set
this
up
and
again
I'm
I'm
using
the
free
one.
B
The
free
version,
so
no
subscriptions
is
what
they
we
call
them
in
case
six.
So
let
me
go
ahead
and
run
that
so
I'm
gonna
go.
Do
this
k6
cloud
so
yeah!
This
is.
This
is
mine
using
the
free
version
now
you'll
I'll
have
to
point
out
here
that
parallelism
is
one
with
the
free
tier.
You
can
only
have
one
single
instance.
Basically
running
otherwise
it
won't
won't
quite
work,
so
it's
it's
not
as
fun.
Unfortunately,
so
if
I
go
ahead
and
get
to
my
readme
and
let's
see
oh.
B
I
thought
I
had
where's.
My
all
right,
I
will
just
recreate
that
all
right,
so
this
one's
gonna
go
to
k6
Cloud
I
was
hoping
I
had
my
own
little
copy
paste
help,
but
alas
I
had
to
manually:
do
it
horrible,
oh,
the
humanity,
so
yeah?
So
now,
if
I
come
in
here,
this
is
an
old
run
here
we
should
see
once
that
container
starts
running
that
I'm.
Just
simply
outputting
results
now
to
my
k6
cloud
account,
and
here
they
are
so
again.
B
B
Let's
see,
let's
see
while
that's
running
there
does
does
it
deploy
as
a
deployment
or
a
job,
actually,
neither
the
so
the
actual
op,
because
it's
an
operator,
all
you
have
to
do
is
create
the
resource,
and
then
the
operator
is
listening
for
the
creation
of
those
resources,
so
it'll
create
pods
directly.
So
you
don't
it's
not
based
on
any
deployment
resource
or
or
a
specific
job.
It's
not
cron,
based
or
anything
like
that.
The
scheduling
is
strictly
by
creation
of
the
resource.
B
You
know
pushing
that
resource
up
and
yeah,
while
the
pods
do
die,
but
they
don't
go
away.
So
if
you
noticed
here
that
they
they
do
Linger
on
so
I
would
have
to
go
and
delete
the
resource,
the
k6
resource,
which
would
actually
then
clean
up
everything
and
from
my
use
of
it
so
far,
I
actually
threw
this
script
together
to
just
make
it
a
little
bit
nicer,
which
would
actually
go
and
delete
the
resource.
B
If
it
was
previously
existing
that
way,
then
you
wouldn't
have
to
worry
about
what
I
had
mentioned
about.
It
seems
like
the
pod's
not
not
getting
the
job,
not
re-triggering
if
it
already
existed
or
just
changed
so
again.
That's
that's,
probably
just
kind
of
yeah
it
could
be
could
be
fixed.
So
let's
see
all
right,
so
we've
got
that
now.
B
I
do
want
to
show
this
to
you,
because
this
is
one
of
the
fun
things
so
obviously
we're
I'm
looking
at
two
different
we're
looking
at
two
different
SAS
providers,
two
different
SAS
Solutions
k6
cloud,
and
then
we
have
the
grafana
cloud
right.
Well,
since
we're
all
now
under
the
same
umbrella.
We
actually
even
have
this
now.
So
in
your
case
I'm,
sorry
in
your
grafana,
you
can
actually
add
the
grafana
or
k6
app.
So
what
that
does
is
that
recreates,
the
The
k6
Experience
inside
of
grafana.
B
So
now
you
can
have
everything
co-located
in
your
observability
platform.
So
now,
if
we
look
here,
you'll
see
that
here's
my
simple
test.
So
this
is
that
old,
one
that
I
had
and
then
this
is
here
the
new
one
that
was
just
we
just
ran,
so
we
can
drill
into
there
and
then
now
we
have
even
nicer
graphs
than
what
I
was
able
to
create
so
kudos
to
the
you
know
our
k6
developers,
who
actually
created
this
app
for
grafana,
so
you
can
plug
that
in
and
use
that
for
free.
B
Now
this
does
use
as
a
data
source,
it's
actually
using
the
k6
cloud.
So
it's
actually
pulling
metrics
directly
from
k6
cloud
into
grafana.
This
way,
just
the
visualization
all
right
and
let's
see
I'm
trying
to
keep
an
eye
on
the
time
and
then
looks
like
we
got
like
six
minutes
left
and,
let's
see,
I
did
notice.
I
missed
a
question
here
from
Manuel
terms
of
usability.
The
reason
that
we
must
build
the
image
and
not
load
JS
Code
test
dynamically
is
because
it
must
be
compiled
to
go
language.
B
Yes,
it
does
have
to
be
compiled
and
that's
because
also
because
we
are
using
the
the
Prometheus
output,
which
is
an
extension
now.
Well,
you
know,
don't
tell
anybody
just
between
you
me
and
the
rest
of
the
internet.
We
are
working
now
that
k6
is
under
the
grafana
labs
umbrella.
We
are
working
toward
Prometheus
becoming
the
default
output
for
k6.
B
So
if
you're
not
doing
just
console
it'll
be
embedded
in
there,
so
you
can
just
say
on
a
you
know,
a
command
line
argument
you
can
say
the
output
is
going
to
be
Prometheus,
provide
obviously
the
the
remote
right
endpoint
to
Target
and
then
it'll
just
happen.
You
won't
have
this
extra,
compile
step
that
we
have
right
now,
but
that's
that's
we're
still
working
on
that,
because
there
were
some
of
the
some
of
the
problems
with
with
Prometheus
output.
B
Right
now
was
the
the
histogram
support,
so
that
is
currently
being
worked
on.
That
is
very
close
to
being
complete
and
so
with
right.
Now
we
just
released
version
0.41
of
of
k6
I'm,
not
going
to
say
you
know
what
version
but
I'm,
just
gonna
say
it
should
be
soon,
but
we
are
that
is
being
worked
on,
so
you
won't
need
this
compilation
step.
B
B
You
know
so
that,
as
long
as
you
have
Docker,
you
don't
have
to
worry
about
having
it
go
run
time
set
up,
you
know
all
that
so
just
yeah
again
trying
to
reduce
some
of
that
friction
just
make
it
easy
to
adopt
see
so
I
think
that
pretty
much
covers
everything
that
for
the
demo
now
I
did
want
to
go
ahead
and
finalize
some
things
with
these
slides
here,
let's
see
there,
we
go
all
right
so
yeah.
So
now,
with
all
that,
you
know.
B
Where
do
we
go
from
here
so
again
with
hooked
in
with
your
observability?
You
know
you
need
to
you
want
to
bring
in
those
measure
those
four
golden
signals,
so
you
know
again
whether
you're
using
grafana
or
something
like
a
New,
Relic
or
data
dog.
You
know
make
sure
that
you're
watching
these
these
elements,
you
know
that
you're
checking
the
latency
you're
checking
the
amount
of
traffic
how
your
application
behaves.
B
You
know
when
the
it's
saturated
in
you
know,
of
course,
tracking
the
number
of
errors
by
doing
this
up
front
you're
going
to
get
a
lot
more.
You
know
a
lot
more
bang
for
your
buck.
By
doing
this,
this
testing
up
front
just
whoops.
There
you
go
I
didn't
realize.
I
had
my
little
my
animations
on
there,
but
yeah
so
including
the
things,
the
checks
to
make
sure
that
you
know
the
network.
Quality
is
good,
that
you
know,
you're
accommodating
the
your
your
Black
Friday
scenario.
B
And
also
to
check
and
make
sure
that
your
infrastructure
is
not
under
provisioned
that
you're,
you
know
your
your
setups
are
enough
to
accommodate
your
needs
and
again
that's
pre-production
include
that
shift
left,
bring
it
up
front,
just
make
sure
everything's
running,
use
your
observability
platform
to
watch
and
make
sure
that
everything
is
going
well,
while
you're
putting
everything
together
and
that
continues
post-production
and
with
that
I
think.
Oh,
look
at
that.
B
A
All
thank
you
so
much
Paul.
Thank
you,
everyone
for
joining
us
and
for
all
your
questions.
You
know
exactly
where
to
find
Paul
and
this
presentation
and
slides
will
be
available
later
today
online.
If
you
can,
you
can
use
this
registration
link
again
or
go
to
our
online
programs.
Youtube
playlist
thanks
again
for
joining
us.
Thank
you,
Paul
and
we'll
see
y'all
at
another
online
program.
Cncf
live
webinar
soon.