►
Description
No description was provided for this meeting.
If this is YOUR meeting, an easy way to fix this is to add a description to your video, wherever mtngs.io found it (probably YouTube).
A
Hello,
everyone
welcome
to
cloud
native
live
where
we
dive
into
the
code
behind
cloud
native,
I'm
annie
and
I'm
a
cncf
ambassador
as
well
as
a
senior
product
marketing
manager
at
camunda,
and
I
will
be
your
host
tonight.
So
every
week
we
bring
a
new
set
of
presenters
to
showcase
how
to
work
with
cloud
creative
technologies.
A
They
will
build
things,
they
will
break
things
and
they
will
answer
all
of
your
questions
so
join
us
every
wednesday
to
watch
live
this
week.
We
have
andy
talking
about
power
up
your
machine
learning,
and
that
is
really
looking
forward
to
this
really
great
and
another
thing
that
you
saw
in
the
banner
and
you
can
see
in
the
little
banners
that
are
in
the
screen
as
well.
Remember
to
register
and
reserve
your
spot
from
kubecon.
A
What's
up
nativecon
europe
now
is
really
time
to
secure
your
spot
and
as
always
as
a
housekeeping
item.
This
is
an
official
live
stream
of
cnc
app
and
as
such,
it
is
subject
to
the
cncf
code
of
conduct.
So
please
do
not
add
anything
to
the
chat
or
questions
that
would
be
in
violation
of
that
code
of
conduct.
Basically,
please
be
respectful
of
all
of
your
fellow
participants
as
well
as
presenters,
so
with
that
I'll
hand
it
over
to
andy
to
kick
off
the
presentation.
B
B
If
anybody
wants
to
actually
just
kind
of
follow
along
the
slides,
I
am
or
there's
a
there's,
a
bitly
link
as
well.
You
can
kind
of
if
you
can
type
in
bitlynetdata
cncflive
that
deck.
So
I
will
kind
of
I've
got
I've
got
like
one
one
sort
of
setup
slide.
Let
me
first
kind
of
this.
This
I've
got
one
slide
and
then
we
will
kind
of
go
into
the
demo.
B
Basically,
so
the
the
main
kind
of
goal
here
is
to
talk
about
anomaly,
detection
and
there's
lots
of
different
ways
to
frame
anomaly.
Detection
to
you
know,
lots
of
different
ways
to
tackle
the
problem
and
I
won't
go
into
too
many.
You
know
too
much
detail
the
one
you
know
the
high
level
way
think
about.
B
It
is
just
a
simple
question:
does
my
data
look
strange
and
then
you
know,
there's
hundreds
of
ways
to
kind
of
take
that
question
and
implement
some
sort
of
product
or
solution
and
on
the
screen
is
just
some
kind
of
examples
of
examples
of
different
types
of
anomalies
that
we
might
come
across.
So
it's
you
know
it's
the
first
thing.
People
usually
think
of
is
kind
of
spikes
in
their
data,
and
but
it's
not
just
spikes,
it
can
be.
You
know
it
can
be
lots
of
different
types
of
patterns.
B
Basically
that
look
strange
and
then
that's
kind
of
a
court.
What
we're
how
we've
approach
this
is
that
we're
not
just
looking
for
like
single
high
values
or
single
low
values,
we're
actually
looking
for
strange,
looking
patterns
in
the
recent
data,
and
that's
the
that's
the
that's
the
kind
of
that's
the
the
the
main.
The
main
aim
here,
basically
and-
and
I
have
there's
you
know,
there's
one
one
more
slide
here,
which
I
won't
even
really
go
into.
It's
a
lot
of
detail
here,
but
this
is
basically
how
we
have
taken.
B
You
know
the
first
question
here:
does
my
data
look
strange
and
the
next
slide
is
basically
here's
how
we
have
taken
that
question.
That's
our
high
level
messy
question
and
actually
how
we've
formulated
the
problem
and
how
we've
how
we've
actually
implemented
it,
and
this
is
just
in
terms
of
general
ml
discussions.
This
is
always
the
trickiest
part.
B
Sometimes
where
you,
you
have
a
high
level
question
and
you
need
to
how
do
you
actually
formulate
that
and
how
do
you
operationalize
it
as
a
machine
learning
problem,
and
so
this,
basically
is,
is
our
kind
of
medium
level.
Detail
slide
of
how
how
we're
approaching
it
in
the
net
data
agent
and
and
there's
more
detail
in
this
deck
which,
if
anyone
wants
to
go
into
more
detail,
there's
there's
more
detail
there
and
so
I'll
get
straight
into
the
demo.
B
Now,
because
I
kind
of
want
to
try
and
get
into
the
demo
first
and
show
show
people
kind
of
the
the
feature
and
then
save
time
as
much
as
possible
for
questions.
But
if
anyone
has
any
questions
at
any
time,
I'm
I'm
happy
to
kind
of
stop
and
take
questions
at
any
stage.
You
know
just
know
the
more
questions.
The
better
I'd
like
to
kind
of
have
some
discussion
as
well.
B
So
this
is
the
break
things
part
and
we're
going
to
use
gremlin
to
actually
trigger
a
chaos
attack
on
my
nodes
and
we'll
just
watch
how
that
plays
out
through
the
anomaly
advisor
now,
to
see
kind
of
to
see
the
difference
between
like
a
traditional
approach,
where
it's
kind
of
needed
in
a
haystack
versus
a
more
modern
approach.
Where
we're
using
the
machine
learning
to
surface
and
the
insights.
That's
the
the
main
goal
of
the
anomaly
advisor.
B
So
I
will
jump
out
of
presentation
mode
and,
firstly,
a
little
bit
about
metadata,
just
really
quick.
So
we
have
our
open
source
agent.
That
does
monitoring
and
it
will
monitor
anything
that
can
run
c.
Basically
so
servers
iot
devices
and
everything
in
between
and
the
the
net
data
agent
can
run
on
the
run
on
the
on
the
on
the
node
collect
the
metrics
and
the
metrics
are
all
stored
on
the
node.
B
But
it's
it's
done
in
a
sort
of
federated
way
such
that
there's
no
data
centralization
points
and
that
data
cloud
kind
of
can
just
straddle
your
agents
and
pull
them
all
together.
Basically-
and
so
in
in
here
I
have-
I
have
a
room.
I
have
a
a
space
set
up
for
cncf
live
and
I
have
a
room.
Every
space
has
a
general
room.
I
will
jump
into
this
specific
room.
B
I
have
here
for
just
just
the
three
nodes
that
I'm
interested
in
for
in
this
for
today,
and
so
what
we
see
here
is
we've
got
basically
a
dashboard
of
you
know,
hundreds
of
charts
and
thousands
of
metrics,
basically
all
at
the
second
level,
and
so
this
is
all
coming
through
the
agent
in
real
time,
and
so
I've
got
three
nodes
in
here.
Cncf
live
one
two
and
three,
and
I
have
we
have.
B
I
have
some
some
crown
jobs
running
on
each
of
these
nodes,
running
cpu,
cpu,
stress
and
tests.
Basically,
so
there's
like
cpu
work
going
on,
and
this
is
the
you
know
traditional
kind
of
monitoring
approach.
Where
you
have
a
dashboard
you
have,
you
know
we
have
kind
of
lots
of
different
categorizations
and
semantic
categories
of
charts,
and
so
each
node
basically
has
typically
out
of
the
box
about
300,
charts
and
and
two
thousand
metrics
or
so,
and
so
there's
lots.
You
know
it's
lots
and
lots
of
data
here.
B
B
You
know
traditional
approaches,
you
have
you
maybe
have
alerts,
and
you
have
some
ideas
yourself
of
you
have
a
theory
of
what
it
is.
You
need
to
troubleshoot
and
you
come
in
here
and
you
kind
of
click
around
and
that's
kind
of
that's
the
way
it
it
is
generally
still
in
observability,
and
so
some
of
the
idea
of
what
we're
going
to
discuss
today
is
to
complement
that
approach,
basically
by
using
machine
learning
and
the
whole
idea.
B
Our
team
of
a
lot
of
stuff
we're
doing
here
is
to
use
machine
learning
as
the
ux.
Basically,
so
you
know
the
traditional
approach
of
you
know
what
you're
you
know
what
you
want
to
look
at.
You
know
what
chart
to
look
at.
You
have
an
idea,
a
hypothesis
in
your
head
and
you're
kind
of
exploring
iteratively,
that's
all
still
perfectly
valid,
and
the
idea
of
the
the
anomaly
advisor,
which
is
this
anomalies
tab,
is
to
take
a
different
approach
which
is
to
use
the
mach.
B
B
In
that
data
we
have
like
a
summarization
which
is
an
aggregation
basically
of
all
these
three
nodes,
and
so,
if
I,
if
I
group
by
let
me
look
at
the
last
30
minutes
say
and
if
I
group
by
node,
we
can
see
maybe
I'll
make
that
a
line.
So
I
can
see
here,
here's
the
actual,
like
the
overall
cpus
usage
of
each
of
these
three
nodes.
So
you
can
see
you
know
the
the
orange
line
is
around.
B
You
know
twelve
percent,
twenty
percent,
the
the
purple
line
pink
line
is,
is
up
between.
You
know
40
to
50,
so
the
other
two
lines
are
up
at
a
higher
level
and
that's
basically
that's.
I
have
this
all
kind
of
configured
based
on
a
cron
job
that
kicks
off
stress
jobs.
So
if
I,
if
I
look
at
the,
I
can
look
at
the
applications
menu
here
and
I
kind
of
I
know
what
I'm
looking
for
here.
B
So
it's
I'm
interested
in
the
stress
app,
and
this
is
all
kind
of
auto
discovered
by
net
data.
So
the
setup
here
is
that
I
have
basically
a
let
me
make
that
a
line
as
well
so
they're
not
they're,
not
on
top
of
each
other.
I
have
a
crown
job
that
sort
of
does
on
each
know,
there's
a
crown
job
that
runs
distress,
ng
tool
which,
basically,
just
in
you
know
for
this
one.
Here,
it's
like
every
three
minutes.
B
It's
gonna
to
take
30
of
one
cpu,
and
it's
going
to
do
that
for
160
seconds
and
every
two
minutes.
It's
going
to
take
another
30
for
140
seconds,
and
so
each
of
these
nodes
has
you
know
some
cpu
stuff
going
on.
Basically
that's
the
idea,
and
rather
than
instead
of
doing
a
demo
where
there's
just
nothing
happening
on
the
nodes.
I
wanted
to
do
a
demo
where
we
have
some
cpu
usage
and
then
see
the
impact
of
you
know.
Some
other
attack
we're
going
to
make.
B
B
It's
kind
of
auto
configured
out
of
the
box
that,
if
you're
running
that,
if
you're
running,
stress,
ng
tool
or
if
you're
running
my
sequel
or
docker
or
any
of
any
other
tool,
basically
and
net
data,
should
recognize
that
and
give
it
its
own
application.
And
so
that's
how
you
can
kind
of
see
which
different
applications
are
behaving
on
your
on
your
machine,
and
that
also
applies
to
containers
and
stuff
which
we
might
get
to
later.
B
B
Basically,
and
so
what
I'm
going
to
do
is
I'm
going
to
jump
over
into
gremlin
and
actually
just
kick
off
an
attack?
So
I've
got
my
two
hosts
in
in
in
there.
I
have
the
gremlin
agent
running
on
these
two
hosts
as
well,
and
so
I'm
going
to
kick
off
a
chaos
attack
and
we
will
do
a
resource
attack
and
maybe
memory.
B
B
What
we
have
now
is,
we
can
see
basically
a
sort
of
a
spike
coming
through.
So
let
me
actually
let
me
go
last
15
minutes.
So
it's
a
bit.
It
was
a
bit
zoomed
out
there.
So
what
we
have
here
is
we
have
a
big
jump,
a
spike
in
the
number
of
anomalous
dimensions
on
each
of
our
nodes
on
cncf
live
1
and
cncf
live
2..
So
what
you
can
see
here
is
that
as
the
attack-
let's
see
if
it's
finished,
it's
kind
of
still
still
ongoing.
B
I
think
I
gave
it
yeah.
It
should
be
finishing
now
and
as
the
attack
plays
out.
Basically,
we
see
a
jump
in
the
number
of
anomalous
metrics,
and
so
this
chart
here
shows
counts
of
anomalous,
metrics
and
metrics
and
dimensions
is
kind
of
interchangeable
in
in
that
data.
So
this
is
basically
saying
that
let
me
just
play
it
out
a
little
bit
more
as
well
so
pause
it.
This
is
saying
that
you
know
at
this
time
step
here.
You
know
17
13
39
seconds.
B
B
It
could
be
in
this
case.
It's
you
know,
my
nodes
have
the
same
amounts
of
dimensions,
so
the
the
counts
are
kind
of
similar,
but
it
could
be
that
and
they
might
not
have
the
same
number
of
they
might
be
monitoring
different
things,
so
the
actual
account
of
dimensions
might
not
be
enough.
It's
usually
you
know.
Maybe
it's
the
anomaly
rate
which
you
care
about,
and
so
the
anomaly
rate
corresponds
to
at
this
particular
second
and
39
seconds
past.
B
You
know:
17
13.,
the
cncf
live
2
node
had
about
3.2
percent
of
its
metrics
were
considered
anomalous
and
the
cncf
onenote
had
about
similar
about
three
percent.
So
we
see
basically
a
jump
here
in
on
both
nodes
to
about
you
know
three
percent
or
so,
and
the
the
tour
chart
on
this
screen
is
basically
a
a
higher
level
aggregation
again
so
on
the
net
data
agent
itself.
B
B
We
can
just
say
this
looks
anomalous
and
then
it's
up
to
the
human
to
decide
whether,
whether
it's
something
that
they
need
to
take
action
on
or
not
so
here
we
can
see
basically
an
elevation
in
the
the
blue
and
the
red,
so
I'll,
just
filter
for
these
two
guys.
Because-
and
these
are
these
are
the
nodes
that
I
seem
to
have
a
problem
on
and
what
I
want
to
do
now
is
so
these
first
three
charts
in
some
way
kind
of
tells
you,
okay
between
17,
13
and
17
and
15.
B
B
A
region
of
interest,
which
is
a
general
a
general
way
within
that
data,
we
we
interact
with
charities,
we
highlight
regions
of
interest
and
then
you
get
sort
of
context-specific
help.
So
here
once
I
highlight
this
this
region
of
interest,
I
now
see
that
on
below
the
top
three
charts
I
get
this
kind
of
table
of
sparklines.
Basically,
we
still
haven't
come
up
with
quite
a
good
name
for
this.
B
It
originally
was
a
heat
map,
but
it's
now
turned
into
a
table
of
sparklines,
basically,
and
what
what
this
is
telling
me
is.
Each
of
these
kind
of
green
lines
is
the
anomaly
rate
for
a
particular
metric
of
interest,
and
so
what
this
this
is
saying
here
is.
I
can
see
straight
away
that
apps
l
writes
a
kremlin
was
in
this
highlighted
window.
It
was
considered
anomalous
57
of
the
time
so
or
you
can
say
that
the
anomaly
rate
was
57,
basically
across
all
across
these
two
nodes.
B
This
was
probably
me
when
I
was
on
the
overview
screen
triggering
triggering
calls
to
net
data
that
I
haven't
been
on
this
note
in
a
few
hours
so
that
you
know
that's
a
good
example
of
where
sometimes
you
might
get
a
mix
of
a
mix
of
things
going
on
at
the
same
time
which,
because
you
get
it
over
time,
you
can
kind
of
see
the
how
how
they've
evolved
over
time.
So
I
can
clearly
see
at
this
point
here.
Gremlins
started
doing
lots
of
work
and
you
know
let's
find
something
interesting
here.
B
We
can
see
if
I
find
kind
of,
but
it's
a
lot
of
gremlin,
because
gremlin
was
automatically
kind
of
discovered
by
that
data.
It's
a
lot
of
gremlin
stuff.
Here's
a
nice
one
here,
actually
memory
available.
This
is
a
nice
kind
of
because
this
is
one
of
these
high
level
metrics,
and
so
we
can
see
here
is
actually
on
both
nodes.
The
memory
available,
you
know,
was
steady
at
about
two
point:
five
gigs
each,
and
so
so.
B
Actually
I
let
I
let
gremlin
take
two
gigs,
which
was
probably
probably
a
lot,
because
these
are
small.
These
are
small,
vms,
basically,
and
you
can
see
that
actually,
the
memory
available
jump
dropped
down
as
soon
as
gremlins
started,
doing
its
chaos
attack
the
memory
available,
dropped
down
to
you,
know,
half
a
gig
or
so
on
each
and
as
as
that,
memory
available
dropped
and
the
anomaly
rate
jumped
up.
B
B
You
know,
filter
the
dashboard
filter,
all
your
metrics
into
maybe
the
top
20
or
the
top
50,
and
if
you
can
quickly
scan
within
these,
you
know
within
these
metrics
and
get
a
feel
for.
Is
this
something
you
care
about?
Yes
or
no?
And
that's
the
main
idea
here
and
we've
kind
of
solved
down
solved
the
the
search
problem,
basically
by
using
the
anomaly,
the
anomaly
rates
to
kind
of
filter
or
sort
your
your
metrics
and
just
and
and
show
you
the
ones
that
we
think
looked
the
most
strange
during
this
window?
B
A
B
A
B
B
So
if
I
go
to
to
applications-
and
if
I
say
give
me
the
last
six
hours,
we
can
look
at
the
cpu
overhead
and
by
for
for
just
net
data,
say
and
let's
just
see,
because
there's
there's
a
few
options.
Basically,
unless
there's
some,
let's
unselect
that
guy
yeah,
so
you
can
see
here
kind
of
a
few
a
few
little
peaks
when
I
was
actively
querying
that
data
from
the
dashboard.
But
generally
it's
it's
taken.
B
You
know
just
over
one
percent,
if
you
even
have
one
cpu
on
these,
these
machines,
which
is
a
this,
is
like
the
lowest
level
gcp
vm,
so
we've
built
it
to
be
as
as
lightweight
as
possible,
because
that's
that's
core.
To
kind
of
the
whole
approach
here
is
that
ins.
The
whole
idea
here
is
actually,
instead
of
just
taking
the
raw
data
and
displaying
on
the
screen,
we're
taking
the
raw
data
and
we're
just
kind
of
learning
a
little
bit
from
it
and
and
doing
a
little
bit
of
tiny
work.
B
To
also
give
it
is.
These
ones
are
zeros,
which
is
the
anomaly
bits,
and
so
typically,
we
have
a
lot
of
configuration
options
in
in
the
in
terms
of
when
you're
setting
up
when
you're,
enabling
dml
there's
lots
of
different
configuration
options.
You
can
do
so.
You
can
have
it
to
only
train
at
a
longer
window,
so
you
can
tell
okay
only
train
every
four
hours
and
then
what
it'll
do
is
it'll
spread
the
training
across
that
four
hours,
or
you
can
say,
only
train
on
these
specific
charts.
B
B
Sometimes
people
like
to
start
with
enabling
this
stuff
on
parents
as
well
so-
and
I
have
a
there's-
a
lunch
post
on
our
community
forum,
that's
in
the
deck
as
well.
That
has
an
example
of
a
configuration
you
might
use
for
that
case.
So
the
example
configuration
here
was,
I
have
you
know
a
parent
and
say
you
have
three
iot
devices
you
could
easily
just
have
those
three
devices
stream
to
the
parent
and
then
all
you
would
need
to
do
would
be
to
enable
ml
on
the
parent
and
it'll
automatically.
B
Then
do
do
the
training
on
the
parent
for
those
for
the
the
data
that's
streamed
in
so
there's
no,
no
ml
happening
at
your
edge,
then
so,
and
typically
for
iot
devices.
That
would
probably
be
what
I
would
recommend
and
because,
if
you
know
you
might
be
able
to
run
it
like,
for
instance,
sometimes
when
I
run
it
on
my
raspberry
pi,
it
might
take.
Maybe
three
percent
cpu
under
on
my
raspberry
pi,
with
with
the
defaults,
turned
on
for
everything
kind
of
behavior
and
so
for
iot.
That
might
not
be
enough.
B
You
know
that
that
might
be
too
heavy,
basically
and
so
for
iot
setups
you,
you
might
want
to
go
with
a
parent
approach
where
you
actually
just
stream
your
metrics
to
the
parent,
and
then
the
ml
happens
on
the
parent.
Basically-
and
you
don't
need
to
store
these
metrics
on
the
parent,
because
at
all
I
mean
once
it's
trained,
the
models.
B
Are
there
so
you're
not
you're,
still
not
necessarily
having
to
centralize
all
of
your
data
in
one
place,
you're
only
kind
of
streaming
it
through
the
parent
and
the
parent
will
learn
from
the
data
and
then
apply
in
omniscore.
So
for
iot
stuff.
That's
probably
what
I
would
recommend
trying
first,
but
you
cannot,
you
know
you
could
try
it
on
the
edge
depending
what
the
device
is.
I
guess
is
the
big
question
there.
B
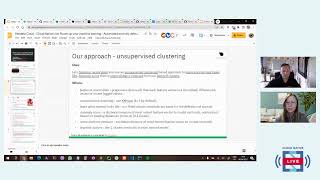
So
yeah
good
question,
that's,
and
that
is
something
that
we
that
was
a
core
part
of
kind
of
designing.
Why
that's
why
we
use
k-means
as
the
the
model
under
the
hood.
We
use
unsupervised
clustering
because
it's
it's
one.
It
can
be
done
very
cheaply
and
efficiently
in
the
c
plus
plus
code
in
the
agent,
and
so
the
the
one
of
our
biggest
kind
of
main
things.
We
always
try
and
try
and
think
of
the
impact
of
is
the
ml
can
never
take
too
much
impact
on
the
agent.
B
It's
monitoring-
and
you
know-
and
so
typically
you
know
one
percent
or
so
cpu
of
one
single
core
is
kind
of
almost
like
some
insurance.
You
can
kind
of
think
of
it
that
way,
but
sometimes
it's
it
might
not
be
feasible,
especially
for
iot,
and
that's
when
you
might
want
to
look
at
the
parent
child
approach.
A
B
The
integrity
of
our
handcrafted
alerts
based
on
expertise
over
the
years
that
we've
built
up
with
until
the
ml
proves
itself
that
it's
it's
it's
more
right
than
wrong,
typically,
and
so
pretty
soon.
What
we're
gonna
do
is
make
the
anomaly
rates
available
to
the
health
engine.
So
if
you,
if
the
user
wanted
to,
they
could
easily
trigger
an
anomaly
like
you,
you
know
you
might
have
a
traditional
alert
at
the
moment
say
would
be.
B
If
cpu
usage
goes
over
80
trigger
critical
warning,
you
could
easily
have
that
then
be
modified
based
on
the
anomaly
rate
to
say:
okay.
Well,
if
the
anomaly
rate
is
still
less
than
50,
don't
don't
do
anything
because
it
may
be
that
you,
you
run
at
90
cpu
by
design
and
that's
the
whole
point
you're
trying
to
optimize
these
nodes
for
cpu,
and
so
it's
really
what
you're
interested
in
is.
B
If,
if
the
cpu
was
to
maybe
drop
or
change
pattern,
that's
when
the
anomaly
rate
would
go
up
and
that's
probably
what
you'd
be
more
interested
in.
So
we
are
keen
to
make
the
these
anomaly
rates
available
to
the
health
engine
and
but
we're
not
going.
We
haven't
kind
of
gone
as
far
as
to
feel
the
alerts
off
any
of
this
just
yet
until
it
sort
of
proves
itself
that
it's
it's,
you
know
until
the
ml
under
the
hood.
B
This
is
like
the
first
generation
basically,
and
so
we
want
to
get
at
the
point
where
we
iterate
and
improve,
and
this
is
why,
for
now,
it's
it's
it's
a
little
bit
sort
of
passive
as
opposed
to
you
know.
It's
not
going
to
wake
up
in
the
middle
of
the
night
with
alerts
just
yet,
but
if
you
want
to,
if
you,
if
you
want
to,
if
a
user
wanted
to
do
that,
they
could.
B
But
we
just
we're
not
going
to
do
it
out
of
the
box
anytime
soon
and
but
ultimately,
it
would
be
kind
of
the
nirvana
and
there's
also
a
whole
lot
of
other
ml
stuff.
We
want
to
do
to
use
ml
to
solve
alert,
fatigue
and
because
that's
a
whole
other
area
of
observability.
That's
that's
ripe
for,
and
you
know,
ripe
for
there's
lots
of
low-hanging
fruit
basically,
and
we
started
with
anomaly
detection,
but
we
also
the
next
big
ml
problem
that
we
want
to
start
tackling
is
using
ml
to
solve
alert,
fatigue.
B
So
yeah
good
point,
and
so
there's
more
details.
Kind
of
there
will
be
lots
more
details
in
here.
In
terms
of
how
you
might
configure
a
health,
you
could
configure
an
alert
based
on
the
anomaly
rates.
It's
just
it's
still.
You
would
have
to
configure
as
a
custom
alert
which
isn't
that
hard,
but
it's
not
sort
of
out
of
the
box
just
yet.
B
Cool,
so
I
will
I've
got
one
last
little
bit
of
demo
I'll
do
a
quick
one,
because
this
is
a
nice
one.
I
think
sometimes-
and
so
let
me
go
back
here
and
kind
of
just
turn
back
everything
on
last
15
minutes,
and
so
in
the
on
these
nodes
we
have
a.
I
have
a
a
little
app
running.
Basically,
so
let
me
I
have
an
offering
on
this
node
and
I'm
gonna
kill
these
vms
afterwards.
B
So
I
don't
mind
anybody
seeing
the
ip
that
was
kind
of
one
thing
I
was
going
to
do.
People
want
to
connect
to
this.
They
can
I'll
stick
it
in
the
chat.
Well,
maybe
there
was
a
turret
demo
was
for
for
people
to
come
in
here
and
have
a
look
at
the
net
date
of
that
for
them
you
could
see
how
that
played
out,
but
first,
what
I'll
do
is.
B
I
will
connect
to
the
dashboard
and
I'll
take
the
last
30
minutes
and
I
have
we
have
a
little
sort
of
a
little
app
running
on
this
same
a
little
container.
That's
running
a
python
app,
basically
a
dash
app,
and
this
is
what
we
use
to
kind
of
do
some
proof
of
concept
stuff
internally,
and
so
what
I'm
going
to
do
is
I'm
going
to
kind
of
come
in
and
just
do
some
do
some
work,
basically,
where
I
give
it
this
url
and
what
this
app
is
going
to
do
now.
B
Is
it's
going
to
query
the
local
agent
pull
all
the
data
for
all
the
metrics
and
it's
going
to
do
some
clustering
and
give
me
back
a
clustered
heat
map,
which
is
also
something
I'd,
love
to
add
internet
data
soon.
So
the
idea
here
is
this
is
all
the
raw
metrics.
So
it's
a
big
long.
You
know
big
long
kind
of
heat
map
and
the
the
order
of
everything
is
based
on
clustering.
B
B
Yeah-
and
so
I
can
see
sort
of
this
is
what
I
was
after
here,
where
I
can
see.
You
know
my
my
my
net
data
ml
app
container
basically
came
to
life
here,
and
you
can
see
it
started
doing
some
cpu
usage
basically,
and
you
can
see
some
some
network
traffic
as
it
was
kind
of
displaying
the
heat
map
on
the
screen,
or
it's
probably
actually
the
the
agent
itself,
and
so
you
can
see
here
like
this
is
basically
a
case
where
you
know
some
some
container.
B
Of
that's
that's.
Basically,
the
the
main
idea
here
is
to
change
the
approach,
basically
to
complement
the
traditional
approach
of
you
know
a
big
dashboard
with
charts,
and
you
have
some
idea
in
your
head
and
you
you
click
around,
and
you
say:
oh,
maybe
I'll
check,
network
yeah,
okay,
maybe
I'll
check,
you
know
memory
and
yeah.
I
did.
The
idea
of
the
anomaly
advisor
is
to
just
basically
use
machine
learning
as
the
ux
and
that's
like
the
big
team
here.
The
bigger
picture
here
of
all
of
this
work
is
observability.
B
Has
you
know
lots
of
areas
where
we
can
use
machine
learning
as
the
ux
basically
and
go
beyond?
You
know
be
on
dashboards?
Basically,
and
so
that's
the
idea.
You
know
you
find
a
time
of
interest
and
you
you
highlight
the
area
and
if
it's
the
next
step
will
be.
If
it's
something
that
you're
you
know
you
are,
you
do
find
it
useful.
We
have
the
feedback
here
and
the
ultimate
goal
would
be
to
build
models
to
actually
say
okay,
but
maybe
this
is
okay.
B
B
There
is
a
I'll
do
a
little
quick
bit
about
under
the
hood,
because
this
this
last
third
part
here
is
base
basically
kind
of
what's
going
on,
and
so,
if
I,
if
I
go
back
to
say
this
this
agent
here,
if
we
can
kind
of,
have
a
look
and
see
what's
going
on.
Basically
so
on
the
agent
there
is
system.net
say:
let's
take
for
every
chart.
B
Basically,
every
second
we
have
the
raw
metrics
and,
what's
going
on
on
the
agent,
is
that
the
at
the
same
time
we
also
are
producing
the
the
ones
and
zeros.
So
if
I
say,
options
equals
anomaly
bit-
and
this
is
called
anomaly
bit
because
it's
we
have
implemented
this
in
a
really
efficient
way,
such
that
there's
actually
no
storage
overhead
at
all.
B
So
in
the
internal
representation
that
they
uses,
we
had
a
spare
bit
whenever,
whenever
really
some
really
clever
c
engineers
figured
out
that
we
could
kind
of
repurpose
a
spare
bit
and
and
flip
this
bit
when
there's
anomalies.
Basically,
so
there
isn't
even
any
storage
overhead
to
actually
store
all
of
these
ones
and
zeros
we
get
them
for
free,
and
you
can
see
here.
B
You
know
what
this
is
saying
is:
okay
at
this
time
stamp
for
whatever
this
is
it's
probably
in
it's.
You
know
whatever
it
is.
It's
traffic
cent
and
basically
net
data,
considered
this.
The
recent
observations
here
to
be
anomalous,
and
so
we
don't
just
take
the
most
recent
raw
data.
We
we
take
a
smoothed
difference,
lagged
kind
of
most
recent
five
values
or
six
values
and
that's
to
try
and
get
the
the
part,
the
pattern
you
know
stuff
and
that's.
We
went
to
a
lot
more
detail
in
this
deck.
B
Basically
on
what
is
the
pre-processing?
We
do.
What
is
the
model
we
use
and
so
there's
loads,
more
kind
of
detail
there,
and
we
also
have
you
know,
there's
a
lot
of
detail
in
the
readme
and
there's
also
a
python
notebook.
You
know
if
our
one
of
our
big
kind
of
philosophies
is
that
this
machine
learning
should
be
super
open
as
open
as
possible.
There's
nothing
magic
about
it.
B
Do
I
not
trust
this,
and
so
to
that
end,
there's
like
a
python
notebook,
you
can
kind
of
open
a
collab
and
it'll
it'll
walk
through
and
based
on
one
of
our
demo
servers
it'll,
actually
work,
pull
the
data
and
walk
through
a
poison
version
of
like
how
this
all
works
and,
of
course,
in
the
agent
it's
the
implementation
is
much
more
efficient.
It's
in
c
it's
a
little
bit
different
and
but
the
general
approach
is
all
in
here
and
you
know
I
I'm
always
keen
to
get
feedback.
B
A
A
B
A
B
B
Once
you've
claimed
your
node
and
then
you
know
fe,
I
would
any
any
kind
of
feedback
would
be
great.
I
would
love
people
to
kind
of
jump
onto
the
forum
post
and
give
some
feedback,
and-
and
we
also
or
you
know,
we
have
a
discord
and
we
use
github
discussion
so
wherever
it
kind
of
suits,
please
feel
free
to
to
kind
of
reach
out,
and
I
would
love
to
talk.
B
I've
got
a
special
ml
channel
in
the
discord
where
I'm
always
trying
to
get
people
to
talk
to
me,
and
the
last
kind
of
shout
out
is
just
a
big
thanks
to
we
are
an
open
source
agent.
We
actually
use
the
dlib
machine
learning
library,
which
is
itself
an
open
source
project.
So
it's
always
kind
of.
We
always
want
to
make
sure
that
we're
calling
out
we're
building
on
basically
the
shoulders
of
d-lift
actually
for
the
hardcore
ml,
algorithms
and
and
then
kind
of
just
the
team
itself.
It's
again
a
general
ml
thing.
B
It's
very
cross-functional.
We
have,
you
know,
really
really
clever,
see
people
who
are
like
c
engineers
who
work
on
the
agent.
Then
we
have
product
guys
who
are
actually
bringing
it
all
together
to
make
sense
and
lots
of
front
end
stuff
for
all
those
nice
kind
of
charts
and
also
lots
of
ux
stuff
as
well,
which
is
the
ux,
sometimes
is
the
hardest
part
of
all
this.
B
The
actual
you
know
producing
the
ones
and
zeros
sometimes
is
is,
is
one
problem,
and
then
the
ux
is,
if
is
as
hard,
if
not
harder
in
some
ways,
and
then,
of
course,
we've
got
lots
of
back
end
stuff
going
on
to
it
within
that
data
cloud.
So
there's
a
kind
of
I
think
we've
covered
the
whole
kind
of
range
of
of
roles,
basically
on
on
this
project.
A
B
Yep,
it's
it's
free
and
it's
it's
free
forever.
We
that's
one
of
our.
Our
founder
costa
has
a
catchphrase.
He
likes
to
say,
which
is
the
value
is
free,
so
we,
the
the
open
source
agent,
is
free
and
that
data
cloud
is
free
and
the
whole
idea
of
net
data
cloud
is
that
the
whole
point
is
that
the
value
that
you
get
out
of
it
is
free,
and
so
there's
always
going
to
be
a
free
tier
and
it's
and
it'll
always
be
you
know.
B
Eventually
we
will
add,
you
know
commercial
offerings
for
things
like
authentication
or
you
know
typical
enterprising
stuff,
but
the
value
itself
will
always
be
free.
That's
the
main
kind
of
one
of
the
central
tenants
of
the
data
which
I
I
really
was.
I
I
found
that
inspiring,
and
I
kind
of
like
that.
So
I
like
that,
we
try
and
live
by
that.
A
A
B
Yeah,
so
my
kind
of
main
focus
has
been
well
machine.
Learning
in
general,
I
think,
is
now
officially
becoming
just
another
tool
kind
of
like
anything
else.
So
if
you're,
a
software
engineer
and
it's
easier
and
easier
for
you
to
just
reach
to
machine
learning
as
as
a
tool
like
anything
else
now
this
this
is
this
wasn't
the
case.
You
know
even
five
years
ago,
but
now
it's
it's.
Definitely
much
more
and
being
able
to
get
machine
learning
into
production
is
super
super
easy
and
I
mean
even
myself.
B
Recently
I
was
playing
around
with
you
know:
bigquery
vertex,
ai
and
within
a
couple
dangerously
easy
within
within
kind
of
about
60
minutes.
I
was
able
to
have
an
mln
point
up.
That
would
give
you
a
alert,
ctr
prediction.
Basically,
this
is
one
one
approach
to
potentially
solving
the
alert
fatigue
is
to
actually
think
of
alerts
as
almost
like
an
advertisement
problem
and
build
a
ctr
model,
and
we
have
all
of
our.
B
You
know
our
layered
click
data
in
bigquery,
so
it
was
really
really
easy
for
me
on
my
own
to
basically
train
an
auto
ml
model
in
bigquery,
deploy
the
endpoint
and
almost
hand
it
over
to
the
back
end
team
and
say
here's
the
endpoint.
That
gives
you
basically
the
the
ctor
probability
for
for
these
inputs,
and
so
it's
it's
really
really
getting
easier
to
get
machine
learning
into
production,
and
but
I
also
find
that
in
the
observability
space
as
an
industry,
it's
we're
still
sort
of
very
early
on
on
the
journey.
B
So
machine
learning
is
still
kind
of
this
fancy
new.
You
know
new
feature
and
it's
as
opposed
to
you
know
other
industries
like
finance
or
insurance
or
marketing.
You
know,
machine
learning
is
just
a
core
to
what
they
do
like
risk
models.
You
know
marketing,
ctr
models,
recommendation
engines
and
it
seems
like
observability-
is
kind
of
a
little
bit
behind,
so
we're
only
we're
only
kind
of
starting
on
the
journey
of
machine
learning
being
kind
of
just
another
part
of
the
furniture
in
the
observability
landscape.
B
A
B
Just
really
yes,
so
this
is
a
good
one
if
it's
just
really
spiky
or
radical
all
the
time.
If
that's
normal,
then
that's
gonna
be
okay,
and
so
this
kind
of
touches
a
little
bit
on
the
the
actual.
What
we
do
under
the
hood,
which
is
we
use,
unsupervised
clustering.
So
if
you
think
of
a
metric
that
has
it
has
this,
it
has
a
spiky
behavior
and
it's
kind
of
it's.
It
oscillates
between
maybe
a
spiky
behavior
and
a
a
less
spiky
behavior.
B
B
If
you
could
have
a
toggle,
which
is
just
converted
to
an
anomaly
rate,
then
all
you
really
want
to
see
is
just
flat
lines
everywhere,
which
means
everything
is
normal
and
you
don't
really
care
about
the
behavior
of
it.
You
just
want
to
know.
Is
this
normal,
yes
or
no,
and
so
the
idea
here
is
that
actually
the
machine
learning
model
should
learn,
and
these
normal
behaviors
and
by
normal
normal
here
depends
on.
B
You
know
how
long
it's
trained
on
by
default,
it's
the
last
four
hours
and
but
where
it
can
be
extended
to
be
kind
of
12
hours,
24
hours
and
we're
looking
at
ways
to
kind
of
expand,
extend
it
sort
of
infinitely,
but
in
a
cheap,
efficient
way,
and
so
for
like
for
a
spikey
metric.
If
it's,
if
it's
an
if,
if
it's
just
naturally
spiky,
then
that
will
will
just
be
it'll,
just
be
learned
kind
of
as
a
normal
and
but
it
it
it
definitely
also.
B
It
always
depends
on
the
particular
metric
as
well,
though,
to
be
honest,
and
so
one
of
the
next
big
things
we
want
to
do
is
basically
make
it
so
that
you
know
from
from
anywhere
within
that
data.
You
can
actually
just
look
at
the
anomaly
rate
for
a
particular
metric
and
and
just
decide
yourself
if
you
agree
with
it
or
if
it's,
if
you,
if
you
trust
it
or
not.
B
Basically,
because
that's
the
next
big
thing
we
have
to
do
is
like
say,
I
see
this
cpu
user
metric
here
and
I
can
see
that
this
is
indeed
spiky,
because
I'm
kicking
off
all
these
crown
jobs
and
it's
spiking
up
and
down
it.
On
this
same
chart,
I
should
have
an
anomaly
rate
line,
which
is
basically
a
sort
of
on
the
second
axis,
maybe
or
somewhere,
which
is
like
a
sort
of
a
flat,
a
flat
dotted
line.
B
Maybe
it
bounces
around
five
percent
ten
percent,
but
it
never
really
goes
up
to
fifty
or
eighty
percent.
It
would
only
do
that
when
say
if
these
spikes
all
of
a
sudden,
flattened
out
and
became
a
flat
line.
That
would
be
an
anomaly,
and
that
would
be
that
could
be
a
real
sign
that
actually
it
the
workload
isn't
happening
anymore
like
it
used
to
and
you
you
when
it
flats
out
and
go
smooth.
That's
when
you
want
your
anomaly
rate
to
really
jump
up
and
show
you
actually
oh
something's
different
here.
B
A
B
You
know
you
end
up.
You
you're
going
to
end
up
at
some
point,
looking
at
a
line
where
you
see
you
know
this,
this
red
line
here
and
you
want
to
know
just
this
drop
in
this
red
line.
Is
this
normal
or
not?
You
know
at
the
moment
you
don't
really
know,
because
you
need
to
kind
of
have
some
context,
and
so
you
would
need
to
kind
of
scroll
out
and
look
and
see.
Okay.
No!
Actually
it's
it's!
You
know
it's
not
that
big!
B
A
deal
and-
and
the
idea
here
is
that
actually,
if
you,
if
you
could
have
at
the
same
moment
the
anomaly
rate,
then
that
would
give
you
that
extra
bit
of
context
at
the
click
of
a
button
without
kind
of
having
to
think
too
much
so
and
that's
that's
one
way
where
you
might
sort
of
be
able
to
empower
bottom
up
anomaly:
detection,
where,
throughout
people's
normal
troubleshooting
journey,
you
know
as
they're
going
about
troubleshooting
things.
They
can
actually
also
just
see.
B
What's
the
anomaly
rate
behind
these
lines
and
and
that's
easy-
that's
just
front
end
work.
We
have
the
anomaly
rates
here.
We
just
need
to
kind
of
do
it
in
a
way
this
is.
This
gets
to
the
ux
being
the
hard
bit
like.
How
do
we
do
that
in
a
way
where
it's
not
just
for
every
line?
We
put
an
extra
anomaly
rate
line
and
it
gets
crazy
and
it
gets
confusing,
and
so
that's
the
next
that's
the
hard
bit
we
just
need
to
take.
B
You
know
be
kind
of
mindful
of
the
how
to
how
do
we
make
it
sort
of
seamless
and
easy
for
users?
So
that's
like
a
short
term
and
the
next
next
big
problem
is
alert
fatigue.
I
that's
the
next
big
thing,
so
you
know
this.
This
anomaly
advisor
is
it's
now
way
of
life.
This
is
the
first
version
I
I
have
eventually
I
want
to
get
to
like
even
more
fancy.
You
know
deep
learning,
auto
encoders
and
stuff,
but
we're
not
ready
for
that.
B
Yet
because
we
started
with
some
sort
of
something
sort
of
middle
of
the
road.
So
k
means
a
good
good
work
workhorse
model,
but
I
do
eventually
want
to
build
up
to
more
complex
models
and
but
doing
that
at
the
edge
is
the
tricky
bit.
So
we
need
to
figure
out
some
of
that
stuff
and
but
the
the
one
next
big
problem,
I
really
do
think
we
can.
We
can
solve
our
helps
off
with
ml,
is
alert
fatigue.
So
you
know,
data
comes
with
all
these
alerts.
B
I
don't
have
any
at
the
moment,
but
it
comes
out
of
the
box
with
lots
of
alerts
and
what
what
I
re,
you
know,
what
we
really
want
to
do
is
sometimes
you
can.
These
alerts
might
not
be
configured
exactly
how
you
want
them,
but
depending
on
your
specific
workload,
and
so
what
we
really
want
to
do
is
basically
implement
solve
alert
fatigue
using
ml,
and
this
is
something
that
I
also
don't
think
has
been
done
elsewhere.
B
Just
yet,
for
some
reason
is
in
terms
of
like
you
know,
after
we
show
you
50
alerts
or
so,
and
if
you
give
us
thumbs
up
and
thumbs
down
on
some
of
them,
we
should
be
able
to
make
it,
even
if
you
don't
give
us
thumbs
up
or
thumbs
down.
If
we
show
you
an
alert
and
then
we
don't
see
a
troubleshooting
session
within
20
minutes
after
it,
we
we
can
kind
of
infer
soft
labels
and
stuff
from
that.
You
can
unfair
a
lot
from
alerts.
Did
somebody
click
the
alert?
B
Did
they
even
open
the
email?
You
know
so
there's
lots
of
stuff
we
already
have
that
could
be,
could
be
used
to
make
basically
alert
ranking
models.
That
could
say:
okay,
here's,
here's!
These
I've
got
50
alerts
right
now.
I
can
tell
you
that
if
I
can
tell
you
with
accuracy
that
the
the
click-through
rate
on
each
of
these
alerts
is
less
than
one
percent
we
could.
We
can
then
automate.
B
You
know
automate
the
routing
of
that
alert
and
so
there's
loads
of
room,
I
think
to
bring
ml
into
alert
fatigue
and
because
it's
a
general
problem
that
we
all
have-
and
I
think
that
it's
there's
definitely
some
some
low-hanging
fruit.
We
can
do
there.
So
that's
like
the
next
big
big
challenge,
while
we're
also
kind
of
iterating
on
the
anomaly
detection
as
a
as
a
way
of
life.
Now
you
know.
A
B
Yeah,
I
think
that,
like
the
major
benefit
is
just
to
try
and
help
to
help
with
the
search
problem.
In
terms
of
you
know,
what
I
like
to
do
is
there's
probably
two.
Two
main
approaches
like
I
like
to
come
in
and
look
and
kind
of
read
the
news,
basically
in
in
our
production
room
I'll
come
in
like
if,
if
this
was
my
production
room-
and
I
was
I
I
was-
I
want
to
kind
of
check
what
happened
in
the
last
six
hours
as
well
straight
away.
B
Here
I
can
see
whoa
something
happened
around
five
o'clock
what's
going
on
here
and
I
can
zoom
in,
and
so
this
is
where
I
kind
of
you
know,
read
the
news
of
my
infrastructure
and
but
then
there's
other
approaches
as
well,
which
is
koster
our
ceo.
He
tends
to
use
this
much
more
kind
of
real
time,
so
he's
already
got
a
hunch
there's
a
problem
on
some
system,
maybe
it's
from
some
alert
and
then
he
flicks
over
into
using
this
in
a
sort
of
a
real
time
approach
to
see.
B
Okay,
in
real
time,
you
know
which
are
which
are
the
things
that
are
most
anomalous
at
this
particular
moment.
So
there's
kind
of
two
approaches:
there's
like
the
real
time
troubleshooting
in
the
moment
it
might
help
and
then
there's
the
more.
You
know
more
kind
of
more
passive
approach
where
you
come
in
and
check
it.
B
It's
monitoring
so,
but
instead
of
instead
of
kind
of
starting
with
300
charts
and
2000
metrics,
and
it's
up
to
you
to
decide
where
to
click
and
you
can,
we
can
show
you
kind
of
region,
here's
the
most
interesting
things
that
changed
or
that
looked
the
most
strange
in
the
last
24
hours.
Basically,
is
this
something
that
you
you
missed?
Yes
or
no?
Or
you
know
so
it's
it's
trying
to
kind
of
solve
the
search
problem.
Basically,
a
little
bit.
A
Great,
I
think
it's
time
for
our
final
call
for
questions
we
are
getting
to
the
end
of
the
stream.
So
this
is
a
final
call.
Ask
your
questions
now,
but
I
I
assume
that
people,
if
they
you
know
later
on,
realize
that
they
would
have
liked
to
ask
something
and
they
can
reach
out
to
you
on
socials
or
the
forum
that
you
mentioned
and
so
forth.
Yeah.
B
Yep,
wherever
wherever
suits
the
cncf
machine
learning
channel,
is
in
slack
as
well
I'll
be
in
there
or
you
know,
hop
into
yeah
into
our
and
their
community
post
our
discord
or
it's
all
in
the
in
the
deck
and
for
anyone.
That's
really
really
curious
in
the
deck
there's.
Also
this
this
other
deck,
which
goes
into
much
more
detail
as
to
how
it
actually
works.
B
So
if
you
are
curious
about
sort
of
the
machine
learning
side
of
things
and
this
deck
could
be
worth
checking
out,
it
shows
how
we,
you
know,
how
we
actually
featurize
the
data
and
how
it
all
hangs
together
to
get
these
ones
and
zeros
out
the
back
end,
basically
so
and
feel
free
to
have
a
look
there
as
well.
If
you're,
if
you're
curious,
it's
it's
linked
the
deck
but
yeah
feel
free
to
try
it
out
and
I'd
love
to
kind
of
love
to
hear
from
people.
A
Perfect
yeah,
that's
really
great,
and
there
was
a
lot
of
comments
here
already
where
everyone
seemed
very
excited
about
it
and
hopefully
they're
going
to
try
it
out
as
well.
But
nowadays
the
discussion
can
continue
also
in
the
cloud
native
live
slack
channel.
If
anyone
has
anything
to
address
here
as
well,
but
yeah
so
final
call
is
starting
to
be
over
now,
since
we
are
nearing
the
top
of
the
hour
once
again,
any
final
words
or
or
finishing
finishing
sentences
from
you.
B
A
Perfect,
it's
good,
no
demo
effect
this
time,
so
you
can
take
a
breather
perfect
and
thank
you,
everyone
for
attending,
and
thank
you.
There
was
a
great
demo
mentioned
there
again.
So,
as
always
thanks
everyone
for
joining
the
latest
episode
of
cloud
native
live,
it
was
really
great
to
have
a
session
about
how
to
power
up
your
machine
learning.
I
really
love
the
internet
interaction
today
as
well,
and
questions
from
the
audience
a
lot
of
positivity
in
their
room,
really
nice
to
see
that.