►
Description
No description was provided for this meeting.
If this is YOUR meeting, an easy way to fix this is to add a description to your video, wherever mtngs.io found it (probably YouTube).
A
Okay,
thank
you.
Everyone
for
joining
us
today
welcome
to
our
live
webinar
for
cncf
clarity,
bringing
clarity
to
your
kubernetes
artifacts
security,
I'm
libby,
schultz
and
I'll
be
moderating.
Today's
webinar
I'm
going
to
read
our
code
of
conduct
and
then
hand
over
to
alexi
kraftsoff
software
team,
lead
and
zohar
kaufman.
Director
of
engineering.
A
A
Please
also
note
that
the
recording
and
slides
will
be
posted
later
today
to
the
cncf
online
programs,
page
at
community.cncf.io
under
online
programs.
They
are
also
available
via
your
registration
link
that
you
use
today
and
the
recording
will
be
on
our
online
programs
youtube
playlist
on
the
cncf
channel.
B
Thank
you
very
much
libby
for
this
introduction,
so
good
mo
good
morning
good
evening,
good
afternoon,
everyone,
wherever
you
are
in
the
world,
hey,
I'm
zora
kaufman.
I
was
the
co-founder
and
cto
of
port
shift.
It
was.
It
was
a
startup
in
the
kubernetes
security
area
that
was
acquired
one
and
a
half
years
ago
by
cisco
and
together
with
me
today
is
alex
sacraso.
Let's
say,
would
you
like
to
introduce
yourself.
C
B
Okay,
so
today
we
will
talk
about
how
we
will
have
we,
we
can
help
you
bring
clarity
to
your
kubernetes
artifacts,
so
before
diving
into
the
material
that
we
that
we
organized
for
you
today.
I
would
like
to
discuss
the
two
big
mishaps
that
happened
in
the
last
year,
so
one
of
them
is
log4j.
So
look
for
j
is
very
popular.
B
How
popular
every
java,
application
or
microservice
that
is
out
there
is
using,
usually
is
usually
using
loc4j
and
it
has
a
it
was
discovered.
A
very
you
know.
You
know,
I
would
say
enormous
flaw:
er.
It
was
just
like
before
a
christmas.
Last
year
it
allowed
attackers
to
execute
code
remotely
on
the
target
computer,
which
would
let
them
steal
data,
install
malware
or
take
control
of
all
the
old
system.
B
So
there
were
hundreds
of
millions
of
attempts
to
attack
and
the
major
breach
were
disclosed,
and
so,
let's
go
back
to
december
2021.,
I'm
I'm
an
owner
of
such
an
of
an
application
that
is
using
java.
That
is
probably
using
log4j.
How?
How
would
I
know
if
I'm
vulnerable
or
not,
if
I'm
actually
using
log4j
or
not?
So
it's
it's
a
good
question.
We
will
answer
it
in
a
moment.
B
Another
very
big
happening
or
miss
happening
is
the
dependency
confusion.
So
it
happened
again.
It
was
publicized
on
september
last
year
by
a
researcher
named
alex
pearson,
so
he
wanted
he.
He
is
a
a
nice
guy
tried
to
to
to
hack
into
companies
by
you
know
by
by
contract,
so
letting
them
know
that
he's
trying
and
winning
winning
money
if
he
succeeds
and,
of
course,
disclosing
everything
that
he
is
doing,
and
so
it's
all
legal
and
everything
is
fine,
so
he
tried
to
to
do
it
using
packages.
B
B
So
he
had
a
very
nice
trick
of
letting
him
know
that
somebody
is
using
his
code.
He
he
did
encode,
he
encoded
all
the
information
of
the
host
and
developer
and
everything
inside
a
dns
request
that
was
sent
to
him,
and
then
he
know
if
such
a
dns
request
followed
through
then
he
know
he
knew
that
that
his
code
is
running
somewhere.
B
So
the
first
thing
he
tried
is
a
typo
squatting.
It's
an
attack
that
leveraging
typos.
So
I
I'm
taking
a
very
popular
package,
I'm
doing
like
a
minor,
typo
and
uploading
in
this
package
in
this,
with
this
typo
in
the
public
repository.
So
if
a
developer
is
instead
of
q
web
that
is
depicted
here,
he
just
prints
q
web
with
a
typo.
Then
maybe
he
will
use
my
version
of
the
library.
So
this
was
not
so
successful
and
then
he
thought
about
something
a
much
more
much
more
clever.
B
So
there
are
package
managers
that
are
used
widely.
You
know
within
within
different
languages.
So,
for
example,
there
is
a
pip
of
a
python
is
using
a
pipe
which
is
python
package
index
and
these
package
managers.
If
they
are
giving
the
relevant
option
in
with
pipeline
with
minus
minus
extra
index
url,
then
they
are
searching.
Also,
the
public
repositories,
and
not
only
the
private
ones,
for
the
packages
and
they
are
doing
something
that
sounds
logical.
B
B
So
if
someone
is
using
this
parameter
and
this
package,
then
they
will
use
the
alex
package
and
not
their
own,
so
he
was
not
sure
if
it's
going
to
work
the
way
that
he
knew
which
packages
are
used
privately
is
using
in
in
javascript.
You
have
a
finally
made
package.json,
so
it
contains
the
name
of
all
the
javascript
product
dependencies,
so
some
of
them
are
public.
Some
of
them
are
private.
B
And
while
you
trust
someone
someone
code,
then
they
can
do
anything
on
your
machine.
So
this
was
a
very
you
know,
very
famous,
very
famous
incident,
and
it
raises
the
question:
how
do
we
know
which
packages
we
are
actually
using?
So
we
know
that
we
wanted
to
use
the
private
ones
but
which
ones
are
actually
used.
B
B
We
will
introduce
an
an
open
source
named
cube
clarity
and
review
its
high-level
architecture,
do
a
a
cool
demo
and
also
talk
a
little
bit
about
the
roadmap
and
of
course
we
will
be
happy
to
answer
any
questions
that
you
will
have
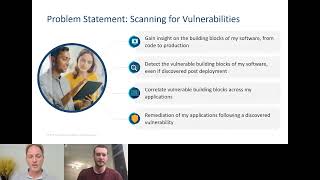
so
problem
statement.
We
want
to
scan
for
vulnerabilities,
and
so
the
first
thing
that
we
want
is
to
know
the
building
blocks
of
our
software
so
which
packages
are
we
really
using
and
again
think
about
the
dependency
confusion?
B
It
is
it's
not
it's
such
a
trivial
question.
Second,
we
want
also
to
detect
vulnerabilities
in
these
building
blocks.
So
even
if
it
are,
the
these
vulnerabilities
are
discovered
post-deployment
so
maybe
see
in
ci
cd.
Everything
was
okay,
but
in
runtime
during
runtime
the
log4j
issue
is
discovered,
and
I
want
to
know
that
I'm
now
vulnerable,
then
we
want
to
correlate
all
the
vulnerable
building
blocks
across
my
applications.
B
B
But
we
have
a
few
challenges
before
we
introduce
our
solution.
To
that
we
have.
We
have
a
few
challenges
that
we
need
to
solve.
So,
first
of
all
is
the
vulnerability
detection,
a
challenge
of
a
software
build
of
material
or
in
short,
s-bomb.
So
s-bomb
is
the
base
of
any
vulnerability
system.
So
we
need
to
know
our
building
blocks
and
if
we
know
the
building
blocks,
then
we
we
can
list
the
vulnerabilities
for
each
of
them.
But
it's
not
that
easy
to
know
the
s-bomb
for
our
packet,
all
our
software
applications
and
packages.
B
Some
of
them
are
listed
here,
for
example,
java
are
using
maven
node
is
using
np
ap
npm
python
is
using
pi
pi
and
there
are
gold
models
and
there
are
others,
and
next
the
os
can
also
introduce
vulnerabilities
and
are
different
and
various
os
distributions
and
our
and
also
they
are
package
dependency
information
and
it's
not
while
building
the
image.
Probably
we
will
strip
it.
So
if
we
just
take
the
the
image
that
was
produced
by
our
ci
cd,
maybe
we
lack
this
infrared,
this
information
of
software
bill
of
material.
B
B
B
Some
of
them
are
better
in
specific
languages,
let's
say
python.
Others
are
good
in
javascript
or
ruby
or
node,
and
there
are,
of
course,
various
linux
distributions,
and
maybe
one
scanner
is
very
good
at
detecting
vulnerabilities
in
the
os
level,
but
is
not
that
good
in
scanning
javascript.
So
we
try.
We
need
to
combine,
let's
say,
a
few
scanners
best
of
breed,
but
each
of
them
has
their
own
format
and
maybe
also
their
own
way
of
ingesting
the
software
bill
of
material.
B
Phases
of
you
know
of
the
cicd,
there
is
a
source
code
and
then
it's
pushed
to
a
git
repo,
and
then
we
compile
it
and
build
images
and
then
deploy
and
then
have
it
in
runtime.
So
each
of
these
stages
is
adding.
Actually,
software
is
adding
each
of
is
adding
a
place
where
new
vulnerabilities
can
be
introduced
and
may.
Where
should
we
scan?
So
if
we
scan
in
all
stages,
maybe
we
are
doing
excessive
work.
B
So
if
we,
a
good
solution
that
to
the
challenges
that
we
already
described,
should
should
answer
the
question:
where
should
we
store
the
s-bomb
and
vulnerability
information,
how
our
applications
are
affected
by
new
vulnerabilities
that
are
discovered
and
we
we
should
be
able
to
traverse
this
graph
very
easily.
So
if
I
have
an
application,
I
should
quickly
know
which
resources
and
packages
is
it
using
and
which
vulnerabilities
are
encompassed
there
and
also
the
vice
versa.
C
A
C
A
C
C
Basically,
a
pluggable
infrastructure
to
plug
your
own
or
the
popular
solutions
for
s-bomb
generation
and
also
from
vulnerability
scanning,
and
so
that's
the
plug-able
and
universal
scanner.
You
can
call
it
so
after
that,
after
we
scanned
all
the
resources,
a
bunch
of
directories
and
images.
Eventually,
we
want
to
group
them
logically
under
certain
applications.
For
example,
I
have
my
kubernetes
cluster
and
I
have
a
pod
that
consists
of
five
containers.
I
don't
know
some
heavy
logic
or
some
somebody
decided
to
do
it.
C
C
S-Bomb
formats,
they
support
a
lot
of
metadata,
actually,
on
top
of
it
and
so
to
address
the
scan
stages,
we
can
split
like
we
said
we
splitting
the
content
analyzer,
we
call
it.
The
content.
Analyzer
will
eventually
generate
the
s-bomb
using
several
s-bomb
generators.
It
will
understand
what
packages
a
consists
from
your
in
your
image
or
directory,
and
the
output
will
be
if
the
input
is
an
image
or
a
file
system.
C
The
output
will
be
an
s
bomb
and
this
s
bomb
can
be
used
as
the
input
for
the
vulnerability
scanner,
and
these
are
the
two
main
components:
the
content,
analyzer
and
the
vulnerability
scanner
and
which
again
I'll
show
you
in
a
second.
They
all
consist
of
a
parallel
analyzers
and
scanners,
and
these
are
the
two
building
blocks
that
we
use
across
all
our
solution.
C
So
the
first
one
is
the
content
analyzer.
So,
as
I
said,
the
input
can
be
an
image
or
directory,
and
then
we
need
to
actually
the
plugin
or
the
converter
needs
to
convert
it
into
format
of
each
analyzer
and
you
we
can
also
put
s-bomb
as
an
input.
So,
for
example,
if
I
want
to
analyze
my
base,
ima
os
base
image-
and
I
want
to
put
the
s
bomb
of
the
code
of
my
application,
I
can
merge
the
the
s
bomb
of
the
image.
C
That
you
started
from
and
the
your
logic
that
is
on
top
of
it
and
of
course
we
need
to
merge
the
s
s-bomb
result,
because
there
can
be
duplications
and
probably
multiples.
Analyzer
will
find
the
same,
so
we
need
to
flatten
and
we
will
show
exactly
who
found
what
and
which
one
of
the
analyzer
missed
them,
and
the
same
concept
goes
for
vulnerability
scanners.
C
We
we
basically
can
scan
a
directory
right
away
or
we
can
use
the
s
bomb
that
produced
in
the
previous
phase
by
the
content.
Analyzer
and
again,
we
need
probably
to
format
it
to
each
scanner,
how
it
expects
it
in
order
to
scan
the
s-bomb
or
the
directory
for
vulnerabilities
and
again
it
scanner
outputs,
the
vulnerabilities
in
different
format,
their
own
private,
json
or
popular
standards.
C
Maybe
like
cyclone
dx,
but
eventually
we
need
to
format
and
merge
them
all
to
get
the
clear
result
of
all
the
scanners
who
found
which
vulnerabilities
and
some
filtering
logic,
of
course,
to
get
the
final
result
and
you
can
mix
and
match
and
spread
the
these
two
building
blocks
across
different
phases.
So,
for
example,
you
can
analyze
your
code
when
you're
building
the
application.
C
I
mean
the
images
and
how
they
belong
to
application,
and
how
can
I
traverse
the
object
tree,
that's
or
showed
meaning?
How
can
I
see
what
application
has
have
which
images?
Then
these
images
consist
of
which
packages
and
these
packages
links
to
vulnerabilities
and
any
way
you
can
just
imagine
in
this
tree,
and
so
that's
a
high
level
architecture
of
the
whole
solution.
Basically,
we
integrate
with
cicd
pipelines,
like
I
showed
you
with
the
scli
using
two
commands
scan
and
analyze.
C
We
have
a
user
interface.
I
will
show
you
in
a
second
that
the
user
can
interact
with
and
we
have
a
database
of
s-bombs
just
to
cache
stuff,
because
we
saw
that
the
heavy
logic
is
to
fetch
and
extract
the
image
and
to
go
over
all
the
layers
to
understand
exactly
the
content.
So
we
keep
this
database
for
better
performance
and
I
will
show
you
in
a
second.
C
What
is
the
benefit
of
it
and
we
have
the
runtime
scan
orchestrator
that
basically
spins
the
job,
a
kubernetes
job
for
each
unique
image
in
the
target
namespaces
and
that
I
want
to
scan
and
once
each
job
is
complete,
the
scan
and
the
analyzing.
Again
we
have
these
two
building
blocks,
also
in
our
jobs.
So
the
repo
the
results
are
reported
back
to
the
back
end
stored
in
the
database,
and
so,
if
I
have
this
one
pod
that
consists
from
image,
one
and
two
two
jobs
will
be
created
for
each
image.
C
If
I
have
these
two
replica
this
spot
in
two
replicas,
so
I
will
do
the
same
thing
I
mean
just
once.
I
will
spin
only
two
jobs
in
total,
each
one
for
a
unique
image
in
the
container.
So
what?
What
is
it
good?
For
so
we
saw
that
the
scans
are
much
faster
now
because
to
if
you
have
already
the
s
bomb
which
again
the
main
consumer
to
produce
it.
C
So
we
bet
on
one
scanner
to
be
the
best
and
then
another
scanner
became
the
leading
one
and
we
needed
to
change
everything
and
we
said
hey:
why
not
just
plug
in
more
and
more
scanners
and
then
we'll
have
the
optimal
solution
and
we
actually
saw
that
we
got
the
highest
detection
percentage.
This
method
and-
and
I
mentioned
serverless
again
and
so
cool.
So
let's
go
to
to
the
demo
and
show
you
so
here
is
the
the
repo
and
cube
clarity
under
open
clarity
and
with
some
other
interesting
projects.
C
And
so
basically
it's
everything
that
I
described
and
it
lists
all
the
features
and
all
you
need
to
do
to
have
it
running
in
your
kubernetes
cluster.
You
just
need
to
add
the
helm
repo
and
then
you
can
create
the
helm
values.
You
can
configure
it
as
much
as
you
want.
You
can
set
different
analyzers
or
scanners
and
to
configure
a
lot
of
stuff
there
and
then
just
a
simple
helm,
installation
and
then
what
I'm
doing
here
and
just
port
forwarding
into
into
cube
clarity's
ui
and
I'm
accessing
it
on
a
local
port.
C
And
so
I
hope
the
port
forwarding
is
still
alive,
looks
good,
and
that
should
be
the
the
ui
of
cube
clarity
great.
So,
as
you
can
see,
this
is
the
dashboard
of
cube
clarity.
We
try
to
make
it
as
actionable
as
possible,
meaning
we
don't
flood
it
with
information,
but
all
these
things
are
meant
to
be
a
really
actionable
and
allow
you
to
fix
your
vulnerabilities
and
gain
insight
of
the
components
of
your
software.
C
So,
for
example,
here
we
see-
I
already
ran
a
few
scans
before,
but
here
you
can
see
that
I
have
this
amount
of
vulnerabilities,
my
cluster
and
these
out
of
these
vulnerabilities.
I
have
438,
which
are
fixable,
and
here
we
sort
them
according
to
severity.
So,
for
example,
if
I
have
critical
vulnerabilities,
which
are
solvable
like
you
can
just
click
on
this
and
it's
it
takes
me
to
the
vulnerabilities
page
with
all
the
needed
filters
are
set,
only
vulnerabilities
which
are
critical
and
have
fixes.
I
can
sort
them
according
to
pro.
C
Oh
sorry,
so
here
it
is
only
critical,
but
if
I
sort
them
it
also
also
sorts
them
according
to
the
cvss.
In
this
case,
all
r98,
and
so
the
same
goes
for
for
the
other
severities.
If
I
want
to
tackle
all
the
high
severities
separately.
So
here
you
see
that
I
maybe
want
to
try
to
handle
this
first
and
maybe
the
lower
cvss
core.
C
Again,
the
applications
are
totally
logical
grouping
and
I
will
show
you
how
it's
helpful
in
kubernetes
and
also
non-kubernetes
I
can
see
which
are
the
most
vulnerable
resources.
So
these
are
the
images
that
are
most
vulnerable.
I
have
this
image
with
31
vulnerabilities.
Again
everything
is
clickable
and
I
can
go
to
the
vulnerabilities,
and
I
see
that
my
free
type
package,
for
example,
is
the
most
vulnerable
package
in
my
system.
C
C
You
might
miss
it,
because
what
is
1000
versus
1001.
So
here
we
created
a
new
vulnerability
trends,
meaning
if
you
one
times
count
1000
great.
It
will
be
discount,
for
example,
in
the
next
scan,
if
nothing
new
or
discovered,
you
will
see
a
flat
line
until
a
new
vulnerability
will
be
introduced.
So
this
way
you
will,
you
are
not
distracted
by
existing
vulnerabilities
that
you
already
attended
and
you
only.
C
On
newly
discovered
vulnerabilities,
so
that's
the
dashboard.
So,
as
I
said
here,
we
have
applications,
for
example,
in
runtime
scan
all
these
they
were
detected
automatically
in
this
case.
These
are
pods
that
are
running
in
the
sock
shop.
This
is
the
stock
shop
demo
application
and
it
is
running
the
stock
shop
environment
and
these
are
the
labels.
All
of
these.
C
Fields
and
information
was
filled
automatically
following
the
runtime
scan.
I
will
show
you
how
this
happened
in
a
second.
I
we,
I
didn't
mention
it,
but
we
also
do
cs
docker
benchmark
on
your
images,
so
you
can
see
the
best
practices
of
the
way
you
created
your
image
or
you
missed
something
in
the
docker
file
or
something
like
this.
You
can
choose
it
all,
both
in
ci,
cd
and
in
a
runtime
scan
I'll
show
you
in
a
second
and
of
course,
as
I
mentioned,
you
can
traverse
these
objects.
C
So,
for
example,
I
have
my
userdb
application.
It
has
113
packages.
So
if
I
click
on
this,
this
basically
the
s
bomb
this,
but
I
can
go
first
to
the
resources.
For
example,
I
see
okay.
This
is
the
image
that
the
only
image
that
belongs
to
this
application
and
can
go
up
the
tree
back
to
the
applications,
or
I
can
go
back
to
the
resource
that
I
just
saw.
I
can
see
all
the
packages
of
this
resource
and
I
can
jump
to
the
vulnerabilities
for
this
package.
C
So
this
is
how
I
traverse
the
the
tree
that's
or
showed
in
the
in
the
slide.
I
can
go
in
every
direction,
so
I
can
see
okay,
this
vulnerability,
for
example,
in
the
log4j
example
that
is,
are
gay,
so
I
can
okay,
I've
discovered.
Let's
say
this:
one
is
lock
for
j.
Let's
see
all
the
images
that
are
affected
by
log4j
and
say:
okay,
these
are
the
images
cool.
C
So
I
need
to
probably
if
I'll
fix
the
this
application
research
for
cve
and
this
and
this
so
I
will
know
how
to
what
to
treat
in
my
image
and
again,
if
I
go
going
from
packages-
and
I
can
go
to
the
application
resources,
so
I
sorry
I
clicked
on
drill
down
and
I
forgot
to
mention
in
each
a
line.
If
you
go,
if
you
click
on
it,
you
see
some
more
details
about
it,
and
here
you
can
list
all
the
applications
and
resources
that
use
it
in
details
and
what
were
the
image
hashes?
C
You
can
click
on
it.
Of
course,
it
will
lead
you
to
the
back
to
the
image,
and
here
is,
is
the
interesting
part
where
we
actually
create
a
competition
between
s-bomb
analyzers,
so
we
can
see
for
each
package.
For
example,
if
I
executed
several
analyzers,
I
didn't
mention,
but
we
currently
support
sift
and
the
gomod
dx
cyclomode,
cyclone
dx
analyzers
and
in
vulnerability
scanners.
We
support
a
gripe
and
the
dependency
track
and
we
plan
to
plug
more
and
more.
B
C
C
C
We
will
introduce
a
schedule
scan
really
quick
in
the
upcoming
days,
and
so
currently
the
only
option
is
whether
you
want
cs
docker,
benchmark
benchmark
or
not
so,
for
example,
if
I
disable
it
and
I
just
start
the
scan
and
I
can
select
the
scope
of
the
name,
so
these
names
are
detected
automatically
in
my
cluster.
So
if
I
want
to
scan-
and
I
want
to
add
a-
I
don't
know-
istio
system-
I
can
remove
it
and
I
can
just
initiate
the
scan.
C
So
basically,
what
is
going
on
currently
relates
to
the
high
level
architecture
that
I
showed
you.
Oh
the
discovery.
We
discovered
all
the
pods
in
the
in
the
name
space
we
discovered
the
unique
images,
a
spin,
a
job
for
each
image,
and
then
we
check
in
the
s-bomb
db
and
that's
why
the
result
was
so
quick.
Now,
when
I
scanned
the
more
than
10
images
and
now
and
yeah,
so
I
see
that
13
images
were
affected
by
this
scan.
C
C
Sorry
that
are
affected
by
critical
vulnerabilities,
so
I
have
42
critical
vulnerabilities,
which
I
can
go
there
as
I
can.
As
you
can
see,
we
have
something
that
we
call
a
system
filter
that
show
you
the
context
that
we
are
watching
the
screens
now,
so
we
reuse
the
same
screens.
We
we
don't
put
the
information
in
different
places.
So
now
I'm
focusing
on
the
vulnerabilities
so
instead
of
each
time
going
back
here
and
clicking
on
packages,
so
I
can
go
from
here
to
vulnerabilities
back
to
packages
back
to
affected
applications.
C
As
you
can
see,
all
the
filters
are
set
automatically
here
and
I
can
also
delete
this
filter.
I
can
delete
this
filter
and
going
back
to
normal,
as
if
I
clicked
on
this
screen
so
yeah.
Just
let
me
show
you
if
I
enable
the
cs
document
benchmark
again,
and
so
here
you
don't
see
this
section,
but
if
I
scan
it
again
so
which
should
take
a
bit
longer
because
we
are
doing
extra
work
here,
it's
not
only
s-bomb
and
vulnerability
detection.
C
C
And
again,
all
this
is
under
active
development.
We
changed
this
every
day,
adding
more
and
more
features
to
it
and
so
yeah.
This
time
you
see
the
docker
benchmark,
for
example,
you
can
filter
it,
not
only
vulnerabilities
and
so
docker
benchmark,
not
not
related
to
packages
and
vulnerabilities,
it's
related
to
images.
So
I
can
see
all
the
images
that
have
a
fatal
warning,
for
example,
and
then
again
I
can
drill
down
and
see
the
exact
reasons
for
that.
A
C
C
Name,
for
example,
contains
demo,
and
this
is
my
application,
so
as
you
see
no
vulnerabilities
or
docker
benchmark
or
packages
or
anything
because
I
don't
know
anything
about
it,
I
just
created
it,
and
so
I
want
to
scan
it
in
icli
which
basically
mimics
the
ci
cd,
the
cic,
which
this
cli
can
be
used
in
30d
pipeline.
So
again,.
C
C
C
So
yeah
it
could
take.
I
don't
know
about
several
seconds
or
up
to
a
minute
to
analyze.
Okay,
great,
it
was
quick
to
analyze
the
nginx
image,
and
so
this
actually
produced
the
s
bomb
demo
up
dot
s
bomb,
that's
what
I
did
yeah,
so
you
can
see
it
here.
So
let's
scan
this
s-bomb
file
using
our
scanner.
So
I
can
also
control
the
scanners
that
are
used
for
for
simplicity
and
quickness.
I
will
just
use
gripe
for
now,
so
it
basically
tells
you
to
scan
the
demo
up.
C
Dot
s
bomb
and
the
input
type
is
s
bomb
and
not
an
image
again
I'll
need
the
application
id
here.
I
forgot
to
mention
everything
that
you
see
in
the
ui.
We
have
an
api
for
it,
so
you
don't
have
to
go
to
the
ui
and
stuff
like
this.
You
can
every
we
have
a
swagger
and
a
generated
code
that
you
can
create
your
own
tools,
programmatically
to
fetch
all
the
required
information,
and
so
that's
exactly
what
we
use
in
the
ui.
C
Again
clicking
the
id
yeah,
so
this
also
should
take
several
seconds
and
I
will
show
you
if
I
refresh,
I
will
have
all
this
information
in
the
ui
and
actually
in
my
back
end,
because
I
use
the
I'll
show
you
I'll
use
everywhere,
the
minus
e
flag,
which
basically
tells
you
to
export
the
information
to
this
address,
which
is
currently
localhost.
But
it
can
be
anything
I
just
use
port
forward.
So
if
I
refresh.
C
C
C
So
of
course,
we're
planning
to
integrate
additional
s-bomb,
analyzers
and
scanners,
because
this
is
the
core
of
the
tool
and
the
idea
to
run
as
many
as
possible
and
the
best
that
suits
your
needs
and
programming
languages
and
os
distributions
to
get
the
highest
detection
results.
And
so
we
we
are
working
actively
to
integrate
with
the
with
supply
chain
security
and
seek
store
and
image
signing
and
all
that
tools
like
in
total
cosine.
You
know
the
six
store
elements,
and
so
that's
what
we're
actively
working
on
now
and
of
course,
system
settings.
B
B
C
C
A
C
We
brought
the
remediation
to
the
point
where
we
detect,
which
are
the
vulnerable
elements
and
what
applications
it
affect,
but
I
think
that
it
will
be
great
to
maybe
automate
some
procedure,
like
maybe
the
pen
the
bot
is
doing
in
github.
That
says,
oh,
I
created
already
detected
all
the
fixes
and
I
prepared
the
pull
request
for
you
just
to
prove
it,
and
so
maybe
for
environments
that
they
don't
have
dependable
and
tools
like
this.
Maybe
it
also
can
be
useful.
So
thanks
a
lot
for
the
advice.
A
Okay,
well
with
that,
we'll
go
ahead
and
wrap
up.
Thank
you.
So
much
alexei
and
zohar
for
your
presentation
looks
like
it
was
very
concise
and
everyone
is
pretty
clear
if
you
want
to
share
in
the
chat
any
channels
where
anyone
can
reach
you
or
follow
up
with
any
additional
questions
feel
free
to
pop
those
into
the
chat
now
for
everyone,
and
if
not,
we
will
see
everyone.
The
next
time
around
in
our
in
another
cncf
live
webinar.