►
From YouTube: July 23 2021: DataHub Community Meeting (Full version)
Description
Full version of the DataHub Community Meeting on July 23rd 2021
00:00 Welcome
01:08 Project Updates by Shirshanka
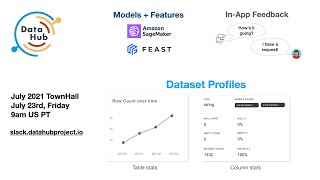
- July Release highlights
08:58 Operability improvements: rollbacks by Gabe Lyons (Acryl Data)
13:19 Demo: Data Observability: Phase 1 by John Joyce, Harshal Sheth, Dexter Lee (Acryl Data)
31:59 Case Study: Building User Feedback into DataHub by @Melinda Cardenas (NY Times)
41:31 Demo: AWS SageMaker integration for Models and Features by Kevin Hu, Dexter Lee (Acryl Data)
53:42 Closing Remarks
A
Cool
welcome
everyone.
This
is
the
july
edition
of
the
data
hub
community
meeting.
We
have
a
fact
agenda
as
usual.
Let's
see
who
do
we
have
first
I'll
do
the
usual.
A
few
project
updates
cover
everything
we've
done
in
july
and
the
upcoming
release
highlights
and
then
we
will
have
three
sessions.
The
first
one
on
data
observability
phase,
one,
the
acura
data
team
will
discuss
what
they've
done
and
what's
coming.
A
A
So,
let's
get
started
a
quick
updates
on
the
community.
A
lot
of
people
don't
know
this,
I'm
just
putting
it
out
there
we
put
out
updates
over
medium.
We
have
a
project
newsletter
that
we
typically
have
like
a
monthly
cadence.
So
please
follow
it
and
share
it.
That's
the
best
way
to
kind
of
have
a
long
form
content
for
improvements
and
changes
that
are
happening
in
the
project.
A
Also,
if
you
want
to
write
for
the
data
hub
project,
definitely
let
us
know
we're
always
looking
for
high
quality
content
so
happy
to
guide
folks
in
writing
their
first
data
hub
blog
post.
The
second
thing
is
again:
you
probably
know
this,
but
we
have
a
youtube
channel.
We
take
all
the
community
town
halls,
create
videos
for
them
and
share
them
out
if
there
are
other
talks
that
you're
doing
at
other
conferences
or
want
to
just
record
a
quick
demo
for
how
you
are
setting
up
data
hub.
A
Let
us
know-
and
we
we
will
be
happy
to
put
it
up
on
the
channel
as
well,
so
follow
these
two
channels,
long-form
content,
video
content
and
create
all
right,
so
project
updates.
The
0.8.7
release
is
coming.
We
like
to
not
release
releases
just
before
the
weekend,
so
we'll
we'll
share.
What's
coming,
we'll
share
the
stats
and
then
we'll
probably
cut
the
release
right
up
to
the
weekend.
A
Committers
or
contributions
16
from
nine
different
companies
and
six
new
contributors,
which
is
great
biggest,
highlights
in
the
last
month,
data
set
stats
profiles,
data
observability
phase,
one
as
we're
calling
it
is
going
to
be
part
of
this
release
and
the
sagemaker
integration
for
models
and
features.
Both
of
these
are
things
we're
talking
about
today,
so
I
won't
take
up
time
and
then
there
are
a
few
other
highlights
and
three
tracks
as
usual.
First
product
improvements,
second
integrations
and
third,
some
developer
experience
improvements.
A
So,
let's
get
into
it.
But
before
that
some
quick
call
outs,
we
have
kind
of
an
interesting
first
commit
from
way
at
linkedin.
Remember
last
time
we
discussed
deprecating
the
ember
code
base
and
officially
announcing
that
we're
all
on
react.
Moving
forward
so
way
recently
sent
over
his
first
commit
and
it's
amazing
to
see
when
a
lot
of
files
get
deleted,
because
that's
the
best
way
to
keep
code
clean.
A
He's
really
giving
the
data
hub
product
a
run
through
the
ringer
finding
so
many
interesting
issues.
So
thanks
for
doing
that
and
giving
us
great
suggestions,
also
sending
prs
over
github
to
improve
the
product,
that's
the
best
kind
of
contribution.
So
thank
you
for
doing
that.
James
lamb.
He
recently
joined
and
spot
hero.
I
think
and
then
started
diving
into
looker
right
away
and
started
improving
the
code
as
well.
A
So
thank
you
for
doing
that,
and
then
there
are
some
veterans
like
remy
and
frederick,
who
are
continuing
to
help
and
coach
newcomers
both
on
slack
as
well
as
on
github.
So
thanks
for
doing
that,
some
new
collabs
are
coming
up,
so
he
and
toffee
ibrahim
and
chris
colson
are
starting
to
collab
on
a
redash
integration
which
is
amazing
to
watch
so
contact
them.
If
you
want-
and
I
know,
redash
was
a
commonly
requested
integration-
so
definitely
reach
out
to
them.
A
If
you
want
to
make
sure
that
it's
going
to
work
for
your
environment,
we
have
we
had
a
contribution
for
adding
functional
testing
to
the
front
end,
which
was
great.
We
had
always
wanted
to
add
these
kind
of
tests.
Didn't
get
enough
time,
and
so
it
was
great
to
collaborate
with
van
54.
I
think
it's
van
shew
from
australia
who
added
functional
testing
to
the
front
end.
I
think
we're
using
cypress
for
that
right.
Gabe.
B
A
Let's
continue
to
keep
that
going
all
right.
A
couple
of
quick
call
outs
on
the
product
improvements
track:
we've
got
the
business
glossary
feature
that's
been
incubating
for
a
while,
so
there
have
been
some
improvements
over
the
past
month.
It's
still
not
ga,
yet
there's
still
a
few
things
that
we're
collaborating
with
the
saxo
bank
team
on
so
probably
be
a
full
reveal
kind
of
in
the
next
town
hall,
most
likely
in
terms
of
what
it
does
similar
story
with
schema
history.
A
A
A
All
right
on
the
integration
site
was
kind
of
interesting.
As
I
looked
at
all
of
the
different
improvements
that
came
in
it's
pretty
much
across
the
board,
every
single
integration
got
better,
which
is
great
because
that
means
none
of
these
connectors
are
stagnating
and
not
getting
used.
So
we've
actually
had
tons
of
improvements.
A
lot
of
improvements
on
the
dbt
and
looker
integrations
in
particular,
but
also
small
improvements,
all
over
the
stack.
A
A
It's
not
a
turnkey
recipe,
but
at
least
it
tells
you
how
to
get
it
done,
especially
if
you're
running
on
aws
and
you've
got
an
rds
backup
how
you
can
restore
your
elastic
search
indexes
and
your
neo4j
indexes
from
those
backups,
and
there
is
one
more
thing
that
gabe
was
dying
to
share
with
you
all
so
I'll.
Let
him
go
for
it.
B
B
Maybe
you
ingested
some
data
that
you
don't
want
to
expose
to
users,
or
maybe
you
overwrote,
some
good
metadata
in
these
cases
you
might
want
to
roll
back
an
ingestion
run
and
either
delete
some
updates
that
you
made
or
delete
entities
entirely,
so
we've
added
some
ci
command
or
cli
commands
to
help
make
this
a
little
bit
easier
for
you,
and
I
can
just
give
a
brief
demo
of
that
now,
so
you
can
see
what
it's
like
to
roll
back
congestion
rounds
all
right.
Let's
do
that.
B
So
in
this
demo,
let's
we're
going
to
do
some
live
deleting
of
data,
and
hopefully
I
don't
delete
my
whole
computer.
So,
looking
at
my
data
hub
here,
you
can
see
that
I
haven't
adjusted
a
very
bad
field
during
a
ingestion
run,
and
you
know
I
might
wanna,
I'm
gonna
wanna
get
rid
of
this.
So
now
the
flow
is,
I
can
go
to
my
command
line
and
I
can
say,
github
run
ls,
so
this
command
will
go
to
data
hub
and
see
what
recent
runs
have
been
made.
B
Each
time
we
do
ingestion
we'll
create
a
unique
run
id
and
attach
that
to
all
the
metadata
we
ingested.
So
I
can
see
here.
The
recent
runs
that
I've
done
and
a
little
profile
about
them.
So
I
think
I
know
that
the
most
recent
run
I
did
was
good
and
I
think
that
the
bad
data
got
in
a
small
run
where
I
was
just
trying
to
patch
a
little
bit
of
metadata,
but
to
make
sure
I
can
go
run
datahub
run
show,
and
this
will
provide
a
more
detailed
look
at
this
individual
run.
B
So
I
can
see
how
many
aspects
were
updated
and
also
a
sample
of
the
metadata
that
was
updated
in
that
run.
In
this
case,
I
can
see
that
the
schema
metadata
of
this
logging
events
entity
was
updated,
so
I
can
be
confident
now.
Okay,
this
is
the
run
that
brought
that
bad
data
in.
In
that
case,
I
can
then
say,
datahub
run
rollback
enter
that
run
id
and
it
will
go
through
and
revert
those
changes.
B
So
we
reverted
the
schema
metadata
on
the
logging
events
entity
and
when
I
go
back
to
my
data
hub
and
refresh
the
page,
I
will
see
when
schema
metadata
that
I
had
ingested
before
that
now
shows
up
and
is
now
indexed,
and
I
get
my
my
good
data
back.
If
I
were
to
revert
the
run
that
created
this
entity,
the
entity
would
be
then
deleted
entirely.
B
C
A
D
A
A
The
these
obviously
work
for
batch
ingestions,
because
a
batch
injection
produces
a
run
id
that
is
attached
to
everything
that
was
ingested
in
that
one
run.
This
is
now
produced.
The
run
id
now
gets
attached
to
every
event
that
gets
produced
and
is
indexed
in
elasticsearch
for
these
previews
and
as
gabe
described,
the
rollbacks
will
kind
of
revert
changes
on
a
per
aspect
level
awesome.
So
now,
let's
get
into
the
first
talk
of
the
session,
which
is
data,
observability
phase
one,
and
we
have
the
team
here,
but
before
we
get
started.
A
Okay,
great,
so
we
have
a
few,
but
a
lot
of
you
are
new,
so
quick
reminder
of
what
happened
in
february.
We
actually
did
a
live
survey
and
shared
out
a
few
mocks
about
where
we
thought
data
hub
could
go
in
terms
of
an
observability
perspective
on
top
of
the
metadata,
and
we
had
come
up
with
some
mocks
and
we
shared
it
out
with
the
community,
and
we
asked
for
feedback
and
we
even
shared
out
the
results
of
the
survey.
A
A
We
also
got
a
lot
of
feedback
that
people
couldn't
wait
for
it.
They
wanted
to
have
it
and
they
wanted
to
work
with
us
in
storyboarding.
These
use
cases
and
give
us
feedback,
and
that
was
I
think,
february
march
happened.
April
happened
may
happened
and
we
were
busy
doing
a
lot
of
other
work
like
building
out
the
foundations
for
no
code
metadata
and
delivering
a
bunch
of
other
features.
B
Thank
you,
shoshanka,
I'm
going
to
share
my
screen.
If
you
don't
mind,
okay,
can
everyone
see
my
data
hub?
Yes,
okay,
so
yeah
this
demo
is
gonna
be
broken
up
into.
Actually
this
presentation
will
be
broken
up
into
a
couple
parts.
The
first
one
will
be
kind
of
the
product
side
and
then
we'll
go
into
the
engineering
design
portion.
That
dexter
will
talk
about
and
then
we'll
talk
a
little
bit
about
how
to
get
started
using
this
feature
and
herschel
will
leave
that
section.
B
So
we
kind
of
think
of
of
observability
and
this
set
of
features
in
two
buckets.
We
think
of
sort
of
the
proactive
and
the
reactive
bucket
sort
of
the
explorer
versus
operator
use
cases
and
I'm
going
to
talk
through
a
couple
different
use
cases
using
using
this
new
feature,
set
we've
built
out
to
highlight
some
of
the
things
we've
done.
So
the
first
is
the
operator
perspective.
So
imagine
I
you
know
own
an
airflow
pipeline.
That
is
maybe
computing.
B
Some
statistics
I
work
at
the
nih,
so
I
have
a
lot
of
cancer
data,
so
I
have
something
called
compute
larynx
carcinoma
cases.
So
this
is
like
a
a
job
that
runs
periodically
every
month
and
computes
some
information
about
carcinoma
frequency
by
location
by
geography,
and
this
is
something
I
own
recently.
I've
found
that
this
job
has
been
has
been
failing
and
it's
kind
of
interesting
because
I
haven't
changed
any
of
the
code.
B
I
haven't
actually
changed
any
of
the
configurations
about
the
job,
so
I'm
going
to
walk
through
how
I
could
go
about
debugging
this
problem
using
data
hubs
ui.
The
first
thing
is,
you
know,
I'll,
go
and
actually
look
at
a
task,
that's
causing
trouble
and
then
maybe
I'll.
Look
at
the
lineage
view
to
understand
kind
of
where
this
data
is
coming
from
or
what
my
inputs
are-
and
I
can
see
that
there's
this
this
upstream
from
redshift
called
lawrence
carcinoma
data
2020.
B
B
3742
rows
has
four
columns
and
then
it
has
the
some
stats
about
each
column.
So
we
have,
you
know
the
min
the
max.
If
it
applies,
we
have
the
null
count.
The
null
percentage,
the
distinct
count
from
the
column,
the
distinct
percentage,
so
id
is
obviously
100,
and
then
we
have
some
sample
values
that
we
can
show,
and
this
is
great
and
all,
but
it
doesn't
really
tell
me
anything
about
you
know
the
last
few
days
when
my
airflow
job
has
been
running
like
I
can't
see,
is
this
healthy?
Is
this?
B
Is
this
not
healthy,
and
so
really
what
you
need
to
make
that
determination?
Is
you
need
a
picture
of
the
data
set's
history
right?
You
want
to
see
how
this
data
set
evolves
over
time
over
its
life
cycle,
and
so
we
added
is
what
I
think
is
a
really
powerful
tab,
which
is
called
historical
and
basically,
what
this
shows.
You
is
the
profiling
history
for
this
data
set.
So
I'll
start
with
the
top
here,
where
we
can
look
at
actual
profiling
runs.
B
So
what
this
is
is
snapshot
point
in
time,
snapshots
of
information
about
the
data
set
and
so
immediately.
Looking
at
you
know
just
two
days
ago,
the
row
count
has
a
dramatic
drop
from
3742
to
51,
and
what
I
can
do
is
actually
pull
up
that
profile
right,
so
I
can
go
back
in
time
and
sort
of
time,
travel
and
see
profiling
runs
from
history.
So
let's
say
the
last
three
months
I
want
to
look
at
you
know.
Maybe
I
want
to
look
at
something
from
from
june.
That
may
have
happened.
B
There's
an
incident-
and
this
is
this-
is
also
great
but,
like
I
have
to
dig
through
this
right.
So
this
is
one
view
I
have
to
kind
of
dig
through
this
like
it
would
be
nice
to
have
kind
of
at
a
glance.
Understanding
of
the
data
sets
health,
and
so
for
that
you
can
kind
of
scroll
down,
and
you
can
see
two
sets
two
sections,
so
the
first
is
sort
of
historical
table
stats
where
I'm
showing
how
the
row
count
has
actually
evolved
over
time
on
this
data
set.
B
So
you
can
see
things
look
pretty
good
until
just
two
days
ago,
where
we
had
a
massive
drop
so
something's
up
with
this
data
set,
I
should
probably
go
talk
to
the
maintainer
owner
of
this
data
set
to
understand
what's
happening,
column
count
generally
looks
pretty
good.
We
had
a
little
anomaly
here,
but
pretty
steady
at
four.
B
I
can
also
go
ahead
and
flip
it
to
some
other
columns
and
see
how
these
have
been
acting
in
the
last
month,
three
months
in
this
case,
so
you
can
see
this.
This
patient
age
had
a
had
some
weird
things
going
on
with
the
null
percentage
that
corresponded
to
that
time
when
we
were
in
the
51
row
range.
So
there's
a
couple
things
going
wrong:
you
can
clearly
see
here
and
then
maybe
I'm
looking
at
the
gender
and
the
gender
percentage
actually
had
an
anomaly
in
mid
mid
july,
but
seems
to
have
been
resolved.
B
Now
the
second
use
case,
which
I'll
use
the
same
data
set
to
illustrate,
is
sort
of
the
explorer
the
explorer
case
where
I'm
coming
in
with
the
goal
of
building
a
new
data
pipeline.
Perhaps
I
want
to
build
a
view
on
top
of
this
data
that
breaks
down
carcinoma
cases
by
let's
say
age
I
can
come
in
here
and
I
can
at
a
glance
understand
whether
this
is
a
reliable
data
set
to
build
on
top
of
right.
B
So
maybe
I
see
that
in
the
last
two
days,
holy
cow
like
this,
the
row
count
has
just
been
moving
so
much
so
maybe
I
shouldn't
build
something
on
top
of
this
data
set.
Maybe
this
isn't
providing
that
stable
foundation
that
I
need,
and
maybe
I'm
able
to
go
back
and
see
that
you
know,
even
though,
in
the
past
week
things
have
been
a
little
bit
rough
generally,
this
data
set
has
actually
looked
pretty
good,
so
maybe
it
is
a
strong
foundation.
B
We
actually
collect
stats
that
aren't
even
shown
here
and
aren't
even
displayed
yet,
which
we
plan
to
display,
such
as
column,
value
distributions,
standard
deviations
and
a
few
other
miscellaneous
statistics,
which
I'm
sure
hershel
will
talk
a
little
bit
more
about.
So
that's
that's
it
for
the
product
demo.
I
will
hand
it
off
to
my
colleague
dexter
to
take
you
on
a
tour
of
the
engineering
design.
A
D
This
is
a
tool
that
you
know
a
lot
of
people
in
our
community
actually
already
use,
and
it
has
support
for
you
know,
in
addition
to
the
data
quality
rules
called
expectations,
you
can
also
do
profiling
and
that's
the
thing
that
we're
built
on
top
of.
We
also
support.
You
know
things
like
limit
and
offset,
and
you
know
those
sorts
of
parameters,
so
you
can
help
control
the
amount
of
data
that
you
actually
profile,
the
hens,
control
cloud
costs
and
this
this
actually
works
with
all
of
our
sql-based
sources.
D
So
you
know
bigquery
snowflake,
redshift,
mysql
postgres,
like
any
of
those
and
many
more,
you
can
basically
just
set
profiling
enabled
to
true,
as
you
can
see,
on
the
on
the
right
and
then
you
know,
we
have
a
similar
regex
pattern
that
you
can
use
to.
You
know
decide
which,
which
data
sets
or
which
tables
you
actually
want
to
profile.
D
So
you
know,
if
there's
some
random
testing
data
set,
that
you've
built.
You
probably
don't
need
to
profile
that,
and
so
you
can.
You
know,
skip
that
when,
when
running
profiling
and
then,
as
you
see
on
the
bottom,
when
you
run
ingestion,
it
will
just
automatically
profile
the
the
tables
that
you've
got
there.
D
Things
like
you
know,
histograms
or
for
columns
with
like
low
cardinality.
We
can
do
you
know
frequency
tables
of
all
the
distinct
values.
A
couple
other
things
are
coming
on:
the
data
richness
side
of
things
as
well,
so
stay
tuned.
For
that
that
I'll
hand
it
over
to
dexter
to
talk
about
the
back
end,
cool
awesome,.
E
All
right
so
so
we've
been,
I've
actually
been
adding
quite
a
few
time-based
data
to
our
system,
starting
with
product
analytics
and
and
then
usage
stats
in
the
last
town
hall
in
this
one.
Since
it's
the
first
time,
we
wanted
to
actually
think
about
how
to
store
this
in
a
data
hub
way.
So
the
first
thing
we
thought
about
is:
can
we
just
ingest
it
as
a
form
of
an
aspect
into
data
hub?
So
you
can
see
the
usual
usual
kind
of
path
that
it
just
takes.
E
So
first,
an
aspect
is
ingested,
and
then
you
check
with
my
sequel
whether
there's
an
update
and
update
my
sql
and
if
there's
a
change,
I'm
in
mae
and
then
finally
updates
search
indices
and
when
we
try
to
figure
like
fit
in
this
new
kind
of
data
into
this
system.
We
realize
there's
some
issues
specifically
on
the
my
sequel
side.
So
time
based
retention
is,
is
really
hard
to
set
up
in
mysql
range
queries.
Aggregations
are
much
less
efficient
and
it's
not
optimized
for
high
ride
throughput.
E
E
E
A
Familiar
with
no
code,
this
is
essentially
extending
the
no
code
series
of
annotations
to
add
the
concept
of
a
temporal
or
time
series
aspect.
So
now
you
can
start
emitting
event,
oriented
aspects
that
are
attached
to
your
entities,
but
don't
never
need
to
be
really
looked
up.
Kind
of
in
a
point,
look
up
way.
A
E
So
say
we
get
all
the
the
values
of
the
same
aspect
according
to
certain
filter,
so
in
this
case
a
filter
might
be
equals
like
the
earn
equals
a
certain
earn
so,
for
example,
earn
equals
data
set
one's
earned
or
you
can
put
a
time
range
filter
like.
I
want
all
profiles
that
came
in
in
the
last
seven
days
now.
E
This
allows
us
to
deal
with
very
complex
data
types
because
we
don't
have
to
do
any
aggregations
which
is
currently
powering
the
demo
that
john
just
showed
so
basically
histograms
or
field
values
are
all
just
simple
aspects
that
get
stored
inside
the
index
and
we
just
retrieve
them
now.
The
front
end
is
responsible
for
doing
something
with
the
retrieved
aspect
and
showing
charts
or
showing
tables.
E
The
second
method
is,
is
a
work
in
progress,
but
we
will
release
it
as
part
of
next
really
not
this
release,
but
the
next
release.
We
want
to
create,
like
a
sql
like
api
to
access
aggregated
values.
So
there
are
statistics
that
are
not
like
profiles
where
it's
not
snapshots,
for
example
user
stats.
So
we
constantly
get
ingestion
of
query
counts
and
for
that
to
have
meaning
we
need
to
be
able
to
aggregate
across
certain
buckets.
E
Implemented
awesome,
so
this
is
not
the
end.
This
is
again
just
phase
one,
so
we
have
a
long
way
to
go
so.
First,
on
the
platform
short
term,
we're
going
to
merge
this
in
your
initial
pr
for
adding
time
series
aspect,
add
support
for
aggregations
as
well
as
moving,
but
more
so
we
want
to
connect
more
operational
metadata
streams,
not
just
profiles
from
great
applications
to
data
hub,
and
we
have
a
lot.
E
A
A
F
Oh
hi
and
you're
going
to
show
the
slides
right
sure,
okay,
so
first,
I
just
want
to
thank
you
for
having
me
here
and
thank
you
to
the
data
hub
team
for
being
so
supportive,
as
the
new
york
times
begins
to
integrate
data
hub
so
yeah,
I'm
a
new
grad
engineer
on
the
data
governance,
engineering
team
and
today
I'll
be
talking
about
a
small
but
hopefully
impactful
component,
that
we're
going
to
be
adding
to
datahub,
which
is
a
user
experience
and
satisfaction.
Survey.
F
Just
as
I
imagine,
most
of
these
people
here
are
using
datahub.
The
new
york
times
is
using
datahub
to
have
a
centralized
space
for
consolidating
data
understanding
how
data
is
used
and
discovering
data.
As
the
new
york
times,
data
ecosystem
becomes
more
complex.
Having
a
data
catalog
is
becoming
increasingly
more
important,
which
leads
me
to
the
next
slide.
F
So
some
of
these
questions
are:
when
should
the
survey
pop
up,
if
at
all,
we
talked
about
maybe
using
a
random
function
to
decide
when
it
would
pop
up
using
cookies
to
be
strategic
about
when
the
survey
would
pop
up?
Maybe
it
would
happen
after
certain
actions
or
after
a
certain
amount
of
visits
for
each
user,
and
ultimately
we
kept
the
implementation
for
mvp,
pretty
simple
by
just
having
a
persistent
tab,
that's
always
available,
so
that
way,
users
can
always
take
the
survey
whenever
they
want.
F
F
We
considered
keeping
the
questions
in
the
table,
but
that
it
would
be
pretty
complicated
for
developers
if
they
want
to
have
those
questions
appear
on
the
front
end
we
ended
up
going
with
or
we
will
implement,
having
a
configuration
file
so
that
way,
like
each
company
can
decide
for
themselves
which
questions
they
want
to
use
and
just
plug
those
in
we'll
have
a
constraint
on
that
yeah
in
this
upcoming
slide.
So
here's
a
sneak
peek
into
what
the
front
end
of
the
survey
looks
like.
F
So
on
the
left
side,
you
can
see
some
specific
questions,
but
I
just
want
to
point
out
that
these
specific
questions
belong
to
like
a
broader
category
of
of
question
types.
So,
for
example,
there's
an
emoji
rating
question
to
describe
how
a
person's
feeling,
in
this
case
we're
asking
how's
your
experience
so
far
with
datahub,
but
we
could
also
switch
this
out
with.
How
are
you
feeling
about
this
feature
on
hub?
F
Another
type
of
question
is
a
yes,
no
type
of
question
where
right
in
this
instance
we're
asking
if
users
were
able
to
find
what
they
were
looking
for,
but
you
could
switch
it
out
for
another.
Yes,
no
question
and
lastly,
we
have
a
free
text
response
question
where
right
now
we're
just
asking
broadly,
if
for
people
to
leave
whatever
feedback
they
have,
so
this
could
be
a
spot
for
people
to
report
any
bugs.
They
found
give
suggestions
for
future
features
or
leave
whatever
specific
comments
they
want.
A
F
F
So
we
like
martha,
was
very
kind
and
suggested
saving
the
questions
in
a
configuration
file.
Instead,
so
we
were
able
to
simplify
it
into
just
having
a
survey
responses
table
with
the
response
text.
Question
text,
user
id
yeah.
The
only
dilemma
that
we
foresee
is
maybe
when
later
down
the
line
is
when
we
want
to
maybe
show
these
responses
in
the
analytics
section
of
the
website.
It
might
be
a
little
difficult
because
say
right
now:
objects
are
grouped
together
or
like
if
we
want
to
analyze
objects.
F
We
and
we
want
to
like
select
all
the
responses
that
pertain
to
a
certain
question
text,
say,
for
example,
what,
if
there's
like
two
different
questions,
which
are
essentially
asking
the
same
thing
so
say,
for
example,
how's
your
experience
so
far
with
data
hub
versus
how
are
you
liking
data
hub,
even
though
these
questions
are
essentially
asking
the
same
thing
if
we're
grouping
responses?
According
to
the
question
text,
the
responses
wouldn't
be
grouped
together,
since
the
wording
varies
so
some
not
so
fleshed
out.
F
Ideas
would
be
maybe
adding
a
question
type
column
or
using
nlp
in
some
way
to
group
together.
Survey
response
objects
that
answer
the
similar
questions,
yeah
and
just
a
high
level
overview
of
all
the
parts
that
are
going
to
be
added.
For
this
feature,
a
big
thank
you
to
john
for
drawing
me
a
diagram
last
week
which
helped
me
create
this.
F
Some
of
this
is
still
under
construction,
specifically
in
the
back
end,
but
just
to
give
a
quick
run
through
of
this
diagram
at
the
top.
Is
the
survey
component
with
some
question
components
inside
so
those
would
be
like
the
emoji
question.
Free
text
response?
Yes,
no,
once
the
user
enters
and
submits
their
responses,
the
survey
response
object.
Pdl
is
used
to
make
sure
that
all
the
things
that
we
expect
are
actually
there.
So
the
response
text
the
question
text,
this
information
is
then
sent
to
the
create
endpoint.
F
F
Okay,
it's
sent
to
the
create
endpoint
where
an
even
object
is
then
used
to
communicate
to
the
the
table
that
we
want
to
add
a
new
survey
response
object.
The
get
all
endpoint
would
be
useful
for
eventually
when
we
want
to
have
something
show
up
in
the
analytics
page.
Maybe
we
can
use
that
get
all
endpoint.
F
F
A
If
you
have
any
questions,
feel
free
to
reach
out
to
her
and
give
her
feedback
where
she
is
always
looking
to
improve
the
thinking
behind
it
all
right.
Let's
move
on
to
our
final
big
talk
today,
which
is
announcing
integration
with
aws
stagemaker
for
models
and
features,
and
we
have
some
familiar
faces
and
one
new
face.
Kevin
was
going
to
be
talking
about
what
he's
done,
but
to
start
out
with
is
texture.
E
Awesome
all
right,
so
I
don't
know
I've
told
some
of
you
guys,
but
I've
been
an
ml
engineer
in
my
previous
lives
for
the
last
five
years,
so
I've
been
working
on
recommendations
and
search,
ranking
and,
while
doing
so,
I
had
this
craving
for
for
a
certain
product
to
help
me
build
ml
models
and
succeed
in
my
journey.
So
why
is
that?
E
I
felt
that
training
deploying
maintaining
my
model
are
is
very
hard
and
the
reason
why
it's
hard,
not
just
because
it's
it
needs
thinking
or
needs
creative
thinking
or
something
like
that
it
was.
It
was
a
lot
of
logistics,
so
there's
a
lot
of
information
that
defines
a
model
like
features,
hyperparameters,
metrics
and
so
on,
but
a
lot
of
times
when
we
train
we
do
this
ad
hoc
process.
E
We
have
a
python
notebook,
then
we
train
with
a
bunch
of
different
parameters,
and
you
have
to
try
multiple
combinations
to
find
the
model
that
actually
works
out
at
the
end
and
even
after
deploying
that
model
it
requires
continuous
training
and
testing.
So
you
need
to
test
whether
it's
working
online.
If
it's
not
working,
you
have
to
iterate,
try
out
another
configuration
and
send
it
out
and
and
for
me
oftentimes,
it
was
really
hard
to
keep
track
of
all
these
configurations
that
go
on
and
the
name
configuration
implies.
E
E
It
was
something
called
fax
searches,
which
was
like
a
list
of
all
the
searches
that
happened
in
a
clean
way,
and
we
recreate
some
training
data
and
testing
data
from
it
and
then
train
the
model.
So
just
that
part
of
the
system
we
know,
but
there
are
oftentimes
changes
in
the
upstream
that
can
cause
very
unexpected
effects
on
the
quality
of
the
training
data
sets,
which
oftentimes
also
causes
very
unexpected
model.
Behavior.
E
I
had
one
case
for
for
a
month
we
had
we
lost
millions
of
dollars
at
airbnb,
just
because
there
was
an
issue
with
some
one
of
the
feature
that
that
we
didn't
expect
was
there,
and
it
took
us
two
months
to
figure
that
out
another
issue.
There
was
an
android
bug
where
some
of
the
logging
in
android
was
not
working.
E
We
want
datahub
to
provide
this
end-to-end
lineage,
where
you
can
actually
see
where
all
the
parts
of
the
trading
data
that
you
use
to
train
the
model,
as
well
as
the
data
you
use
to
do
inference
in
real
time
where
it
comes
from
from
the
very
beginning,
and
so
by
pro,
by
providing
this
end-to-end
lineage.
We
save
all
this
logistical
time
of
of
these
practitioners
like
trying
to
figure
out
what's
wrong
with
the
system.
So
I'm
going
to
give
it
up
to
kevin
for
details
on
how
we
do
this.
C
Hey
everybody
nice
to
meet
you
all
so
like
dexter
was
saying
one
thing
that
we
really
want
for
the
mr
ecosystem
is
to
have
this
end-to-end
lineage
from
data
to
jobs,
to
models
and
eventually
deployments
of
those.
So
we
decided
to
start
off
with
aws
sagemaker,
which
is
amazon's
like
managed
ml
operations
platform,
and
the
main
reasons
for
this
was
that
we
had
already
built
some
integrations
with
our
aws
things,
such
as
blue
and
redshift.
C
So
we
had
some
nice
experience
with
their
apis
and
on
top
of
that,
sagemaker
is
a
pretty
well
fleshed
out
platform.
That
really
has
some
deep
lineage
tracking
abilities
and
it's
already
well
used
by
some
of
the
people
that
we've
been
talking
to.
So
we
thought
it'd
be
a
nice
start
for
us
to
jump
into
the
ml.
C
Space
as
for
the
main
components
of
sagemaker,
the
ones
that
we
focused
on
were
first
a
feature
story.
So
features
are
basically
like
the
entities
that
you
would
feed
into
an
ml
model
that
it's
actually
running
making
its
predictions
on
and
sagemaker
has
a
feature
store
that
lets
you
connect
to
say
like
an
s3
bucket
or
their
built-in
streams,
which
lets
you
save
data
both
for
training
your
model
and
also
for
running
inference
online.
C
On
top
of
that,
sagemaker
also
has
this
concept
of
a
job
which
is
quite
similar
to
other
workflow
orchestrators,
and
they
have
a
really
broad
definition,
there's
like
eight
to
nine
different
types
of
jobs,
which
we
all
decided
to
support,
but
you
have
different
jobs
for,
say,
training,
a
model
for
tuning
the
parameters
that
your
model
is
using
for
also
just
doing
basic
things
like
data
processing
and
cleaning
as
well
and
with
jobs.
You
also
have
some
pretty
interesting.
C
Lineage
features
such
as,
for
instance,
one
job
can
spawn
another
job,
which
the
canonical
example
is.
If
you
launch
a
hyper
parameter
tuning
job,
that's
going
to
spawn
a
bunch
of
training
jobs
to
test
out
each
of
those
type
of
frame
loops
that
you're
using
and
finally,
we
have
this
concept
of
an
ml
model,
which
is
the
result
of
running
a
training
job.
C
So
if
you
train
a
model
or
stage
maker
has
a
model
registry
that
will
allow
you
to
edit
through
that
model,
and
let
everybody
in
your
team
see
the
models
that
you're
using
and
on
top
of
that,
they
have
an
abstraction
layer
in
that
you
can
package
a
model
and
later
group
them
together
for
versioning
as
well
and
after
you've
got
a
model
that
you
think
would
can
be
productionized.
You
can
deploy
it
via
something
called
an
endpoint.
C
So
we
had
a
couple
of
bottling
discussions
for
how
we
want
to
represent
these
features
in
data
hub
and
for
future
stories.
We
decided
to
create
this
thing
called
an
ml
feature
table
which
is
a
group
of
ml
features
which
had
already
been
added
to
data
hub,
but
we
also
noticed
that
sagemaker
as
well
as
this
other
feature
store
that
we've
added
support
for
called
feast.
C
So
we
added
that
as
well,
and
the
idea
is
that
each
feature
and
primary
key
store
is
appointed
to
the
source
data
set,
such
as
an
s3
bucket
or
bigquery
table,
which
can
be
both
the
offline
store,
as
well
as
the
online
store
and
the
feature
table
is
going
to
be
an
additional
layer
for
grouping
together.
Your
features
and
primary
keys.
C
On
top
of
that,
we
extended
the
existing
ml
model
config
and
that
we
had
to
link
ml
models
to
their
training
jobs,
as
in
as
it's
done
in
sagemaker,
and
we
also
added
this
concept
of
an
ml
model
group
in
line
with
what
sagemaker
has,
as
well
as
an
ml
model
deployment
which
models
sagemaker's
model,
endpoints
and
yeah.
On
top
of
that,
we
also
added
new
concepts
for
ml
hyper
programs
for
hyper
parameters,
as
well
as
metrics,
which
we
separated
into
training
and
online
ones.
C
And
for
models
we
made
another
screen
showing
for
now
just
training,
metrics
and
hybrid
parameters,
since
sagemaker
at
least
does
not
give
us
any
online
metrics,
but
we
also
have
tabs
for
seeing
which
groups
a
model
belongs
to
other
custom
properties
of
a
model
and
on
a
linear
view,
you
can
see
the
flow
from
say.
The
data
set
that
the
model
is
using
from
the
training
job
that
produces
the
model
and
any
groups
or
endpoints
that
the
model
is
making
or
a
part
of
so
yeah.
C
The
sagemaker
recipe
is
pretty
similar
to
our
existing
ones.
In
terms
of
in
terms
of
like
your
credentials,
like
your
aws
feature
and
your
keys,
it's
the
same
as
say
glue
or
red
shift,
but
we
have
a
couple
of
additional
configs
for
controlling
cranial
access
to.
If
you
want
to
ingest
your
future
groups,
your
models
or
your
jobs
and
for
jobs,
there's
additional
ones
that
you
can
see
in
this
link
for
specific
jobs
that
you
want
to
specific
types
of
jobs
that
you
want
to
ingest.
C
So
yep,
as
for
what's
been
done,
just
a
quick
summary,
so
we
ingest
jobs,
features
and
models,
as
well
as
all
of
the
lineage
that
sagemaker
gives
us
on
that
end,
and
besides
that,
we
have
also
added
a
connector
for
feast,
which
is
another
type
of
feature
story
what's
coming
next.
Is
we've
been
really
looking
into
lineage
between
features
and
model,
slash
jobs
which
would
complete
our
lineage
graph
so
to
speak?
C
We've
been
talking
with
the
stage
maker
team
at
the
aws,
but
it
seems
that
they
don't
have
their
own
native
support
for
that,
but
it's
planned
for
later
this
year,
so
we'll
be
on
that
as
soon
as
as
soon
as
it
comes
out
and
besides
that
we're
also
just
very
open
to
integrating
more
ml
platforms.
Now
that
we
have
these
models
in
data
hub.
So
if
anyone
has
suggestions,
you
know
feel
free
to
message
us
on
slack
we're
just
painless.
A
So
that's
great,
and
I
I
see
that
some
people
are
already
letting
us
know
what
platforms
they're
using
in
their
stack,
and
I
think
there
was
a
pr
on
ml
flow
that
came
in
a
little
bit
earlier.
So
maybe
now
is
a
good
time
to
kind
of
get
back
to
it
and
and
refresh
that
and
merge
it
in
right.
Kevin
yep
cool
there.
So
this
is
basically
it
for
the
talk,
correct.
A
Awesome,
let
us
know,
as
this
release
gets
cut,
if
you're
using
sagemaker,
try
it
out
and
let
us
know
how
it
works
for
you.
We'll
of
course,
have
our
own
demo
pipeline
that
will
be
up
on
the
demo
website,
so
you'll
be
able
to
kind
of
look
at
what
it
looks
like
when
a
real
team
runs
a
machine
learning
model
and
trains.
It.
B
A
We
are
running
low
on
time,
so
let's
skip
that,
we'll
just
put
it
up
on
the
demo,
datahub
project.io
and
then
we'll.
Let
you
know
on
slack,
so
you
can
go,
try
it
out
all
right,
so
a
quick
peek
into
the
future.
I
don't
know
if
everyone
knows,
but
we
have
published
a
roadmap,
and
so
this
is
what
the
roadmap
looks
like
for
this
quarter.
A
We
just
discussed
dataset
profiling
and
data
previews
today
we're
starting
to
work
on
data
quality,
there's
already
a
lot
of
feedback
on
the
our
back
or
the
fine
grain
access
control
for
metadata,
rfc,
we're
continuing
to
work
through
the
feedback
and
starting
to
implement
it
would
love
some
help
on
sql,
parsing
column
level.
Lineage
is
something
we
want
to
get
to.
A
So
if
someone
has
sql
parsing,
you
know
creds
and
would
love
to
work
with
us
on
that
we'd
love
to
collaborate
on
that
one
and
then
also
building
out
integration
with
operational
metadata.
Now
that
we
have
support
for
time
series
data
is
going
to
be
much
easier,
so
we're
looking
forward
to
building
out
that
stack
for
the
next
three
months.
A
In
addition,
there's
also
other
things
that
are
happening,
that
we
didn't
really
put
on
the
roadmap
per
se,
so
there's
going
to
be
continued
advancements
in
the
no
code
capabilities,
including
better
ways
of
serializing.
These
events
and
integrating
with
the
platform
integrations,
are
something
we
generally
don't
put
on
the
roadmap,
because
we
actually
just
try
to
be
agile
and
react
to
what
the
community
wants
and
facilitate
collaborations
or
just
do
some
of
them
ourselves.
A
So
just
a
quick
announcement
integrations
with
redash
and
metabase
are
actually
starting
out.
There
are
folks
in
the
community
that
are
already
working
with
it
message
me
if
you
want
to
collaborate
on
these
integrations
or
want
to
start
a
new
one,
we're
also
starting
to
go
back
and
kind
of
do
a
fit
and
finish
run
on
top
of
the
product.