►
Description
Dexter Lee (Acryl Data) describes how DataHub is being instrumented for supporting performance monitoring use-cases.
Note: This was a session that was scheduled to be presented live at the townhall, but we couldn't accommodate it due to time concerns. Dexter was kind enough to record it later to share with the community.
A
Hi
everyone,
I'm
dexter
from
echo
data
this
session.
I
want
to
talk
about
testing
and
measuring
data
hubs
performance.
Now.
This
is
the
phase
one
for
improving
data
performance.
We've
been
getting
a
lot
of
requests
and
seeing
ourselves
that
some
of
the
bandwidth
and
latencies
on
our
some
of
our
endpoints
are
going
up.
But
as
soon
as
we
started
tackling
these
issues,
we
realized
we
have
no
way
of
measuring
our
testing
performance,
which
is
a
solid
framework
for
like
trying
to
find
these
performance
bottlenecks.
A
So
what
what
happens
in
behind
the
hood
is
in
the
metadata
service?
You
can
just
put
an
ad
with
spam
annotation
and
they
all
open,
telemetry
java
agent
will
send
that
over
to
either
jaeger
or
zipkin.
Based
on
your
configuration
now
for
metrics,
we
decided
to
go
with
drop
wizard
metrics,
although
we
wanted
to
prefer
going
with
open
telemetry
for
everything.
We
realized
that
open,
telemetry
java,
metrics
library
is
still
in
alpha,
so
we
wanted
to
go
with
more
established,
metrics
library,
while
being
able
to
be
more
flexible
and
probable.
A
So
what
drug
wizard
metrics
does
is
any
custom.
Metrics
goes
into
jmx
metrics
and
it's
easy
to
collect
these
jms
metrics,
using
the
prometheus
jmx
exporter
to
send
over
these
metrics
to
prometheus.
Now
for
free,
because
we're
collecting
jmx
metrics,
we
get
custom,
we
get
the
jvm
metrics
in
prometheus
as
well.
So
in
our
example
setup,
what
we
do
is
we
set
setup
and
prometheus
gmx
exporter
on
our
metadata
service
that
sends
over
to
a
prometheus
container,
and
we
also
have
a
graphana
container
that
visualizes
the
metrics
collected
by
prometheus.
A
A
So
we
provide
example,
implementations
for
ingest
search,
browse
and
graph
requests
in
python
and
during
ingest.
The
best
thing
was
that
we
could
use
the
ingestion
library
directly
to
mimic
emitter
behavior
all
right,
so
we
deployed
a
local
data
hub
with
the
default
monitoring
setup
that
we
have
created
for
you
now.
So
that
means
we've
connected
our
data
instance
to
jager
as
well
as
prometheus
and
grafana.
A
And
finally,
the
data
sets,
let's
do
a
search
on
the
data
sets
only
it
makes
a
clean
trace.
Now
you
can
go
to
here,
find
traces
for
the
datahub
gms
service
on
the
graphql
endpoint
and
you'll
be
able
to
see
the
steps
that
required
for
this
search
request.
Now
the
entity
search
request
goes
in
it.
Does
a
search
on
the
dataset
index
extracts
the
result
and
the
graphql
automatically
resolves
all
these
urns
returned
by
the
search
endpoint
to
get
all
the
previews.
A
A
So
this
is
a
great
way
to
visualize
how
a
request
flows
through
multiple
pods
in
our
data
hub
setup
and
what
kind
of
request
goes
in.
What's
the
latest
lead
like
and
so
on?
Well,
the
good
thing
about
this
is
that
we
can
get
a
snapshot
of
how
these
requests
come
in,
but
in
order
to
get
a
holistic
view
of
how
long
each
step
takes,
we
need
to
be
able
to
export
metrics.
So
now,
let's
move
on
to
our
graphana
dashboard.
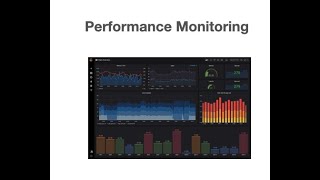
A
A
Now
you
can
see
that
we
have
something
for
get
ingest,
search,
browse
and
graph,
and
so
on
as
long
as
well
as
some
of
the
kafka
metrics,
like
the
lags,
how
many
requests
requests
comes
in
to
the
producer?
How
many
requests
are
consumed
by
the
consumers
as
well
as
some
of
the
topic
lags?
We
have,
which
will
be
very
useful
in
trying
to
figure
out
where
the
bottleneck
is.
You
can
see
that
I've
been
sending
a
few
requests
before
you
can
see
the
latency
breakdown
by
steps.
A
A
So,
let's
see,
let's
move
on
to
load
testing
and
see
how
the
load
testing
affects
these
dashboards
now
starting
a
load
test
using
locust
is
very
easy.
You
have
to
download
locust
it'll,
be
in
a
dock
and
you
can
run
some
of
the
python
locus
files
each
of
these
locus
files.
So
there's
four
inside
here
you
can
see
that
there's
ingest,
search,
browse
and
graph.
You
can
run
each
of
these
recipes
by
running
a
request
and
pointing
to
that
file.
So,
let's,
let's
try
to
run
ingest
now
once
this
runs.
A
It
shows
you
a
local
host
port
that
gives
a
web
interface.
Now
here
you
can
say
how
many
users
you
want
to
spawn
and
then
the
host
you
can
point
it
to
the
gms
instance
that
you
want
to
load
test.
In
our
case
it's
a
local
instance,
so
it
should
be
localhost
8080
and
once
it
starts
swarming
on
it
should
start
sending
the
requests.
A
Now,
once
this
goes
in,
you
should
be
able
to
see
that
the
ingest
endpoint
starts
to
see
an
increase
in
qps,
increasing
latency
and
so
on.
Awesome.
So
that's
the
end
of
the
demo.
Hopefully
this
will
let
us
find
the
production
bottlenecks
on
our
system,
but
also
help
you
guys
monitor
whatever
data
hub.
You
have
deployed
in
your
production
system
as
well.
A
All
right
so
in
the
future,
what
we
want
to
tackle
now,
since
this
is
the
phase
one,
we
want
to
actually
start
improving
performance
of
our
system,
so
there
are
multiple
tasks
that
are
on
us.
First
is
to
increase
ingestion
throughput
and
then
second
reduce
lag
and
ma
consumption.
We
realize
that
if
we
slam
datahub
with
a
huge
number
of
ingest
requests,
we
start
seeing
a
huge
increase
in
the
mae
lag,
so
we
want
to
reduce
that
third
is
to
handle
surges
of
search
graph
requests
gracefully.