Description
Abstract
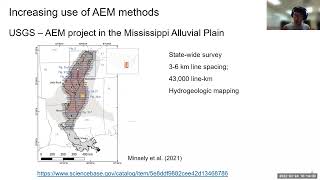
The use of airborne electromagnetic (AEM) data for geoscience applications is rapidly increasing. For instance, in California USA, there is an ongoing AEM project led by the California Department of Water Resources (CDWR), which plans to map out most of the Central Valley of California and some water basins in California. All acquired AEM data and resulting interpretation of the data, which are resistivity models of the subsurface will be publicly available. There are many big initiatives like this project throughout the world. Therefore, it is critical to understand how the resulting resistivity models are obtained from the acquired AEM data, and further equipped with an ability to download and explore the available resistivity data. In this talk, I will first introduce how a resistivity model is obtained from the AEM data then introduce open-source tools that can be used to explore this resistivity model.
Bio
Seogi completed his PhD in Geophysics at the University of British Columbia, Canada, in 2018. His thesis work focused on computational electromagnetics and its application to mining problems. Currently, he is a Postdoctoral Researcher in the Geophysics Department at Stanford. His research focus is on advancing the use of airborne electromagnetic and other remote sensing methods for groundwater management and groundwater science. He continues to contribute to the development of open source software, SimPEG, and educational resources, GeoSci.xyz, for geophysics.