►
From YouTube: GitLab 12.10 Kick Off - Monitor:Health
Description
No description was provided for this meeting.
If this is YOUR meeting, an easy way to fix this is to add a description to your video, wherever mtngs.io found it (probably YouTube).
A
Hi,
my
name's
sara
Wilner
I'm,
the
product
manager
for
the
health
team
and
the
monitors
a
ticket
lab
and
I'm
gonna
walk
her
through
the
12
10
miles
to
plan.
This
milestone
were
focused
on
improvements
in
metrics
and
alerting
in
support
of
incident
management.
The
overall
goal
is
to
continue
to
refine
the
triage
workflow
or
the
process
by
which
an
engineer
responds
to
investigates
and
remediates
problems
for
systems
are
responsible
for
so
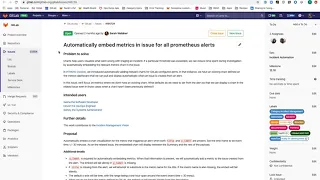
first
up
automatically
embedding
metrics
and
issues
for
Prometheus
alerts.
A
So
Prometheus
is
the
tool
that
we
offer
for
application
performance
monitoring
through
gitlab
already
today,
users
have
the
option
of
embedding
these
visualizations
in
issues
that
they're
using
as
tickets
to
track
work
to
fix
incidents
in
their
systems.
Embedding
these
charts
is
a
manual
process
and
requires
a
number
of
navigations
to
get
to
the
metrics
dashboard
copy,
a
link
to
the
chart
and
then
navigate
back
to
the
issue.
Embedding
charts
and
the
issue
is
helpful-
is
that's,
typically,
the
single
source
of
truths
for
collecting
information
monitoring,
progress,
things
of
that
nature.
A
A
Up
next
we're
going
to
be
improving
the
experience
for
configuring
Prometheus
alerts
in
you
lab
today,
users
can
create
alerts
from
charts
on
the
metrics
dashboard.
However,
depending
on
what
the
numerical
value
of
the
configured
threshold
is
or
how
the
chart
is
formatted,
it
can
be
really
difficult
to
tell
if
that
alert
is
actually
firing
and
I'm,
showing
an
example
right
here.
So
this
alert
is
actually
firing
and
the
thresholds
been
exceeded,
but
it's
not
only
impossible
to
see
what
that
is,
because
the
threshold
for
this
particular
metric
is
zero.
A
Our
remaining
effort
is
going
to
be
dedicated
towards
a
handful
of
bugs
and
performance
improvements
regarding
the
metrics
dashboard
ui/ux,
as
well
as
how
metrics
charts
are
rendered
in
issue
issues.
This
is
especially
important
as
we
continue
to
invest
in
streamlining
the
triage
workflow
thanks
for
your
time.