►
From YouTube: Product Analytics - Building Live v1 Dashboards
Description
We built the upcoming product analytics dashboards for our first internal release in a classic dogfooding sense with the first version of the dashboard editor
A
A
And
then
we
have
our
first
dashboards
created
through
the
designer,
and
this
should
be
working
in
the
document
or
I
shared
for
our
product
analytics
sync
I
shared
also
the
schema
changes
issue,
which
is
the
main
latest
thing
that
Max
has
created,
and
then
it's
merged
this
week,
which
includes
also
all
the
schema
changes
to
the
database,
table
around
sessions
and
daily
users.
So
this
is
what
we
are
running
here
and
on
the
other
hand,
we
have
also
a
short
description:
how
the
saving
will
work
for
all
the
people
watching
this.
B
A
Watching
the
dashboards
in
and
the
same
can
go
also
for
group,
which
is
especially
important
for
optimize,
because
they
are
rather
targeting
groups
first
and
maybe
at
some
point
projects
and
we
are
going
the
other
way
around,
which
would
then
in
reality
right
now.
The
everything
that
I
will
show
today.
Dashboard
editor
itself
is
completely
generic,
so
it
doesn't
listen
to
anything,
analytic
specific.
A
We
feed
paths
and
functions
from
the
outside
and
we
would
do
the
same
for
optimize
and
then
it
would
also
work
there
and
we
are
using
the
read
repo
API
and
we
are
using
the
right
commit
API.
So
those
are
the
same
apis
that
our
web
ID
is
using
that
the
source
code
browser
is
using
and
as
the
other
project,
the
dashboard
repo
in
that
case
is
not
having
any
sort
of
merge
restrictions.
We
can
directly
merge
into
main
for
our
first
version.
A
A
So
that
you
can
set
in
the
dashboard
editor
and
in
the
dashboard
viewing,
though
I
don't
want
to
build
the
dashboards
of
main
I
want
to
view
the
dashboards
of
this
Branch,
edit
those
save
to
that
branch
and
then
at
one
point
basically
say
Okay
I
want
to
create
an
MR
and
match
this
together,
which,
in
real
ability
in
the
dashboard
editing,
will
be
almost
the
same.
Apart
from
one
thing
that
will
be
basically
dynamically
based
on
which
branch
we
are
saving
to.
A
C
A
If
you
edit,
as
long
until
you
are
basically
ready
and
say,
I,
would
be
happy
to
merge
those
changes
now
so
you're,
basically
working
on
a
branch
all
the
time,
because
otherwise
the
the
problem
would
be
the
workflow
as
soon
as
you
say,
I
want
to
add
a
new
widget
and
you
click
save,
and
if
this
would
then
go
always
to
a
new
Branch
or
a
new
Mi,
you
would
end
up
with
tons
of
different
branches
and
Mr.
So.
C
C
If
that
makes
sense,
how
does
more
specifically
asking
about
whether
you
want
to
be
able
to
allow
users
to
always
break
off
the
branch
like
permanently
that
you
know
they
can
just
change
between
versions
of
a
dashboard
while
they're
viewing
one
or,
if
it's
just
for
that
purpose
of
batching
changes
and
then
eventually,
once
they're
happy
with
it?
It
goes
back
to
main
as
like.
This
is
the
final
version
until
I
want.
A
To
revise
it
again,
I
would
rather
say
the
second,
but
I
would
always
leave
it
to
the
projects,
because
if
you
look
at
them
of
grafana
setups
Etc-
and
there
is
maybe
simply
the
Restriction
who
can
change
what,
but
they
don't
have,
they
simply
have
a
list
of
per
dashboard
per
version
of
what
versions
are
existing
but
I?
Think
if
we,
if
we
allow
that,
you
simply
can
every
anyone
who
is
in
a
certain
group.
A
A
C
B
C
A
What
was
our
first
one?
The
first
one
was
always
audience
so
I'm
going
in
what
you
see
here
now
is
already
that
we
have
the
two
dashboards
that
are
in
our
source
code,
so
that
the
gitlit
provided
ones
and
those
two
are
the
ones
that
the
user
has
created
that
are
coming
from
the
other
repo
that
currently
simply
have
an
ID.
A
B
A
And
now
we
want
to
create
a
new
widget
which
then
gets
saved
into
a
different
file
so
that
we
can
basically
reuse
these
multiple
times
across
the
the
different
types
of
dashboards
and
basically
can
feed
options
in
it.
But
as
long
as
we
have
a
visualization,
then
we
basically
can
change
how
it
counts
or
what
it
displays
Etc,
but
it
would
stay
always
the
same
across
multiple
Dodge
dashboards.
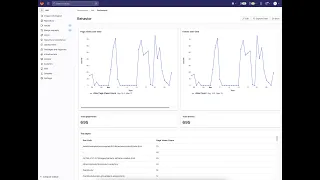
So
looking
at
internal
preview
dashboard,
our
first
one
is
users
over
time,
so
we
have
on
one
hand
daily
active
user
chart.
A
A
Okay,
the
exit
users.
We
want
to
group
them
by
day,
which
is
basically
here
we
see
now
the
preview
on
a
daily
basis.
By
the
way,
this
is
already
pretty
aggregated.
That's
why
it's
so
fast.
It's
the
all.
The
local
queries
take
now
under
20
milliseconds,
most
of
the
time,
which
is
pretty
nice,
even
if
it's
a
limited
data
set,
but
just
having
something
that
responds
so
fast
is
perfect
good.
So
that's
our
preview
data
that
looks
already
nice.
A
A
C
D
A
Not
yet,
but
that's
exactly
where
we
need
what
I
figured
out
to
the
whole
process
is
that
we
definitely
what
we
need
is
I
call
them
inspectors
so
that
we
have
in
reality
like
a
a
file.
What
we
want
to
configure
and
based
in
the
configuration
configuration
we
can
set,
what
type
of
UI
control
we
will
have
for
this,
so
this
will
would
basically
mean
show
Legends
check
box
and
that,
basically,
is
in
the
visualization
designer.
A
Dude
I
hit
save,
it
was
saved
successfully,
let's
not
trust
the
system
and
reload
and
it
works.
The
dashboard
has
saved
that
widget,
so
very
cool
best
audience.
So
this
is
now
the
other
repo
and
there
it
is
it's
not
pretty
fine.
Yet
that's
also
some
things
that
I'm
always
copying
in
to
my
predefinite
and
back,
but
it's
there
good
next
one.
What
do
we
have
next
edit?
Yes,
we
want
sessions.
A
A
A
B
A
A
B
A
Hit
save,
but
by
the
way
here
the
the
visualization
gets
like
a
default
title.
That's
what
we
are
entering
in
the
visualization
and
the
first
thing
that
you
can
edit
now
per
dashboard
is
that
you
could,
for
example,
this
widget
could
then
have
different
input
options
again
at
a
later
point,
but
you
at
the
moment
you
can
at
least
change
the
title.
So
this
is
basically
also
live,
updating
and
changeable.
There
yeah.
C
D
C
A
C
D
B
B
A
B
D
A
B
C
D
C
C
Like
there's
a,
for
example,
I
was
calculating
it
based
on
test
data
set.
Excuse
me
where
it
was
a
average
of
1.4
sessions
per
user,
but
then
it
just
showed
one.
In
that
case,
I
was
like
that
doesn't
help.
It
looks
like
it's
better
here,
but
I'm
curious,
depending
on
the
data
set.
If
it's
that
value
becomes
a
little
bit
less
valuable.
If
that
makes
sense,.
C
A
D
A
D
C
B
C
A
C
B
C
D
B
C
D
B
C
D
To
make
make
there
be
a
single
set
there,
what
if
we
moved
the
three
session
related
single
steps
down
into
their
own
row
and
then
that
would
take
up
enough
space
of
the
sessions
move
down.
It's
like
average
session
duration,
total
sessions,
Beyond
third
row.
What
yeah
there
you
go
with
the
average
sessions
per
user,
then
the
the
table
shouldn't
try.
A
D
B
C
A
B
A
D
So
I
mean
I
I'm
finding
where
we
end
up
hitting
safe.
Today
it
looks
like
this
and
then
before
we
actually
close
the
issue
we
get
another
issue
put
together
about
make
the
decimal
rounding
correct
and
move
the
single
stats
around
so
that
it
looks
like
the
concept
diagram
before
we
actually
officially
close.
It.
C
I,
don't
know
that
it
necessarily
requires
an
issue,
because
another
issue,
just
I,
mean
specifically
for
the
the
visual
bugs
with
the
visualizations.
Yes,
but
as
far
as
the
existing
issue
is
concerned,
it
doesn't
match
it
so
I
don't
think
we
need
another
issue
to
like
relocate
the
single
stats.
If
that
makes
sense,.
A
C
D
D
C
A
A
C
A
B
C
D
A
C
B
C
A
C
C
A
B
C
A
But
without
the
filters
and
without
specific
date,
ranges
everything
else
will
get
merged
in
this
huge
Mr
and
from
that
huge
Mr,
we
can
then
definitely
have
much
smaller
ones
and
the
editing
experience
I
discussed
yesterday
on
today,
with
Brandon
Ezekiel
and
Pavel
from
Optimus.
So
Ezekiel
has
just
merged
today,
the
optimized
component,
which
basically
encapsulates
all
the
VSM
stuff
in
itself,
and
so
you
basically
hand
the
component,
a
group,
a
project,
and
it
will
tell
you
all
the
VSM
statistics
of
that
project.
A
So
the
idea
is
to
build
for
them
use
this
dashboard
designer,
which
is
all
the
functionality
around
moving
the
boxes
and
saving
it
to
a
file
and
I
will
work
together
from
Monday
on
the
physical
to
get
the
Mr
for
this
ready.
So
this
will
be
basically,
we
can
have
a
SQL
working
on
this
right
in
the
specs
and
helping
me
on
that,
so
that
we
get
that
over
the
Finishing
Line
and
as
soon
as
this
is
merged.
A
Generic
dashboard
component
basically
has
then
the
capability
to
edit
and
save
somewhere
the
main
thing
that
we
need
to
get
rolling
now
on
the
backend
side,
if
we
are
moving
forward.
In
my
perspective,
this
looks
really
good
with
this
project
pointer,
then
we
just
need
the
backend
to
provide
us
a
field
on
a
project
in
the
field
on
group
for
optimize,
where
we
can
save
basically
the
reference
to
that
other
project
and
build
the
UI
around
it.
A
A
A
D
B
C
It'll,
be
nice
too,
to
be
able
to
I
guess,
as
we
bundle
changes
and
kind
of
reduce
the
amount
of
Mrs
per
individual
change
right
by
doing
the
branches
like
saving
each
branch
merge
as
an
iteration,
so
you
can
compare
from
like
what's
changed
in
the
dashboard
like
I,
don't
know
if
that's
worth
exploring.
Does
that
make
sense
like
actually
like
the.
A
C
C
Yeah
yeah,
it
makes
sense
because,
if
you're,
if
you're,
already
like,
if
I
built,
One
dashboard
but
I
want
to
iterate
over
it,
and
then
you
know,
10
changes
later
I
have
version.
Two
then
I
want
to
see
like
what's
changed
since
then,
or
if
I
want
to
look
back
to
see
you
know,
maybe
I
did
something
wrong
or
I
just
need
to
compare
it,
because
that's
something
I
found
I
was
doing
often
with
size
ends,
but
I
had
to.
A
What
you
have
here
is
now
this
product
analytics
API,
which
simply
has
now
here
this
hard-coded
project
value,
and
then
it
has
hard-coded
also
the
path
to
product
analytics,
visualizations
and
product
analysis
dashboards.
This
we
could
make
this
also
configurable
in
the
first
iteration
at
a
later
point.
But
the
main
thing
is
here
that
I'm
using
simply
here
main
right
now,
also
as
a
static,
which
means,
if
we
have
a
switcher
at
the
top,
we
could
switch
to
any
kind
of
Branch
or
commit
to
load
from
there
and
yeah
this.
This
would
be
really
nice.
C
A
A
C
A
We
will
tune
out
those
two
paths.
One
is
that
already
in
review
huge
first
iteration
for
the
widget
designer
the
other
one
is
that
we
cut
out
the
first
version
of
editable
dashboards
and
then
the
follow-up
would
would
be
adding
the
filter
adding
more
inspector
stuff
so
that
we
can
really
go
deep
into
such
topics
like
hiding
the
legend
perfect,
perfect
first
example,
so
that
the
component
basically
gets
an
option.
We
get
a
config
file
which
says
yeah
line.
Charts
can
I
will
have
an
option.
A
A
Yeah
that
we
can
build
stuff
really
fast
next
to
each
other,
for
especially
such
static
types,
but
also
they'll,
have
a
good
example
is
for
optimize.
They
will
not.
You
need
a
widget
designer
at
the
beginning.
They
will
have
one
component,
but
they
need
to
set
in
the
dashboard
for
this
component,
always
the
project
that
this
component
should
display
and
and
that's
something
we
should
also
generalize
from
the
get-go
so
that
we
have
like
an
inspector
which
can
say
it's
a
Boolean
or
it's
a
project
selector.
So.
B
D
D
To
be
using,
this
they'd
be
willing
to
contribute
back
some
of
the
features
that
we
both
need
around.
This
is
what
display
and
widgets
looks
like,
because
we
have
lots
of
very
specific
questions
about
our
underlying
data
sets
and
what
we
need
to
do
to
Define
how
a
session
looks
or
a
returning
user,
but
things
about
how
do
I
turn
on
and
off
a
legend.
D
That's
generic
from
product
analytics
and
more
specific
to
front
end,
so
I'm
excited
we'll
be
able
to
solicit
contributions
from
other
people
using
this
and
eventually
we'll
get
that
that
flywheel
of
lots
of
groups
use
it.
So
lots
of
groups
contribute
some
more
groups,
use
it
and
you
know
so
on
and
so
forth.
B
C
Yeah
for
now,
I
have
a
couple
of
follow-up
issues,
just
specifically
for
what
we
need
out
of
the
the
widgets
for
the
internal
preview,
but
I
think
it'll
be
useful
to
go
through
each
visualization,
so,
for
example,
line
chart
and
see
what
options
are
presented
by
e-charts,
for
example,
and
what
we
exposed
to
gitlab,
UI
and
then
yeah
identifying
which
of
those
we
just
have
as
standard
controls.
You
can
modify
in
the
the
the
visualization
designer
itself.
A
So
in
reality,
I
can
take
now
these
files
take
them
into
the
source
code
and
replace
the
the
test
dashboards
that
we
had
so
far
and
basically
use
them
and
delivered
them
straight
away.
So
as
soon
as
we
have
the
connection
of
production
and
have
this
super
special
Mr
with
those
updated
dashboards,
we
should
be
able
to
see
exactly
those
dashboards
that
in
production
next.