►
From YouTube: 2023-08-09 Product Analytics UX/PM Sync
Description
Today we reviewed some future MVCs, talked about how to collapse future filters on the dashboards view and talked SSOT for Product Analytics events.
A
A
And
I'm
going
to
start
with
the
filter
by
user
type
ID.
So
this
is
the
front
end
part.
The
issue
that
we
ran
into
on
some
internal
team
dashboards,
we're
art
asking
users
for
cookie
consent,
because
they're
internal
apps,
and
so
all
users
are
reporting
as
the
same
user.
So
we
have
a
back-end
fix
for
that,
so
that
you
could
filter
out
those
Anonymous
users
and
see
only
users
who
are
given
that
for
tracking.
A
That
lets
us
then
make
sure
that
we're
showing
unique
users,
especially
in
that
default
dashboard
for
audience
so
having
a
way
to
filter
those
out
I
think
is
an
important
use
case
for
this,
for
this
chart
or
for
this
dashboard.
So
we
wanted
to
add
some
user
experience
or
a
way
to
add
do
that
filtering
just
within
the
dashboard
itself
as
the
MVC.
B
Yeah
one
approach
that
we
could
try
looking
into
is
filtered
search,
but
I
feel
like
that's.
Probably
what
we'll
end
up
with
is
a
more
tokenized
search,
where
you
create
say
date,
ranges
and
narrow
into
and
focus
into
the
specific
data
that
you
want
to
see,
and
then
it
creates
a
token
that
is
then
easily
removable.
B
Yeah
so,
basically
like
similar
to
what
we
have
on
our
emers
page
we'd
have
a
input
box.
Here
you
would
click
on
it
and
one
of
the
tokens
would
be
users,
for
example,
and
then
it
would
be
all
users
or
only
like
exclude
Anonymous
users,
and
then
we
could
maybe
even
move
the
date
range
into
that.
But
I
don't
know
if
we
yet
have
a
token
for
that,
so
it
might
be
early,
but
that
could
be
our
Direction
and
I.
B
Think
it's
just
worth
noting
to
say
that
you
know
that
solves
the
issue
of
like
how
does
this
scale,
so
we
can
be
kind
of
like
rough
with
with
our
design
right
now
and
just
get
something
that
works,
and
then
it
will
scale
eventually
because
I
feel
like
once
we
get
to
like
a
certain
critical
mass.
We
can
collapse
all
of
those
into
a
tokenized
search,
yeah.
A
A
A
The
things
that
make
sense
and
then
also
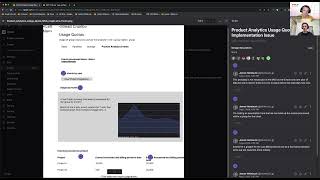
I,
wanted
to
look
at
the
usage
quota
MVC
and
my
super
rough
wireframe
here,
I
built
this
based
on
the
existing
group
usage
quota
page
so
showing
how
many
events
you
consumed,
which
we
think
that
billing
will
be
happening
based
on
events.
So
it's
very
similar
to
like
the
DI
credit
or
CI
minutes
that
they
used
to
be
called
to.
A
Eventually
we
want
to
do
both
and
we
want
to
push
that
project
level
down
into
the
project
itself,
but
for
our
first
iteration
of
this
having
it
in
the
group
usage
quota
page
is
where
it's
going
to
live
to
start
so
we'll
want
to
show
both
of
those
which
one
is
going
to
be
the
easier
to
get,
and
then
we
can
iterate
and
show
the
other
other
either
either
the
sum
of
those
or
the
individual
projects.
Usage
on
this
page.
B
I
guess
it's
a
answer
of
it
depends
and
it
depends
on
how
difficult
it
is
or
how
expensive
it
is
to
actually
calculate
these
I'm,
maybe
completely
wrong
here.
So
don't
quote
me
on
this,
but
I
think
for
some
of
our
other
usage
quotas.
We
use
essentially
cron
jobs
to
go
and
calculate
that
data
beforehand
like
once
off
and
then
show
you
that
calculation,
instead
of
trying
to
fetch
it,
which
I
think
for
something
like
the
number
of
events.
That
also
makes
a
lot
of
sense,
especially
on
this
page.
B
So
it
depends
on
your
how
we,
how
we
basically
get
that
data
but
I,
think
it's
important
at
least
technically,
to
cut
out
the
MVC
and
also
the
final
Vision
to
so
that
we
don't
because
I
I
know
from
talks
that
I've
seen
in
issues
with
like
usage
quotas.
That's
some
of
our
engineering
around.
This
has
kind
of
like
made
a
future
expansion
like
difficult,
and
that's
that's
easily.
B
A
A
You
know
your
number
of
users
is
up
and
the
number
of
events
is
up.
So
it's
going
to
tick
up
but
being
able
to
do
that
long
term.
I
think
it's
going
to
be
really
helpful
for
customers
who
are
trying
to
project
what
their
bill
is
going
to
be,
and
it's
something
that
we
can
then
push
back
into
other
product
analytics
areas
as
well,
or
we
can
take
out
the
products
analytics
kind
of
that
projected
Trend
into
the
future.
B
B
A
Yeah
I
mean
I,
know
I,
say
single
sorts
of
truth
and
that's
probably
going
to
be
click
out
for
this
data.
But
at
some
point
do
we
see
especially
for
historic
data
like
that's
not
going
to
change
again
pulling
that
into
git
live.
So
it's
faster
to
retrieve
and
you're
not
having
to
go
to
the
clickhouse
database
to
get
how
many
events
were
processed
six
months
ago,
because
that
number
shouldn't
be
changing.