►
Description
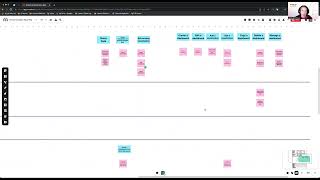
Walk through of the User Story Map we've been using to align on functionality to ship before the Experiment Phase, iterate on during and what comes later.
The Group Direction Page is always the SSOT for what is being developed now, next and later. https://about.gitlab.com/direction/analytics/product-analytics/
USM link: https://app.mural.co/t/gitlab2474/m/gitlab2474/1683661901318/78b61174446edffd4fd91177199b49681fef4402?sender=jheimbuck9080
A
So
this
kind
of
outlines
some
of
the
direction
for
what
we're
launching
in
the
experiment,
phase.
What
I
hope
that
we
can
ship
during
that
phase
before
beta
and
then
what's
coming
with
the
beta,
and
we
have
why
we're
doing
those
things
in
the
order
that
we're
doing
them
I'll
update
the
direction
page
in
the
Epic
after
the
posted
and
just
a
reminder
that
the
direction
page
for
product
analytics
is
really
our
single
source
of
Truth,
so
I'm
going
to
get
that
up
to
date.
A
With
this
as
quickly
as
I,
can
this
user
story
map
is
just
a
mental
model
or
a
way
for
me
to
visualize
that
content
in
that
direction
and
related
to
the
user
stories
to
kind
of
outline
load?
That
user
is
going
to
take
through
the
feature.
So
let
me
know
if
you
have
questions
about
this,
if
things
are
still
not
clear
comment
in
the
Epic
in
the
group's
black
Channel
or
send
me
a
PM
I'm
happy
to
answer
those
so
I'm
going
to
share
with
green
and
ramble
for
a
bit
talking
through
this.
A
So
the
user
story
map
is
just
a
way
to
outline
kind
of
a
flow
of
a
user
through
a
task
or
through
something
like
the
classic
example
of
you're.
Doing
training
of
this
of
learning
about
the
methodology
is.
What
do
you
do
to
get
ready
in
the
morning
and
so
there's
always
a
group
back
search
side
of
what
everybody
does
and
then
kind
of
building
out
mining
things,
grouping
them
into
various
parts
of
people's
mornings
and
then
laying
out
kind
of
a
backbone
of
what
everyone
does
to
get
out
the
door.
A
The
idea
there
is
that
you
can
have
an
ideal
warning
all
the
things
that
you
could
do
if
you
had
two
hours
to
get
ready
between
when
you
wake
up
and
when
you
leave
for
work
or
when
you
arrive
at
work,
and
you
can
start
the
life
things
off
and
understand
what
really
really
required
to
get
down
to
I
need
to
leave
and
be
out
the
door
in
five
minutes.
So
it
kind
of
gives
you
that
Bare
Bones
approach
to
things
so
we've
taken
a
somewhat
similar
approach.
A
So
the
very
top
level
look
at
the
key
here:
real
quick,
the
ACT
activities,
kind
of
the
backbone
path
of
those
and
then
user
tab
within
them
and
where
we're
at
in
the
released
life
of
the
sorts.
I
have
experiment.
Here
we
have
internal
preview
and
then
kind
of
a
pseudo
release
of
what
we
want
to
launch
during
the
experiment
and
that's
the
primary
part
of
the
fox
group
today.
A
So
the
big
activities
that
a
user
is
going
to
need
to
go
through
to
start
their
journey
in
product
analytics,
enabling
product,
analytic,
instrumenting
their
app
and
then
viewing
a
built-in
dashboard.
And
those
are
the
key
things
that
we
had
for
the
internal
preview
and
what
we
have
for
the
experiment
launch.
So
we
either
should
be
able
to
enable
the
feature
for
the
project.
In
this
case.
This
is
going
to
be
a
Hands-On
approach
for
us
to
go
through
and
do
that
and
then
setting
up
the
app
ID.
A
That
should
happen
as
part
of
the
boarding
flow
today.
We're
doing
that
manually
through
a
graphql
call,
we'll
iterate
on
that
and
get
it
to
the
importing
flow
and
then
instrumenting
the
app
importing
the
SDK
and
adding
the
JavaScript
snippet
to
the
page,
adding
a
drop
list
groups
to
any
sort
of
event
that
they
want
to
attract
rack
rather
as
part
of
their
application
and
then
viewing
dashboards,
the
built-in
dashboards
or
what
we're
launching
with
the
audience
Dash
and
the
behavior
Dash.
A
What
we
have
so-
and
you
continue
the
flow
through
there
and
what
we
want
to
launch
as
we
get
into
the
experiment,
is
the
ability
for
user
to
explore
data
and
I've
broken
that
down
into
a
couple
of
different
user
stories.
One
is
the
query,
data
or
really
use
the
visualization
designer,
as
it's
designed
today,
to
dig
into
Data
the
intent
there
is
I.
Have
a
question
I
want
to
answer
and
I
want
to
use
data
to
try
to
answer
it.
A
That's
really
a
one-time
question
that
the
user
story
there,
not
a
I,
want
to
save
it
to
a
dashboard.
The
next
step
in
that
is
creating
a
saved
visualization,
which
is
something
that
I
know.
The
team
is
working
on
now
as
part
of
Explorer
data.
That
way,
you
could
go
back
and
refer
to
it,
and
there
is
not
that
I
can
then
view
it
on
their
dashboard.
A
If
that
I
know
it
as
the
visualization
designer
and
look
at
it
again,
and
we
may
need
additional
user
stories
to
support
that
I'll
I'll
sort
that
out
as
I
go
back
into
the
Epic
they're
managing
your
visualization.
So
once
you
create
something
you
want
to
manage
it
editing
existing
ones
and
again
we're
going
to
probably
need
some
additional
user
stories.
This
might
move
even
into
the
Beta
or
Beyond
of
you
know
the
first
path
that
this
might
be.
A
A
Really.
You
know
some
small
steps
here.
I
didn't
dig
too
far
into
the
work
whoa
itself,
but
naming
the
dashboard
and
then
being
able
to
edit
it,
which
is
really
just
renaming
a
dashboard,
more
steps
in
that
are
going
to
be
below
of
rearranging
tiles
on
the
dashboard,
potentially
even
moving
a
dashboard
into
a
different
project.
A
Copying
a
dashboard
things
like
that,
then
adding
a
safe
visualization
to
a
dashboard
today
that
workflow
is
a
very
manual
one
and
we
may
launch
with
that
as
part
of
the
experiment,
and
that's
going
to
help
us
understand.
Are
our
users
using
and
valuing,
and
are
we
getting
more
weekly
active
users
once
they
can
create
their
own
data
visualization
and
put
them
onto
a
dashboard,
so
we're
really
going
to
key
into
once?
We've
introduced
this
and
we've
walked
you
through
the
workflow.
A
Are
they
creating
the
safe
visualizations,
putting
them
onto
a
dashboard,
and
there
are
more
people
looking
at
that
dashboard
that
that
they
have
their
own
custom
view?
That'll
be
a
good
signal
for
us
that
we
want
to
then
expand
on
that
workflow
make
it
a
UI
bit
which
again
is
already
in
progress,
so
we're
kind
of
making
a
jump
there
or
making
a
hypothesis
there
that,
yes,
that
is
going
to
increase
our
active
weekly
users
and
then
editing
the
visualization
and
then
kind
of
rounding
out.
A
A
We
have
some
additional
stuff
down
here
in
the
later
slices,
as
we
get
into
our
general
availability
and
even
future
considerations
or
path.
Ga
things
like
adding
visualization
from
another
non-product
analytics
data
source
and
editing
visualization
attributes
from
the
dashboard
itself.
Stuff
I
wanted
to
change
the
query.
What
would
that
look
like
so
a
couple
of
things
that
are
happening
there.
A
A
So
if
you
have
any
questions,
feel
free
to
like
I
said
ping
me
in
the
flat
Channel.
Add
a
comment
to
the
Epic
as
we
go
update
them
for
each
of
the
release
lately,
and
hopefully
this
adds
some
clarity
about
the
direction
of
what
we're
doing
in
the
first
experiment
phase
and
then
what
we're
hope
to
launch
during
and
why
we're
doing
that.
What
we
hope
to
learn
thanks.