►
From YouTube: Application Performance Session - 2020-11-24
Description
New User Timing Metric Tooling shown by Denys Mishunov
A
A
B
B
Now
let
me
just
mention
first
of
all,
about
a
couple
of
weeks
ago,
I
think
we've
merged
the
view
performance
plugin
into
our
code
base.
What
does
it
mean?
It
means
that
now
we
can
measure
user
timing
metrics
for
our
view,
components
without
like
with
with
as
little
effort
as
possible.
So
let
me
just
share
my
screen
now
and.
C
B
B
But
technically
this
is
just
adding
name
and
then
the
camel
cased
name
of
the
component,
to
your
components
or
to
the
components
that
you
want
to
measure,
and
then
it
will
automatically
measure
the
start
of
the
bootstrapping
of
that
component
and
the
moment
the
component
got
rendered
on
the
screen.
So
we
are
using
the
before
created
hook
and
the
neck
stick
within
mounted
hook.
B
So
if
you
have
the
performance
bar
enabled
you
will
get
all
sorts
of
things
so
for
this
example,
I'm
measuring
performance
of
three
components-
and
this
is
what
you
get
in
your
performance
bar-
will
develop
developer
tools,
output,
so
all
of
the
components
get
measured,
you
get
the
marks
and
you
get
the
measurements
for
all
the
for
all
of
those
components.
Keep
in
mind,
though,
that.
B
This
plugin
doesn't
wait
for
all
the
sub
components
to
get
rendered.
So
if
you
are,
for
example,
saying
measure
the
moment
my
ide
application
gets
rendered,
it
won't
wait
for
all
of
the
three
components
and
editor
component
and
terminal
component.
It
will
really
be
fired
and
mounted
and,
as
most
of
you
probably
know,
it
doesn't
wait
for
all
the
sub
components
to
be
done.
So
that's
something
to
keep
in
mind.
B
B
This
is
going
to
be
the
first
rendered
a
tree
item
on
the
screen,
and
this
is
what
we
care
about
in
web
id,
because
this
is
the
moment
that
we
can
say:
okay,
the
rendering
has
really
started
and
the
repo
editor
it's
the
editor
for
the
file.
So
in
case
you
get
to
web
id
and
request
a
particular
file
right
away
in
the
url,
for
example
readme
or
I
don't
know,
change
log
or
anything.
B
So
when
we
open
the
editor
for
a
file
right
away,
this
is
going
to
be
component
that
is
fired
and
this
is
going
to
be
component,
that
is,
that
gets
measured.
So
you
can,
as
I
said,
you
can
measure
or
observe
it
with
performance
bar
right
away
in
the
dev
tools.
You
can
observe
it
in
your
dev
tools
and
obviously
you
can
get
all
the
way
to
the
core
and
just
query
those
metrics
in
your
dev
tools.
So,
as
I
said,
this
is
the
this
is
the
web
id.
B
B
If
we
enable
the
performance
bar
so
here
are
all
my
metrics
output
right
into
my
console.
This
is
not
very
in
particular
for
the
web
id,
since
we
have
a
lot
of
performance
issues
with
web
id.
There
are
a
lot
of
metrics
there,
but
normally
you
should
not
have
as
many
metrics
like
unless
you
really
know
what
you're
doing
and
if
we
run
the
performance
performance
profile
in
the
profiles.
B
Tab
of
the
dev
tools,
you
will
see
nice
blocks
indicating
the
duration
of
any
of
these
measurements,
for
example
like
every
component,
every
components,
life
cycle,
duration-
it's
really
convenient,
it's
really
nice
and
gives
the
idea
and
like
if
we
render
the
performance
profile
now
you
will
notice
yeah.
If
this
ever
happens,
the
the
obvious
issues
with
the
performance
in
gravity
will
be
very
obvious.
So
yes,
let's,
let's
zoom
into
this
thing,
so
we
just
we
just
do
things
in
sync,
so
we
fetch
project
data.
Then
we
fetch
branch
data.
B
Then
we
fetch
files
instead
of
doing
those
asynchronously
at
the
same
time.
This
is
we
have
we
already
have
I
the
issue
for
this.
This
is
what
I'm
going
to
work
with,
and
this
gives
a
really
a
good
overview
of
what
is
going
on
with
with
the
things,
and
here
is
in
the
in
the
merge
request
in
the
verge
request.
B
I
prov
I
give
the
example
of
three
components
being
measured,
but
in
production
it
actually
it's
fine
for
me
to
go
with
just
one
component
that
is
file
three
again.
This
is
the
very
first
item
in
the
navigation
tree.
So
in
this
particular
case
github
item
to
be
output-
and
this
is
where
it
happens-
it
happens
all
the
way
at
the
end
of
the
thing,
so
we
wait
for
all
possible
things
to
come
in
and
only
then
we
start
rendering
the
file
tree.
That
is
not
good.
Just
you
know.
B
Unless
we
all,
we
all
disagree
in
this.
I
have
to
tell
this,
but
this
is
something
we
have
to
be
agree.
Agree
on.
This
is
view
performance
plug-in,
so
it
allows
you
to
not
dive
into
the
bells
and
whistles
of
performance.
Api
just
use
the
plugin
specify
the
components
that
you
want
to
measure
and
it
will
do
the
job
for
you.
B
The
question
is
like
this:
this
amount
of
information
in
the
dev
tools
is
pretty
overwhelming
right.
So
that's
why
we
have
this
wonderful
dashboard
that
is
dedicated
to
the
user
timing,
api
and
user
timing
matrix
and
that's
where
we
have
output
of
all
the
measures
and
all
the
marks,
and
when
you
see
the
marks
like
this,
it's
pretty
clear
where
the
things
are
are
sort
of
not
good.
So
we
see
that
some
things
happen
here
at
the
bottom,
like
in
chunks
in
batches
and
then
we
wait
for
the
whole
project.
B
A
B
So
the
the
the
answers
just
just
make
sure
I
understand
so.
The
first
question
was
whether
we
have
any
performance
penalty
for
outputting
the
things
and
then
whether
the
plugin
knows
that
the
console
is
open,
yeah.
The
answer
to
both
is
no.
We
don't
have
any
perform
any
performance
penalty,
we
don't
know
whether
console
is
open
or
not,
and
we
shouldn't
care
the
way
it
is
organized
like
the
outputting
into
the
console
happens
not
by
the
plugin.
B
The
outputting
happens
by
the
performance
bar
right.
You
have
performance
bar
disabled,
you
don't
have
any
output,
yet
you
will
still
have
the
information.
It
doesn't
mean
that
we
do
not
measure.
It
means
that
we
just
don't
output
this
information.
You
will
still
be
able
to
get
the
information
in
the
performance
bar.
You
will
still
be
able
to
get
the
information
in
the
dashboard.
So
all
that
information
is
collected,
the
performance
penalty
is
not
there,
because
this
is
the
async
api
as
any
like
as
most
of
the
modern
web
apis.
B
C
B
B
So
here
I
cover
the
basics
of
what
is
the
user
timing
api?
How
to
use
it
then
how
we
actually
use
it
in
gitlab,
so
we
have
user
timing,
api
utility.
This
is
for
measuring
performance
in
our
haml
and
in
our
rails
applications,
and
then
we
have
the
view
performance
plugin.
So
you
have,
you
should
be
getting
this
information
soonish.
B
I
think
this
merge
request
is
in
review
for
a
bit
over
a
week.
Now
so
should
be.
Pretty
should
be
coming
to
our
recommendation
portal
pretty
soon
and
if
you
don't
didn't
know,
we
use
user
timing,
api
utility,
we
actually
do
it's
called
performance
mark
and
measure,
and
if
you
search
the
code
base,
you
will
find
it
even
we
will
find
appearances
mainly
related
to
snippets
and
web
ide.
Obviously,
but
you
will
find
how
to
use
it.
B
B
I
hope
they
will
be
found
over
time
in
the
future.
So
team
did
a
great
job
of
making
it
persistent
because
for
several
weeks
in
a
row
we
were
missing
this
dashboard
and
we
had
to
restore
it.
I
hope
it's
here
to
stay
now
and
you
will,
you
can
add
any
so
we
have
a
lot
of
routes
already
measured,
but
in
order
for
your
for
route
that
you
are
interested
in
to
be
user
timing,
metrics
aware
you
have
to
add
those
metrics
to
your
views.
B
Add
the
user
timing
metrics
to
your
routes
and
then
they
will
automatically
be
output
into
this
in
this
dashboard
and
it
supports
several
views
several
routes
at
a
time,
so
you
can
compare,
for
example,
different
instances
like
we
have
snippets
textual
and,
for
example,
snippet,
multifile
and
snippet
smart
down,
so
you
can
select
three
all
three
of
those
and
they
will
be
output
three
here,
so
you
will.
You
will
see
different
parameters
and
can
compare
so
nearly
side
by
side,
it's
more
like
top
bottom.
But
okay.
B
This
is
the
dashboard
and
now
I'm
getting
to
a
really
really
exciting
thing.
I
I'm
sorry
I
might
sound
really
unnecessarily
too
excited,
but
that's
I'm
about
to
present
a
work
that
I
started
in
summer.
During
my
spare
time.
I
was
playing
with
some
ideas
of
how
to
make
so
the
problem
is:
measuring
performance
is
never
fun
performance.
B
B
More
caring
about
performance
without
saying,
okay,
we
need
to
put
this
user
matrix.
We
need
to
measure
them.
We
need
to
make
sure
that
we
run
this
every
time
we
push
to
the
tv
to
master
and
all
these
things,
and
it's
it's
really
tough.
It's
really
tough
to
sell
this
idea
without
actually
introducing
engineers
to
a
lot
of
manual
work,
and
this
is
exactly
what
I
was
trying
to
solve
manual
work.
B
B
Some
of
you
might
have
seen
these
those
tables
that
I
post
in
different
magic
quests
with
measuring
performance,
and
no,
I
didn't
do
that
all
by
my
hands.
I
was
I
was
running
those
with
this
script
for
several
milestones
now
and
it
just
got
new
features
and
a
bit
more
muscles.
If
you,
if
you
wish
to
put
it
this
way,
so
I
was
running
running
things.
Let
me
just
do
the
thing,
so
we
I
was
running
in
production.
B
Assets
javascript
performance,
test
index.js,
and
it
does
a
lot
of
the
things
so
technically
what
it
does
it
allows
you
to
specify
the
number
of
runs
you
have.
You
should
be
running
for
your
for
any
route.
It
can
specify
several
routes
at
the
time
so
that
you
do
not
need
to
run
several
routes
separately.
You
just
fight
the
string
representing
the
routes
that
you
want
to
measure.
Let's
say,
for
example,
run
five
rounds
for
me,
and
this
is
exactly
what
we
are
going
to
try
now.
B
B
If
it's
private
snippet
we
do
need
to
log
in
so
it
will
go
to
login,
screen
first
login
and
then
go
to
the
snippet.
The
the
reasonable
question
is:
where
do
we
get
the
logins
from?
I
have
another
file
for
that
again
it
has
to
be
in
yaml
file
that
is
not
pushed
to
the
to
the
repository.
Obviously,
and
everybody
will
be
responsible
for
creating
their
own
like
secrets.yaml
or
something
like
this,
but
I
have
our.
B
The
first
round
of
the
on
the
new
branch
might
take
quite
some
time.
So
what
this
script
does
it
loads
the
the
route
on,
and
you
see
like
round
one
run
two
round
three
and
now
what
what
we
do.
This
is
the
best
thing
like
this.
Now
I'm
showing
you
how
those
tables
ended
up
in
the
magic
quests
you
just
go
here.
B
B
We
can
also
have
two
two
routes,
for
example,
so,
instead
of
only
public
snippet,
we
can
also
push
private
snippet
and
do
three
rounds
for
that
thing
as
well,
but
getting
back
to
that
switch
of
the
branches
so
first
run
on
the
new
branch
will
always
take
enormous
amount
of
time.
So
what
this
script
does
it
still
loads
that
first
run
and
then
discards?
Those
results
it
just
pre-heats
the
cache.
So
technically,
these
runs
are
going
to
be
right.
B
B
C
B
This
is
this
is
one
of
those
things
that
I
have
to
fix
right.
It
used
to
work.
I've
tested
this,
but
you
can
specify
different
routes
the
number
of
rounds,
but
this
is
not
all
what
you
can
also
do.
I
will
just
show
you
the
the
parameters
that
we
are
parsing
technically,
so
we
can
specify
different
routes.
We
can
specify
number
of
runs.
B
We
can
specify
whether
to
run
it
in
production
or
not
in
production
mode,
not
against
gitlab,
but
it
will.
You
know
what
what
you
do
only
is
you
get
your
gitlab.yaml
say
for
webpack
configuration.
Where
is
it
webpack
dev
server
enable
enable
false
stop
the
web
pack
daemon
in
jdk
and
then
run
the
script.
The
script
will
go
on
run.
The
production
configuration
run,
the
webpack
config
configuration
for
production
locally,
for
you
run
the
metrics
on
this
branch
switch
to
another
branch.
Oh,
we
didn't
talk
about
the
branches.
B
So
it
will
give
you
as
close
results
to
production
as
possible
or
like
comparison,
the
absolute
numbers
won't
match.
Obviously,
because
because
technically
we
have
different
hardware
locally
and
on
the
server,
but
it
will
will
go
on
and
generate
you.
The
comparison
in
production
in
in
production
builds,
and
with
that
said,
we
can
specify
different
branches.
B
B
So
the
question
was
whether
to
load
those
with
promises
or
whether
to
load
those
with
async
await,
and
does
it
even
have
any
difference
like
if
we
load
those
in
the
head
of
the
the
module
or
we
load
those
on
demand,
and
this
is
the
perfect
candidate.
So
we
create
three
different
branches,
one
with
loading
in
the
head
of
the
module
one
with
promises,
one
with
async
await,
and
then
we
specify
the
three
branches
in
this
script.
Using
the
branches.
B
B
The
script
is
smart
enough
to
figure
out
that.
Okay,
if
you
have
any
changes
on
this
current
branch,
it
will
run
the
measurements
with
your
changes
now,
but
before
it
switches
to
another
branch
in
this
particular
case
master,
it
will
stash
all
your
changes,
switch
to
master
run
all
the
measurements
once
the
measurements
on
master
are
done.
It
will
switch
back
to
this
branch
and
load.
Those
stashed
changes
back
to
you,
so
you
won't
lose
any
changes
whatsoever.
So
you
see
we
are.
We
had
three
runs
for
for
the
current
branch.
B
C
B
B
Grouping
we
have
the
column,
so
the
rows
represent
different
routes,
the
columns
represent
different
branches,
and
then
you
can
compare
the
things.
What
is
faster?
What
is
what
is
slower
this?
This
works
with
user
timing.
Metrics
again
this
doesn't
measure
the
lcp
or
any
web
vitals
or
any
other
native
or
synthetic
measurements.
It's
only
about
the
particular
user
timing,
metrics
that
were
put
into
the
routes
that
you're
measuring.
B
So
if
there
are
no
user
timing,
metrics
in
the
route
that
you're
measuring
the
table
will
be
empty,
so
don't
get
surprised
by
that
now
we
can
also
do
as
you
as
you
saw.
We
are
running
the
headless
chrome.
We
can
do
the
same
thing
in
the
real
browser.
This
is
especially
useful
when,
when
you
see
some
numbers
really
not
matching
or
something
something
fishy
going
on
there,
so
you
specify
visual
parameter
and
it
will
do
exactly
the
same
it
used
to
do
before.
B
But
now
it
will
fire
up
the
real
browser
and
it
will
show
you
so
now
we
are
seeing
the
first
round
that
will
get
discarded
and
then
we
reload
the
things
and
start
measuring
for
real
three
runs.
So,
technically
total
it
will
be
four
rounds
here,
but
the
first
one
gets
discarded.
Now
we
completely
shut
down
the
browser,
switch
to
master
and
do
exactly
the
same
procedure
once
again,
and
this
is
the
first.
B
This
is
the
situation
that
I
was
telling
about
the
first
round
on
the
new
branch
when
you
switch
to
the
new
branch
takes
quite
some
time,
because
webpack
needs
to
reload
all
these
things
and
rerun
all
the
cogs.
So
that's
why
we
discard
the
first
run
so
that
it
doesn't
affect
measurements
that
much
and
sometimes
it
might
take
way
too
long,
and
it
will
time
out
the
descriptive
timeout.
But
since
we
have
this
in
automated
manner,
it's
just
the
matter
of
restarting
the
the
script.
D
B
Have
run
exactly
the
same
thing,
but
with
the
real
browser
with
visual
parameter,
the
same
the
same
table
a
bit
different
numbers,
but
that's
that's
something
to
expect
and
the
last
parameter
that
we
care
about
is
throttle.
So
you
can
say:
okay,
this,
the
the
tests.
We
were
running
now
we're
on
on
my
local
network,
but
we
can
emulate
3g
network
so
that
we
have
more
realistic
numbers.
So
you
just
pass
the
throttle
parameter
and
it
will
measure
everything
against
emulated,
3g
connection.
B
That's
pretty
much
it
so,
as
I
said,
I
have
to
finish
a
couple
of
things
here
for
it
to
be
working
stable
and
in
this
particular
case
I
have
to.
I
have
to
figure
out
why
logging
in
failed
now
but
production.
I
was
able
to
to
run
tests
on
two
different
routes
with
two
different
branches
with
production
setup
right
before
this
call.
It
worked
out
really
well
and
one
last
bit
that
is
going
to
be
implemented
here
is
we
will
be
able
to
specify
side,
speed
parameter?
What
does
it
mean?
A
A
A
So
if
you
answered
that
in
the
in
the
last
three
sentence,
what
do
you
think
about
turning
it
around,
but
rather
like
implementing
that
feature
into
gdk
measure,
so
that
we
have
one
one
thing:
that
we
are
basically
promoting
one
command
and
then
take
it
from
there
so
that
you
can
say?
Okay,
I
want
to
have,
because
I
would
also
love
to
have
the
same
thing
for
lcp:
have
a
table
for
it
have
the
automatic
branch
switching
et
cetera.
A
B
That's
a
very
good
question.
I
was
thinking
about
this,
but
first
I'm
not
sure
how
gdk
measure
like
I.
Obviously
I
should
have
to
dive
into
this
right,
but
the
problem
is
that
here
I
I
wanted
to
have
a
tool
for
myself
in
the
first.
I
started
as
a
tool
for
myself
when
I
wanted
to
know
like
just
measure
performance
right
here
right
now
and
I
know
how
to
work
with
selenium
and
I
know
how
to
work
with
with
node
and
do
these
things.
B
So
that's
that's
how
I
started
this
and
in
general
it
makes
sense,
because
this
tool
is
user
timing-
centric
not
the
like,
not
the
web
vitals
or
generic
matrix
centrics
centric.
So
this
was
this
was
crucial
for
me
because,
as
and
this,
this
position
of
mine
is
probably
known
to
to
people
who
talk
to
me
about
performance.
I
don't
trust
lcp,
I
don't
trust
size
speed.
I
don't
trust
those
metrics
because
they
don't
tell
me
the
real
performance
of
my
applications.
B
B
Probably
we
can.
The
question
is
with
this
tool.
I
see
the
potential
of
it
becoming
the
part
of
our
ci,
where
we
run
comparison
to
different
branches.
Jdk
manager.
Gtk
measure
cannot
do
that.
I
believe
to
switch
branches
and
do
the
things
so
for
for
me.
I
would
I
would
envision
this
as
part
of
the
ci
process.
B
When
you
push
your
branch
and
then
it
runs
tasks
on
your
branch
and
on
master
and
tells
you
whether
you
improve
performance,
it
is
pretty
much
on
the
same
level
or
you
screwed
up
something
this
to
me.
This
tool
is
much
easier
to
implement
into
our
ci
processes,
but
I
might,
I
might
be
completely
wrong.
As
I
said,
I
have
no
idea
how
gdk
measure
works.
I
just
know
that
it's
there,
I
know
what
it
does,
but
I
don't
know
the
internals.
So
I
might
take
a
look
at
that.
A
B
That's
that's
the
reason.
That's
the
reason
why
why
this
solution
pulls
in
selenium
as
the
javascript
dependency
and
not
using
the
selenium
that
we
have
in
ruby
somewhere,
so
the
driver
is
all
in
javascript
and
node
note
for
for
for
for
this
purpose
so
but
yeah
I
I
will
take
a
look
at
that
simple
ruby
screen.
E
On
that,
on
that
topic
of
running
this
in
ci,
one
of
the
things
that
we've
tackled
in
the
past
is
the
variability
of
the
runs,
because
you
can
run
once
it
gives
you
a
number.
You
run
run
it
again.
It
gives
you
a
different
number.
Do
you
think
that
this
solution
would
be
less
vulnerable
to
those
fluctuations.
B
That's
that's.
Why
that's
why
this
tool
supports
parameter
to
to
say?
Okay,
we
want
to
have
like
three
rounds
or
five
rounds.
Luckily,
for
myself,
I
always
run
five
five
rounds,
and
this
this
gives
me
a
pretty
pretty
stable
picture
in
terms
of
comparing
two
things
right
here
right
now.
They
do
not
provide
you
with
the
with
the
correct
picture
if
you
are
relying
on
the
absolute
numbers.
A
The
q18
is
running
already
site
speed
as
a
ci
tool,
but
not
in
ci
itself,
especially
due
to
that,
because
comparing
two
different
branches
can
be
very
difficult
to
see,
and
I
also
had
this
locally
on
my
machine.
It
was
like,
oh,
why
is
this
not
improving,
and
I
was
looking
at
the
stuff
for
half
an
hour
and
I
simply
ran
again
and
figured
out
in
the
in
the
background.
B
D
This,
that's
not
completely
true.
If
you
look
speed
curve,
is
a
third
party
sorry
to
interrupt
you,
but
this
is
very
important
because
there's
a
reason
why
they
promote
synthetic
metrics
and
user
metrics.
They
serve
completely
different
purposes
so,
but
I
think
I
think
we
could
use
systems
where
we
have
stability
of
hardware
and
other
parameters
to
for
synthetic
metrics
and
then
what
you
are
promoting
for
user
metrics,
of
course,
can
can
be
different,
but
the
the
point
of
user
metrics
is
having
data
from
real
users,
not
cie
not
ci
jobs,.
B
B
B
However,
again
if
we
say
that
we
in
the
short
period
of
time
like
the
automated
script,
that
I
just
showed,
we
measure
two
branches
in
the
short
period
of
time.
The
probability
of
interference
like
this
gets
really
gets
really
low.
So
if
we're
talking
about
just
comparing
one
branch
to
another
like
whether
numbers
match
or
higher
or
lower
that
this
is
good
enough.
If
we
say
that
we
have
to
rely
on
these
numbers
for
production
purpose
of
saying.
B
Okay,
we
have
the
problem
with
performance,
because
I
measured
it
locally
and
the
numbers
went
went
up
by
by
50.
This
is
this
is
not
going
to
work
out
now.
This
is
for
comparing
two
things
right
here
right
now.
If
we
take
the
same
measurement,
we
if
we
run
exactly
the
same
command
in
10
minutes,
the
number
the
absolute
numbers
will
be
different.
Yet
the
comparison
between
these
two
branches
should
still
remain
the
same
more
or
less
than
than
it
was
10
minutes
before,
but
the
absolute
numbers
will
completely
be
off.
Obviously,.
D
D
Can
no
not,
in
general,
like
you,
just
said
that
we
don't
care
about
absolute
numbers
and
we
should
look
at
the
difference
between
the
two
branches
which
I
I
totally
understand,
but
also
this
affirmation
could
be
better
how
to
say
better
absorbed.
If
we
have
data
about
it
and
not
in
ci.
Just
try
to
understand
if
it's
a
true
statement
or
not.
So
if
it's
real
that,
if
you
run
this
now,
the
absolute
number
will
be
different
from
10
minutes
before
and
10
minutes
after,
but
the
which
I
also
tend
to
agree.
D
B
However,
I
still
believe
that
if
we
run
exactly
the
same
command
like
the
deviation
should
stay
within
within
perceived
20
difference,
the
the
comparison
between
two
branches
five
minutes
ago
and
comparison
between
these
the
same
branches
like
20
minutes
from
now.
The
difference
between
difference
should
stay
within
perceived
20.
In
my
opinion,
and
from
from
my
local
local
testing
that
that's
true
but
making
it
like
public
well,
I
need
to
just
run
a
number
of
tests
locally
to
to
prove
this,
but
in
general
this
is.
This
is
an
interesting
thing.
B
This
is
true,
and
this
is
so
because,
as
I
said,
any
tool
is
prone
to
things
like
this
to
the
deviations
like
this
and
the
same
thing
for
a
speed
curve,
the
same
thing
for
a
side,
speed.
If
you
run
it
in
10
minutes,
you
will
get
the
different
numbers
and
if
you
compare
different
branches
with
those
tools,
you
might
even
have
a
larger
deviation.
B
E
Is
but
I
just
yeah,
I
just
sort
of
started
to
cut
you
off
there.
I
just
wanted
to
bring
something
very
tough
with
what
you're
saying,
which
is,
I
guess,
we'll
have
to
to
test
it,
because
the
performance
marks
are
different
than
the
other
measurements,
because
they're
very
specific
to
the
ipo
building
and
the
theory.
In
these
theories
of
angelo.
I
get
your
point
that
we
should
confirm
those
numbers.
E
The
back
end
requests,
if
we
do
have
them
in
the
test,
will
be
reflected
as
well
here
we're
affecting
just
sometimes
between
those
two
marks,
which
is
just
basically
rendering
front
end
parts.
Sometimes
so
we
will
change
the
it
will
change
per
mark.
Some
mark
might
be
affected
or
the
marks
might
not
be
affected,
so
we
definitely
need
to
just
get
a
sample
proof
of
concept,
get
it
running
on
ci,
get
the
numbers
and
then
look
at
them.
I
think
keep.
B
In
mind
also
that
we
do
we,
actually,
we
already
do
run
user
timing
metrics
in
sort
of
comparison
mode.
So
we
have
the
dashboard.
We.
We
have
several
several
views
now
that
use
user
timing
metrics
right
web
id
snippets,
mr
dave
so,
and
those
matrix
are
gathered
with
our
site,
speed,
reporting
and
our
output
in
our
dashboard,
and
our
dashboard
shows
that
the
deviation
as
long
as
the
hardware
is
the
same.
B
We
cannot
say
that
they
went
up
by,
for
example,
specifically
one
second
1.35
seconds
right.
This
is
not
about
this.
It's
just
to
monitor.
Okay,
the
numbers
went
up,
and
we
see
that
this
is
the
thing
before
that
they
were
more
or
less
on
one
level,
and
this
is
this.
Is
this
gives
me
a
feeling
that
we
actually
can
rely
on
user
timing
metrics
for
our
measurements
and
in
particular
in
this
particular
script?
So
that's
I
don't.
E
A
D
A
For
example,
on
the
measurements
that
we
were
doing,
but
still
everything
felt
slow,
because
we
we
had
a
problem
that
the
unloading
was
captured
by
the
the
analytics
and
was
blocked
by
500
for
my
500
milliseconds
so,
and
this
of
course
made
everything
slow,
and
this
happened
on
unload
and
not
unload.
So
this
was
never
measured
or
was
never
felt
so
a
lot
of
manual
things
and
need
to
go
into
consideration
also
on
the
different
types
of
routes.
What
what
do
we
want
to
show?
A
Do
we
have
a
great
lcp
but
not
sure
showing
any
real
content
doesn't
help
you
that
much
then
exactly,
then
we
need
to
use
the
timing
matrix,
but
we
also
have,
I
believe,
a
lot
of
routes
which
are
mainly
about
getting
something
on
the
screen
surrendered
as
quickly
as
possible,
in
the
sense
that
they
can
see
that
something
is
there,
for
example,
them
our
view
or
the
boards.
They
are
both
topics
where
we
are
currently
the
boards
are
very
slow
on
based
on
measurements.
Why?
A
Because
we
are,
we
are
starting
to
load
the
wrong
column
first
and
the
the
slowest
column
is
loaded
last.
For
example,
so
the
one
that
is
still
changing
for
a
very
long
time
is
the
world
is
still
open,
because
that
query
takes
a
long
time,
and
I
think
it's
always
about
going
in
having
a
lot
of
of
information
and
I've.
Seen
also
that
performance
improvements
happen
for
the
loading.
But
then
you
had
huge
cpu
timings
and
everything
was
blocked,
so
we
can't
break
it
just
down
just
in
one
number.
A
A
We
want
to
improve
first
and
bringing
everything
together
any
tool,
any
data
that
we
have.
I
think
that's
the
that's
the
main
goal
that
we
should
have
to
constantly
improve,
and
if
we
are
changing
something-
and
it
doesn't
change
at
all
that-
or
we
don't
see
any
improvement
but
see
it
on
another
number
awesome
perfect.
We
take
it.
So
I
think
that
there
are
at
the
moment.
I
am
not
too
much
afraid
of
specific
timing.
A
Why?
Because
the
differences
are
still
huge.
We
are
not
talking
about
squeezing
20,
milliseconds
or
25
milliseconds
out
of
the
system.
We
are
still
talking
a
lot
of
times
around
two
seconds
three
seconds
four
seconds
and
until
we
are
not
getting
down
to
the
100
millisecond
performance
improvements,
which
I
hope
that
we
do
at
some
point,
then
just
take
a
rough
number.
If
it's
totally
the
same
or
not,
then
go
with
it.
The
problem
that
I
rather
see
is
going
back
to
the
measurements
and
right
now,
site,
speed.
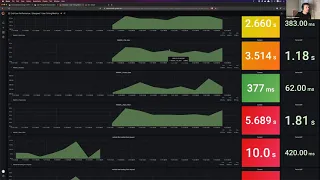
A
A
So
what
you?
What
I
mean
with
this
is
the
following
is
that
you
can
have,
for
example,
I
think
here
you
can
see
the
best,
but
where
the
the
roots
that
we
were
measuring
mainly
over
the
last
quarter,
and
what
you
can
see
here
is
that
a
couple
of
them,
for
example,
the
project
homepage,
has
a
much
higher
fluctuation
from
their
timing.
So
you
can
see
that
we
are
going
sometimes
in
a
couple
of
hours,
between
2.4
seconds
up
to
2.8
seconds,
which
are
around
400
to
500
milliseconds.
A
You
can
see
the
differences
in
measurements,
which
is
a
clear
sign
based
on
the
on
the
infrastructure
that
we
are
having
a
topic
in
reality,
what
you
should
see
is
like
a
clear
line,
a
deployment
that
goes
up
or
down.
That
means
that
your
infrastructure
has
enough
buffer
and
the
worst
and
the
biggest
difference
where
you
can
see
this,
so
the
issue
list
is
quite
stable
overall,
but
if
you
look,
for
example,
at
the
mr
list,
this
is
really
a
difference
in
a
couple
of
days
between
2.5
seconds
to
oh,
that's,
not
too
big.