►
From YouTube: Application Performance Session - 2020-10-13
Description
Denys Mishunov talking this time about user-timing metrics.
A
A
B
A
A
C
A
B
B
B
B
So
okay
now
should
be
good.
I
just
made
a
posting
in
the
front
and
channel.
Of
course
you
set
up
a
new
session
and
exactly
the
second
time
it's
already
on
a
huge
bank
holiday
in
the
us,
and
so
sarah
thanks
for
joining
anyhow,
and
so
a
lot
of
people
are
out
today.
So
I
was
not
expecting
too
many,
but
this
is
really
way
less.
So,
let's
see,
I
think,
as
it
is
just
in
that
calendar
and
not
the
frontend
calendar,
yet.
A
B
A
Is
something
that
I'm
telling
about
for
like
for
a
bit
over
a
year
already
and
it's
and
finally
we
got
some.
We've
got
some
traction
and
we've
got
some
some
information,
so
this
session
is
going
to
be.
It
was
quite
spontaneous
like
so
I
I
don't
have
a
lot
of
slides
to
show,
so
you
will
have
to
stare
at
my
face
for
a
bit.
I'm
sorry,
but
I
will
show
some
some
graphical
information
later
as
well.
So
what
is?
Timing?
A
A
Technically,
the
main
question
is
why
why
user
timing
api,
like
we
have
so
many
metrics,
because
if
we
take
a
look
at
the
at
the
main
site,
speed
performance
dashboard
like
the
the
number
of
metrics?
There
is
overwhelming
like
time,
the
first
bite
and
for
to
first
comfortable
paint
like
last
content
for
paint
all
sorts
of
metrics.
A
Sometimes
it
works,
except
for
the
cases
when
it
doesn't
and
in
the
hybrid
applications,
as
we
have
in
gitlab,
when
we
have
rails
application
with
hammer
views
incorporating
view
applications,
the
things
become
really
complex
and
for
for
the
generic
metrics,
and
I
have
the
perfect
example
to
demonstrate
that,
like
the
example
that
I
already
showed.
But
now
let
me
just
start
sharing
my
screen
and
it's
going
to
be.
A
Interesting
to
see,
I
guess
so,
first
of
all
in
our
project,
like
the
user
timing
matrix,
these
are
custom
metrics.
As
I
said,
we
put
the
marks
wherever
we
want,
and
this
allows
us
to
measure
the
main
to
measure
the
performance
of
exactly
the
elements
of
the
page
or
the
applications
on
the
page
that
we
care
about.
A
That
makes
the
most
that
make
the
most
sense
for
that
or
not
of
you,
and
we
have
incorporated
those
user
timing,
metrics,
obviously
enough
into
two
areas
at
the
moment:
snippets
and
web
id
and
web
ide
is
the
perfect
example
of
why
generic
metrics
are
not
necessarily
what
we
really
want
to
measure.
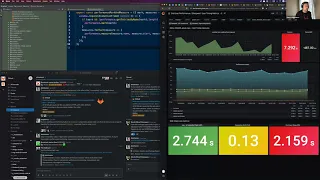
So
if
we
take
a
look
at
this
new
shiny
dashboard
that
team,
thankfully
helped
to
restore
today,
that
was
gone
right
before
this
call.
So
if
we
take
a
look
at
this
dashboard,
let
me
just
close
this.
A
These
are
the
metrics
that
we
try
to
to
take
care
of
on
the
product-wide
scale.
At
the
moment
they
called
web
vitals
and
consists
of
three
parameters.
The
largest
contentful
paint
lcp
cumulative
shift.
This
is
like
the
the
number
showing
how.
How
often
do
you
move
elements
around
so
like
how
how
well
the
elements
take
their
places
so
that
your
view
doesn't
look
like
very
shifted
for
the
user
and
first
input
delay.
A
A
For
for
engineering,
we
have
to
make
this
parameter
as
low
as
possible
for
all
the
views,
and
we
have
some
metrics
and
some
core
views
that
we
have
to
care
about,
but
when
it
comes
to
the
web
id
about
repo,
so
this
is
the
I'll
try
to
show
to
to
open
this.
This
is
technically
the
rappo
that
we
get
when
we
just
go
click
web
id,
and
this
is
what
we
get
so
master
without
any
branch
without
any
merch
request.
A
This
is
the
view
that
we
get
according
to
the
lcp
we
get
really
good
performance
like
2.7
is
fine.
That's
why
it's
green!
It's
like
considering
the
the
size
and
the
happiness
of
the
web
web
id
application.
I
would
be
happy
if
this
would
be
would
be
correct,
and
this
this
lcp
parameter
is
correct.
This
is
how
browsers
measure
and
evaluate
in
particular,
web
id
like
technically
crawlers,
don't
evaluate
that
page
of
web
id
because
you
have
to
be
logged
in,
and
chrome
scrollers,
don't
log
in
really,
but
would
they
have
this
opportunity?
A
However,
the
problem
is
that
using
user
timing
api
I
could
set
the
metrics
and
marks
to
exactly
measure
the
to
measure
the
performance
of
the
parts
that
we
really
care
about.
In
this
particular
case,
I
care
about
how
fast
the
navigation
on
the
left
side
gets
loaded,
because
this
is
what
this
is
one
of
the
cornerstone
moments
in
the
life
cycle
of
web
id
of
loading,
the
web
id
where
users
can
say:
okay,
yeah,
I
can
start
using
this.
This
is
this
is
web
id.
A
A
But
this
is
like
dirty
technique.
I
don't
advise
that
just
like
you
know
we'll
talk
about
this
after
recording
now.
This
is
the
difference
between
custom
metrics
and
the
the
generic
ones.
But
let's
talk
about
this
custom
metrics
now
so
bad
vitals
go
go
off
the
screen.
Now,
first
of
all,
as
I
said,
we
can
mark
the
things
on
the
timeline
and
we
can
measure
the
things
on
the
timeline
now.
C
A
A
This
is
our
timeline
of
like
of
loading,
our
page,
let's
say
so,
using
user
timing.
We
can
set
different
marks
on
this
timeline.
For
example,
this
is
the
start
of
our
application,
and
this
one
will
be
the
finish
of
our
application.
We
will
talk
about
how
and
where
we
put
these
marks
later,
but
we
can
put
two
marks.
A
What
does
it
tell
us?
It
tells
us
when
our
application
started
to
be
to
to
load
or
to
be
bootstrapped
or
as
in
the
case
with
web
id.
I
know
when
my
navigation
tree
started
to
be
bootstrapped
when
it's
finished
to
be
bootstrapped,
but
then
I'm
sorry,
but
then
the
difference
between
these
two
marks
can
be
measured
and
it
has
separate
entry
in
this
performance
timeline,
and
this
is
our
measure
meant,
but
it's
called
measure
in
the
in
the
api.
So
we
can.
A
We
do
not
need
necessarily
when
we
measure
the
things
we
should
not.
We
did
not
necessarily
need
to
specify
finish
or
start
so
if
we
do
not
specify
finish,
let's
like
like
this,
without
finish,
we
will
be
measuring
from
our
start
point
all
the
way
to
the
moment.
We,
when
we
measure
the
things,
if
we
omit
the
start
mark,
then
we
will
be
measuring
from
the
very
beginning
of
the
loading
process
of
the
page
onto
the
moment
the
measurement
is
taken.
A
C
A
Then
we
have
three
different
marks
on
this
load
this
on
this
page
as
well,
that
are
called
web
api
web
id
app
start.
This
is
when
the
view
application
kicks.
In
the
view
application
starts
bootstrapping
web
id3
start.
This
is
when
the
component
with
the
navigation
tree,
starts
rendering
or
bootstrapping
and
pre-finished.
This
is
when
I
know
I
know
that
the
three
has
been
output
on
the
screen.
So
these
three
marks
and
one
measurement
allow
me
to
see
how,
where
are
the
main
losses
of
the
performance.
A
A
If
you
want
to
know
how
it
looks
in
the
raw
api
here
is
the
file
called
performance
utils
we'll
get
to
it
a
bit
later
performance
mark
and
perform
measure.
These
are
the
things
the
standard
things
this
performance
is
the
global
object
that
is
supported
by
all
major
browsers
now,
nowadays,
you
don't
need
any
polyfill
or
anything
like
this.
This
is
standard
browser,
api,
called
user
timing.
Sorry,
this
is
not
part
of
user
timing
api,
but
this
is
the
part
of
the
umbrella
performance
api
in
the
browsers,
so
performance
mark
sets.
A
A
And
helpers
so
the
first
thing
to
note
there
is
the
file
called
performance
constants.
It's
in
assets,
javascripts
performance
constants,
where
you
can
see
the
naming
conventions.
So
we
do
not
use
string
literals
for
measuring
performance
in
the
components
like
we
should
not
because
at
some
point
there
will
be
the
linter
that
will
fire
an
alarm.
If
you
are
trying
to
do
this,
so
all
the
namings
for
marks
and
measurements
go
through
go
from
should
go
from
this
performance
constant
file.
A
Here
you
have
the
examples
for
snippets
and
for
the
web
id.
So
you
can
play
play
play
around
with
with
this
information.
So
all
the
namings,
all
the
string
literals
go
in
here
then
another
thing:
we
have
the
performance
utils
file.
This
is
the
main
abstraction
that
you
should
communicate
with
when
you
implement
user
custom
user
timing
metrics.
It's
really
trivial
thing
here,
so
performance
mark
and
measure
function
that
takes
mark
and
measurements.
Should
you
need
those?
A
So
you
can
specify
either
marks
or
measurements
or
you
can
specify
both,
and
it
will
do
the
things
for
you
the
reason
we
had
to
to
move
it
into
the
abstraction,
because
I
want
this
to
be
done
not
at
the
moment.
We
request
these
things,
but
I
want
to
put
the
burden
off
requesting
the
next
animation
frame
on
this
utility
component
to
to
get
as
close
numbers
to
reality
as
possible,
because
usually
view
components
will
trigger
performance
events.
A
A
A
A
So
whenever
you
you
can
get
directly
to
a
file,
for
example,
if
I,
if
I
open
this
editor
config
file
and
that
measurement
actually
goes
straight
to
the
straight
to
the
file,
so
I
want
to
measure
performance
of
how
fast
does
it
take
to
start
loading
this
file,
since
it
is
already
in
the
url
and
technically?
This
is
exactly
what
user
wants
to
get
to,
so
we
want
to
make
sure
that
that
file
gets
rendered
as
soon
as
possible.
A
So
we
want
to
know
when
the
rendering
of
the
file
starts
and
when
the
rendering
of
the
file
ends.
So
in
this,
in
this
merge
request,
I
put
the
measurements
into
the
wrapper
editor
component,
and
this
is
what
it
gives
us.
So
it
doesn't
it.
It
not
only
provides
us
with
the
with
the
tree
navigation
performance,
but
also,
oh,
I'm
sorry,
not
only
the
tree.
Loading
performance,
but
the
web
id
file
loading
performance,
and
here
we
we
see
that
the
things
are
not
as
good
as
as
we
would
hope.
A
But
ironically,
lcp
in
this
case
is
actually
correct,
because
somehow
it
does
detect
that
there
is
something
happening
after
that
that
image
being
rendered
on
the
screen.
So
it
just
tells
once
again
that
lcp
might
be
not
telling
you
the
full
story,
and
in
this
particular
case
we
have
more
marks.
Obviously
what
the
set
of
marks
related
to
the
tree,
rendering
and
the
set
of
marks
related
to
the
file
load.
A
So
that's
why
three
files
so
three
is
for
the
navigation
tree.
Wrapper
editor
is
for
the
file.
What
is
what's
about
the
ide,
the
root
application?
So
the
idea
is
that,
in
order
for
the
whole
process
to
be
maintainable,
the
idea
is
to
catch
all
the
performance
related
requests
from
the
roots
from
the
child
components
only
on
the
root
level
on
the
root
level
of
your
application.
So
try
not
to
call
this
utility
method
performance
market
measure.
A
Only
child
components
try
to
communicate
this
to
the
root
application
and
then
let
boot
application
manage
the
thing.
So
how
is
it
done
within
web
id?
Let's
take
a
look
here.
We
are
importing
all
the
constants
that
that
I
showed
you
in
this
in
this
naming
convention
file,
and
then
we
actually
will
listen
to
listen
to
the
events
that
child
components
emit
to
our
event
hub.
A
This
has
been
actually
changed
later
at
one
of
the
later
merge
requests
to
make
more
sense
for
all
this
process,
and
I
will
link
to
that
updated,
merge
request
later,
but
the
process
is
as
this:
your
child
component
wants
to
measure
performance.
It
emits
the
event.
Root
application
listens
to
this
event
and
measures
the
things
so
then
we
know
all
the
marks
and
measurements
that
are
happening
in
this
in
this
part
of
the
application,
and
it's
really
easy
to
maintain
this.
A
This
thing,
I'm
I'm,
I'm
speaking
speaking,
do
we
have
any
questions
so
far?
I'm
sorry
for
pushing
this.
So
no,
no
questions!
Wonderful!
So,
let's
go
on.
Yes,
we
were
talking
about
existing
examples,
snippet
web
ide.
This
is
we.
We
took
a
look
at
the
dashboard
for
the
web
id.
There
is
the
same
thing
for
snippets.
Obviously,
I'm
we're
not
going
to
dive
into
that,
but
how
do
how
do
we?
I
already
told
how
we
measure
this,
but
there
are.
A
There
is
an
interesting
thing:
how
we
can
measure
user
timing
metrics
without
actually
waiting
for
those
data
to
get
to
the
to
the
dashboard
to
the
grafana
dashboard
right.
So
we
are
on
this
page
oops,
not
that
one,
the
dev
tools,
let's,
let's
do
it
this
way,
so
we
are
on
the
on
the
web
id
page.
In
this
particular
case,
I
have
the
performance
bar
enabled
we
will
have
the
performance
bar
performance
session
later
right.
A
I
probably
the
next
one
will
be
dedicated
to
the
bar,
but
there
is
an
interesting
thing
related
to
this
bar.
If
you
have
the
performance
bar
enabled-
and
you
reload
this
page
now,
wonderful
graphics,
implemented
by
team
tells
you
that
you
do
have
performance
bar
enabled
now,
and
it
starts
spitting
some
some
information
into
your
dev
tools
into
the
console,
among
other
things.
A
So
if
you
ignore,
like
grammarly
metrics
technically,
your
extensions
that
you
have
in
your
browser
can
measure
performance
as
well,
and
that's
that
will
be
output
into
your
console
as
well.
So
this
might
be
a
side
effect
of
this.
Nevertheless,
all
of
those
marks
that
we
have
seen
here
so
webid
app
start
web
id3
start
whatever.
So
we
have
all
of
those
output
into
our
console,
and
you
can
measure
those
things
right
here
right
now
in
order
to
understand
whether,
for
example,
so
you
you
have
some
big
change
right.
A
So
this
allows
you
to
make
to
take
the
measurements
on
your
machine
before
you
make
those
changes
make
the
changes
run
this
very
rough
test
again
with
your
changes
and
see
how
the
numbers
get
changed.
So
it
will
tell
you
whether
you,
whether
the
performance,
degrades
or
improves
right
here
right
now,
without
waiting
for
those
data
that
data
to
get
to
the
grafana
dashboard.
A
So
this
icon,
the
target
icon,
means
the
mark
that
you
have
put
into
your
application
and
then
this
this
ruler
thing
means
the
measurement.
So
then
you
can
see
the
measurements
of
the
of
different
different
measurements
that
you
took
during
the
loading
of
that
or
another
page.
So
in
this
particular
case
we
see
that
yeah
tree
has
been
loaded
within
six
seconds
and
file,
so
this
is
not
from
the
start.
A
This
is
just
from
the
from
the
start
mark
to
the
end
mark,
not
from
the
beginning
of
the
loading.
If
we
want
to
know
the
file
finished
loading-
oh,
that's,
not
yeah
file
finished
actually
yeah.
In
this
particular
case.
I
measure
from
the
moment
the
page
started
loading
so
seven
and
a
half
seconds.
So
this
number
is
not
that
big
at
the
moment.
I
have
no
idea
what
happened
here.
A
Right
and
also
this
is
called
cache
measurement,
so
this
is
something
to
keep
in
mind,
so
this
measurements
in
the
console
can
tell
you
the
story
between
like
between
the
moments
before
you
change
and
after
your
change.
These
are
not
reliable
to
say.
Okay,
our
performance
is
this
now,
because
this
is
not.
These
are
the
numbers
for
your
particular
machine.
A
Your
particular
connection
at
this
particular
moment,
that's
it,
but
it
gives
the
good
understanding
or
like
basic
understanding,
of
whether
your
change
dramatically
changes
something
or
not,
and
also
we
will
be
talking
more
about
this,
like
you
can
see
those
web
vitals
parameters
output
into
the
console
as
well,
but
we
won't
touch
those
at
the
moment
they
will
be
covered
by
the
performance
bar
session,
the
next
one.
So
this
is
how
you
can
get
to
those
metrics
when
you
need
those
just
don't
forget
to
enable
the
performance
bar.
A
If
you
disable
the
performance
bar,
you
won't
get
that
output.
Now,
what
do
we
have
yeah?
How
to
constantly
monitor
the
dashboard?
I
started
talking
about
dashboard
long
before
I
had
to,
but
you
saw
that
going
through
monitor
parameters
to
the
on
the
dashboard
right.
So
technically,
the
interesting
thing
here
is
actually
we
have
several
dashboards
where
we
implement
this
runs
toggle.
A
So
I
don't
really
advise
doing
this
on
the
seven
day
scale,
probably,
but
it
might
work
as
well,
since
we
are
on
zoom
and
if
you
enable
the
runs,
you
can
just
get
to
you
hover
over
this
marks
and
you
can
get
to
the
result
page,
and
this
is
where
you
get
the
raw
side.
Speed
output
for
that
particular
run,
and
that's
where
you
can
figure
out.
Okay,
why
the
numbers
are
getting
so
high
or
the
numbers
are
getting
so
low
like
what
affected
that.
A
So
you
can
get
to
the
waterfall
and
see
the
things,
but
in
order
to
get
better
understanding
of
how
to
use
this
tool,
please
refer
to
the
very
first
session
on
performance
that
team
hold
two
weeks
ago,
yeah
two
weeks
ago,
where
team
dives
into
a
lot
of
details
of
this,
and
it's
really
exciting,
to
see
how
things
are
measured
there.
So
with
that
technically
that's
pretty
much.
I
was
rushing
like
mad.
I
don't
know
why,
but
yes,
questions
now
team.
Do
you
want
to.
B
A
B
Awesome
that
leads
to
my
main
question:
is
there
anything
that
we
could
think
of
that
makes
really
sense
to
measure
on
a
global
perspective,
so
on
every
page
automatically
in
reality
like?
How
long
does
it
take
our
initialization
on
main.js,
the
on
dom
content,
loaded
or
hopefully,
soon
not
anymore,
dom
content
loaded
and
also
our
deferred
loading?
So
should
we
measure
that
would
that
make
sense?
How
do
you
see
that
well.
A
I
I
I
left
the
comment
on
research
performance
channel
last
week.
I
think
I
suppose,
where
we
should
start
is
we
have
five
top
routes
for
our
kpi
metrics
right.
So
I
would
go
on
and
implement
like
again
using
the
naming
convention
introduce
the
new
naming
convention
for
the
very
v
core
element
of
a
route,
the
element
that
users
get
to
go
for
when
they
type
in
the
url
or
click
the
link,
for
example,
for
snippets
it's
at
least
the
rendering
of
the
very
first
snippet.
A
A
B
B
Measuring
on
the
main
js,
we
are
checking
a
lot
of
times
like
is
this
element
there?
This
stuff
we
have
jquery,
we
are
doing
also.
There
are
two
topics
there.
One
one
topic
is
the
main
chance
where
we
have
a
better
understanding
by
now
what
is
actually
going
on,
and
I
think
we
have
optimized
it
some
parts
quite
good
already,
even
as
we
know,
we
need
to
keep
the
jquery
stuff,
at
least
for
some
time,
some
more.
B
But
as
soon
as
you
go
like
a
level
deep,
then
you
can
see
funky
stuff
like,
for
example,
on
the
on
the
overall
javascript
that
is
running
on
all
project
pages.
We
are
basically
sometimes
initializing,
something
that
is
just
used
on
one
sub
sub
sub
sub
page,
but
it's
every
time
called
every
whatever
we
do
and
yeah.
I
think
we
have
a.
A
Lot
of
stuff
that
we
need
to
this
is
this
is
perfect
scenario
for
user
timing.
Metrics
like,
as
I
said,
for
example,
let
me
just
share
my
screen
again.
I
think
it
falls
to
this.
This
example
of
the
of
the
about
repo
thing
yeah.
Actually
I
didn't
manage
to
mention
this,
but
you
can
select
several
pages
here
and
though
those
will
output
as
well
like
this
one
is
not
available
for
empty
one.
C
A
If,
if
the
matrix,
if
you
compare
it
to
views
and
some
of
the
metrics
or
measurements
are
not
available
in
one
of
the
views,
it
will
just
show
no
data,
so
don't
be,
don't
be
afraid
of
that.
It's
just
that
team
page
does
provide
the
file.
Loading
measurement
and
the
empty
wrapper
obviously
doesn't
provide
that.
So
that's
why
it
gets
no
data,
but
don't
get
afraid
of
that.
So
the
series
you
were
talking
about
tim
is
exactly
covered
by
this.
A
This
thing,
so
we,
if
we,
if
we
take
the
project
scenario
right
so
let's
say,
project
home
route.
Okay,
so
we
want
to
know
when
we
start
rendering
the
the
files
and
when
we
finished
rendering
those
files-
and
these
two
marks
will
tell
us
either
we
start
rendering
way
too
late
or
we
start
rendering
fine.
But
it
takes
us
very
long
to
get
to
the
final
mark
so
to
to
identify
whether
the
problem
happens
before
this
or
between
the
start
and
the
end
marks.
A
A
What
affects
what
and
that
will
give
me
the
information
where
we
are
losing
time,
what
delays
that
event
or
that
event,
and
those
should
not
necessarily
be
put
into
into
the
code
permanent
permanently
right,
I'm
going
to
use
them
just
for
the
development
and
the
same
thing
for
the
projects.
So
we
know
that
there
is
a
problem,
for
example,
and
we
start
figuring
out
what
is
going
on.
A
We
technically
work
on
the
technical
discovery
on
how
to
improve
this
thing
and
we
just
sprinkle
the
marks
measurements,
and
then
we
get
much
better
understanding
of
what
is
going
on,
because
relying
our
judgment
just
on
lcp,
doesn't
really
give
us
any
data
right.
So
it's
just
it's
just
a
number
that
doesn't
tell
us
the
story
where
you
are
definitely
look
behind.
I
think
it
might
tell
us
that
we
are
losing
some
time,
but
where
exactly
no
chance.
B
This
deep,
diving,
exactly
yeah,
I
think
the
the
measure
marks
are
perfect
for
actually
finding
even
locally
stuff.
What
what
I
have
seen
simply
is
that
it's
sometimes
quite
hard,
so
you
so
the
user
timing.
Metrics
are
even
better
because
it's
that,
at
the
the
time
to
first
bite,
can
be
very
different
locally.
B
It
can
take
two
seconds
four
seconds
five
seconds,
two
second
three
seconds
so
really,
depending
on
how
your
machine
or
what
it
is
doing
right
now
it
gets
better
the
more
iterations
you
have,
but
I'm
I
was
looking
right
before
that
session
to
something-
and
I
was
running
gdk
measure-
four
runs
three
of
them
quite
the
same,
and
one
was
just
going
off
the
charts
in
red.
It's
like
double
the
timing
and
and
the
user
timing.
Metrics
are
taking
away
this
calculation
of
the
especially
times
the
first
byte.
A
Also,
keep
in
mind
that
I'm
actually,
I
might
confuse
the
things
but,
for
example,
if
we
want
to
to
technical
with
user
timing
metrics,
we
can
script
the
performance
make
this
part
of
our
pipelines
and
output.
The
information
I
have
the
script
locally
that
technically
runs
fi,
makes
five
runs
on
my
local
branch
on
my
local
instance
and
records
all
the
user
timing,
metrics
outputs,
the
average
for
me
for
all
the
marks
and
metrics
that
I
put
into
that
or
another
view,
and
that's
that's
a
good
basis.
A
I'm
not
sure
if
this
is
possible
with
lcp
without
actually
pulling
this
whole
webvipless
thing
that
does
some
magic
internally
with
user
metrics.
It's
much
easier.
You
just
you
just
run,
run
the
things
automatically
through
your
branch.
Compare
it
to
master,
we
are
done
like
do
we
degrade.
Do
we
improve
that's
it.
B
B
So
we
are
seeing
definitely
some
improvement,
so
especially
the
issue
list
which
was
above
the
improvement
mark,
is
now
going
below
it.
It
was
also
the
longer
weekend,
but
it
definitely
got
better
issue.
Detail
is
also
quite
the
same.
Then.
Our
lists
are
also
some
improvements,
so
I
see
like
a
nice
step,
but
the
bigger
topic
still
with
them.
Our
list
is
that
we
see
still
a
lot
of
fluctuation.
This
is
really
due
to
the
time
to
first
bite,
so
it
can
happen.
B
B
The
mr
detail
also
is
now
again
below
the
improvement
mark,
and
I
think
that
the
combination
of
the
things
that
we
are
doing
right
now
with
the
moving
the
dom
content
loaded
initialization
forward,
that
is
a
nice
improvement
and
and
simply
reducing
the
css,
is
having
a
nice
impact,
and
there
are
a
couple
of
bigger
css
files
that
are
currently
in
the
pipeline
that
I'm
really
looking
forward
to
seeing
getting
out
of
the
bundle.
So
this
should
bring
us
shortly
below
one
megabyte
uncompressed
but
optimized.
So
that
should
be
also
nice.
C
B
B
They
are
simply
misconfigured
at
the
moment
and
they
are
all
for
force
and
static
sites
that
are
not
measured
at
all.
So
we
need
to
clean
those
up
at
the
moment
and
then
should
have
a
better
overview,
as
we
are
closing
in
on
q4
start
and
to
know
what
we
need
to
improve
and
where
we
need
to
improve
more
of
those
speeches
and
as.
B
Is
not
perfect
for
all
our
use
cases,
but
I
think
we
have
still.
Eighty
percent
of
our
use
cases
at
the
moment
are
very
roughly
nicely
measured
by
sap,
but
what
is
measured,
but
it's
just
the
loading
of
that
page.
We
need
to
improve,
I
think
we
are
seeing.
We
are
going
into
an
evolution
most
probably
over
the
next
two
quarters,
which
is
really
going
from
cold
cash
and
speed
index
to
cold
cash,
lcp,
hot
cache,
lcp
and
then
getting
more
and
more
into
okay.
B
At
least
all
the
pages
are
loading
now
in
a
fine
way,
and
I
mean
everything
above
four
seconds
is
simply
way
too
much
so
improving
that
part
and
as
soon
as
we
have
the
loading,
it's
really
also
investigating
in
parallel,
then,
really
around
the
use
cases
really
introducing
the
user
timing
metrics,
and
also
not
only
just
loading
and
showing
stuff,
but
also
really.
How
long
does
it
take
to
submit
an
issue?
How
long
does
it
take
to
select
something
from
autocomplete?
B
How
long
does
it
take
a
full
workflow
from
creating
a
project
creating
an
issue
creating
an
mr
changing
two
lines,
committing
those
two
lines,
and
then
they
are
back
in
the
so
that
you
basically
test
the
full
workflow
and
the
full
system
on
that
and
yeah,
and
the
other
thing
is
that
what
what
also
is
nice
to
see
is
that
our
that's
the
wrong
list
wrong
link,
css
statistics
is
that
our
css
statistics
are
also
improving
at
the
moment.
So
all
those
super
huge
selectors
are
gone.
B
B
This
has
the
biggest
creation
of
of
stuff
at
the
moment
on
the
rules
side
in
select
two,
and
that
is
also
something
that
is
currently
in
the
process
of
getting
out
of
the
main
application
css,
and
that
should
show
us
some
nice,
some
more
nice
improvements.
I
believe
any
questions
on
those.
I
need
to
move.
B
What
we
need
to
investigate,
especially
the
front-end
side,
is
to
take
a
look
at
the
different
sizes
that
we
are
requesting,
as
we
have
some
components
that
automatically
simply
take
the
riff
and
the
height
and
just
request
it
directly
through
the
url
parameters.
So
that
is
something
we
need
to
figure
out
to
reduce
them
really
to.
B
B
B
B
It
also
as
any
backpack
bundle
at
a
later
point,
but
we
have
a
workflow
for
that
now
and
that
should
also
make
it
much
easier
and
one
thing,
but
I've
just
mentioned
that
is
I'm
trying
to
figure
out
if
we
can
identify
in
an
easy
way,
if
site
speed
is
testing
that
page
or
not
or
if
we
need
a
cookie
for
it.
I
took
a
look
at
the
navigation
user
agent
string,
it
doesn't
add
anything
lighthouse
does
now.
The
question
is
why?
B
Because
what
we
are
doing-
and
this
is
not
a
long
story-
is
for
the
emojis
and
no
it's
not
avatars.
I
love
to
mix
those
up.
It's
not
avatars.
It's
emojis,
so
for
emojis
different
os's
have
different
emoji
fonts,
which
have
different
emojis,
which
are
supported
so
windows
windows
is
the
best
example.
It
doesn't
support
any
flag,
emojis
natively.
B
B
Okay,
yours,
your
font
is
supporting
it
or
your
font
is
not
supporting
it,
which
is
definitely
a
high
cpu
task,
and
it's
not
something
we
should
measure
in
our
your
normal
workflow,
because
right
now,
every
time
you
hit
an
issue
list,
you
hit
an
issue,
you
hit
the
nmr
site,
speed
is
going
out
and
it's
drawing
this
map
to
a
canvas
and
it's
trying
to
figure
out
if
their
machine
is
supporting
it.
So
this
is,
this
is
not
even
cold
cache,
I
would
say
so.
The
idea
is
to
simply
have
a
check.
B
A
But
wouldn't
it
affect
the
the
measurements
really
because
if
we
access
the
same
route
with
the
real
browser,
we
will
still
draw
everything
to
the
canvas
and
this
will
take
time
but
for
site
speed.
It
won't
be
the
issue,
so
I
sightspeed
won't
tell
you
that
yeah,
okay,
you
spend
so
much
time
for
drawing
this
thing.
B
B
This
would
be
also
something
that
we
would
need
to
cover
so
that
we
get
more
realistic
measurements,
because
we
want
to
measure
what
the
user
is
actually
seeing
on
their
normal
visit,
rather
than
an
arbitrary
load,
something
from
a
clean
slate,
which
is,
I
think,
the
the
strategy
that
we
are
moving
into
with
starting
of
next
quarter.
We
most
probably
will
switch
to
a
hot
cache,
but
it's
a
hard
question,
so
the
idea
is
simply
to
figure
out.
B
B
The
other
thing
is
that
we
do
this
beforehand,
which
is
also
something
we
could
research
is.
Can
we
include
this
into
our
json,
because
the
mapping
that
we
know
of
is
much
smaller
by
now,
because
the
mapping
in
past
times,
which
emojis
were
supported,
which
not
was
much
much
much
much
larger.
So
this
might
be
something
that
we
is
also
investigate,
so
that
perhaps
we
just
draw
this
damn
canvas
check
for
10
different
items
that
anyhow,
everyone
knows.
I
don't
know,
I'm
not
too
much
into
that.
Emoji
unicode
world.
C
C
B
So
if
anyone
has
an
idea,
bring
it
up,
please-
or
I
will
bring
this
topic
also
to
tomorrow's
front-end
meeting
or
if
I
can't
try
at
least
set
it
on
their
changes.
So
if
someone
has
already
experienced
with
it-
and
I
think
yeah,
the
tracking
point
is
even
something
that
we
should
yeah
look
into
this
faster
than
later,
because
then
we
have
the
performance
improvement
and
we
are
also
getting
rid
of
funky
things,
and
it's
not
about
funky
things.
B
Thanks
for
that
input,
sarah
good
perfectly
landed
in
time,
not
too
bad
thanks
a
lot
again
for
coming
today.
I
wish
everyone
a
great
rest
of
your
week
and
see
you
soon
in
another
meeting,
and
I
will
put
this
as
soon
as
possible
on
unfiltered
so
that
everyone
who
was
today
on
their
pto
can
watch
it
tomorrow.
Take
care
and
thanks
again.