►
From YouTube: Data Discovery Set Function in Sisense
Description
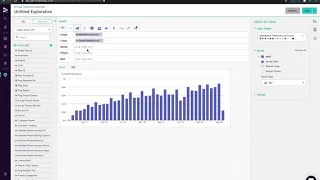
Tutorial on how to use the Data Discovery Function in Sisense.
A
Hi
everyone
I'm
going
to
show
you
how
to
use
the
data
discovery
function
in
science.
So
if
you're
not
familiar
with
sql-
and
you
wanted
to
look
around
our
data,
you
can
opt
to
use
this
function,
so
we
only
need
to
drag
and
drop
here.
No
coding
is
needed
so
as
an
example
we'd
like
to
get
the
total
number
of
per
month,
just
like
what
this
chart
is
showing.
A
A
A
A
A
A
Okay,
now
here
this
chart
is
actually
in
number
overlay,
with
the
discover
function
we
can
choose
which
chart
you
wanted
to
use
here.
So
in
this
case
number
overlay,
and
then
here
we
can
choose
which
chart
we
want
to
see
with
with
the
number
view
id.
So
we
can
use
bar
and
then
in
the
chat
format
we
can
choose
not
to
round
numbers.