►
From YouTube: 2020-12-03 GitLab.com k8s migration APAC
Description
Discussing progress and next steps for the GitLab.com Kubernetes migration
B
A
B
B
A
B
B
Call
last
night
and
they
always
go
like
every
time
we
have
one
of
these
calls
they
go
on
for
hours
and
hours
and
hours
and
everyone's
kind
of
asking
all
these
questions,
and
last
night
it
was
the
shortest
one.
Ever
it
finished
within
an
hour
which
was
amazing
because
everyone
wanted
to
get
to
the
pub.
So
I
was
like
I
don't
know
if
you
should
all
be
going
to
the
pub
on
the
same
night,
but.
A
A
B
B
B
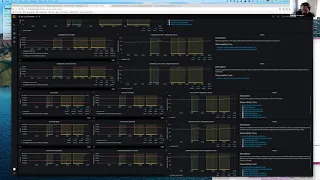
We've
obviously
got
web
git
api
et
cetera,
et
cetera,
et
cetera,
and
these
are
all
generated
from
from
jsonnet
using
graphonex.
So
what
I've
done
is
I've
added
this
little
descriptor,
which
kind
of
maps
out
the
the
layout?
Very
briefly
like
just
enough
that
we
need
for
monitoring
it's
not
like
a
full
descriptor,
but
it
kind
of
explains
as
much
as
we
need
for
monitoring
how
we're
deploying
things
in
kubernetes.
B
So
you
know
in
this
case
this
is
the
get
service
that
we
that
we've
got
here
and
we're
saying
it's
got
two
deployments.
One
called
git
lab
shell,
hi
jeff
and
then
one
called
get
https,
and
this
is
a
little
bit
of
there's
a
bit
of
technical
data
around
this
at
the
moment,
because
we
actually
match
that
up
with
a
tag.
Not
the
name,
and
so
the
name
of
these
deployments
is
in
many
cases
something
like
git
lab
web
service
or
web
service.
B
Yeah
and
the
the
reason
is,
is
that
it's
very
difficult
to
kind
of,
because
there's
multiple
deployments
in
multiple
services
that
are
called
web
servers,
for
example,
and
so
the
first
thing
we
thought
was
well,
let's
rename
those,
but
that's
obviously
more
challenging.
So
in
the
meantime,
what
we're
doing
is
we're
just
matching
on
a
tag
that
we
call
deployment
and
that
actually
goes
on
the
pod.
I
think,
if
I
remember
okay.
B
C
B
Yeah
yeah
yeah
that
that's
right,
so
the
label
is
called
deployment
but
mailroom
the
last
time
I
checked
this
might
have
been
fixed
since
I,
since
I
did
this,
but
certainly
mailroom
didn't
actually
have
that
label,
and
so
when
you
go
to
the
mailroom
dashboard,
it's
not
really
working
yet.
But
it's
that's
kind
of
I
mean
it'll,
be
much
nicer
when
we
can
just
go
on
the
name,
but
that'll
that'll
take
time
and
it'll
be
less
sort
of
repetitive,
but
yeah.
B
So
anyway,
for
for
now
it's
kind
of
like
really
just
like
a
toe
hold
like
for
for
more
things.
But
you
know
here:
we've
got
the
the
git
dashboard
and
I'm
actually
I've
just
pushed
a
merge
request.
So
we
can
start
linking
directly
to
these
dashboards
from
the
from
the
alerts
which
at
the
moment
you
don't
get
to
them,
which
has
always
bugged
me
so
finally
fixing
that
so
now
we've
got
over
here
this
kubernetes
overview
and
if
you
open
that
up.
B
It's
actually
on
this
level.
It's
it's
aggregating
everything
to
the
cluster,
so
you
can
see.
We've
got
these
three
clusters
and
you
can
see
at
the
moment
it's
just
cpu
memory
and
network,
and
the
next
thing
that
we'd
like
to
bring
online
is
the
hpa
stuff,
but
we
need
more
labels
for
that
because
of
the
same
reasons
and
I've
I've
seen
I
haven't
been
following
it,
but
there's
a
lot
of
activity
on
an
issue
around
that.
B
So
yeah
yeah
we
can.
We
can
totally
do
that
at
the
moment.
In
fact,
I
don't
it
might
have
just
got
lost
in
that
first
release
because
there
were
so
many
things
that
were
changing.
Let
me
just
show
you
what
else
we've
got
here
so
basically,
if
something's
got
so
close
all
this
stuff,
if
something's
got
kubernetes
deployments
now
we
have
this
little
thing
up
at
the
top
here.
That
gives
you
it's
got
a
little.
A
B
I'm
surprised
I
I
started
doing
it
and
I've
oh,
I
know
why
I'll
I'll
tell
you
why
afterwards,
but
so
this
is
the
container
detail,
and
this
again
it's
very
unfinished,
but
it's
like
it's
a
toe
hold
right.
What
I
was
doing
originally
was,
I
was
plotting
all
the
containers
on
here,
but
I've
just
found
that
it's
it's
too
much.
It's
too
much
information,
there's
like
100
series,
and
so
we've
got
this
kind
of
pretty
quantile
graph.
B
So
it's
like
you
know,
99
of
the
containers
are
below
41
percent
and
we've
got
that
for
memory
as
well,
and
so
these
little
spikes
at
the
bottom
are
obviously
as
a
new
container.
Rambusan
comes
online,
so
we
get
you
know,
five
percent
are
ten
percent
or
less
than
that,
and
and
so
that
kind
of
gives
you
you
know
here,
you
can
see
the
difference
between
99
and
95.
B
That
probably
tells
me
that
there's
one
gitlab
shell
container-
that's
that's
kind
of
you
know
in
a
mess
at
the
moment.
Now.
One
of
the
other
things
that
I
really
want
to
add
soon
is
a
way
to
navigate
from
this
and
it'll
probably
be
collapsed,
rose
on
this
dashboard,
but
down
to
like
the
full
like
sipping
the
fire
hose
detail,
so
you
can
see
which
container
it
is.
That's
that's
pinned
up
at
the
top,
but
we
don't
have
that,
but
it'll
come
and
you
know
there's
so
much
more.
B
It's
kind
of
like
almost
an
endless
amount
of
work
with
this
stuff.
When
I
start
looking
at
it,
it's
just
like
whoa.
That's
why
I
keep
saying
it
it's
the
beginning,
and
then
this
is
at
the
moment.
This
deployment
detail
is
exactly
the
same
information
you
see
on
the
on
the
service
overview
page
and
it's
just.
C
B
That's
that's
right,
so
each
row
is
one
of
the
deployments.
So
the
first
row
is
the
get
https
deployment
and
then
the
columns
are
cpu
memory
network
at
the
moment
and
then
the
next
row
down
is
the
get
lab
shell
deployment
on
the
I
I
don't
have
we
don't
have
the
the
requests
and
limits,
but
we
do
have
the
oh
yeah.
That's
that's
right!
So
we.
B
B
B
B
Oh,
I
know
why
this
is
because
it
splits
across
three
prometheuses.
I
need
to
work
this
out,
but
it's
probably
because
mostly
saturation
metrics
are
recorded
in
prometheus
and
this
one
is
actually
across
three,
but
you
can
see
here.
This
is
this
is
based
on.
You
know
the
the
limits
so
basically
memory
wise
we're
sitting
at
about
50.
B
If
this
goes
up
to
100.
Theoretically,
we
would
get
alerts,
but
I'm
guessing
that
because
we
don't
have
that
recording
rule
we're
not
going
to
get
the
alerts.
I
need
to
take
a
look
into
that
and
what
we've
done
there
with
the
with
this
cube
container
memory,
we
can
do
exactly
the
same
thing
with
the
cpu
as
well,
and
we
just
it's
just
a
matter
of
getting
it
done
and
then
we've
actually
got
the
hpa
one
already,
but
the
problem
with
the
htso.
B
B
B
B
B
Stuff
in
flux
but,
like
I
think,
we're
making
progress
and-
and
you
can
see
here-
this
is
kind
of
one
of
the
side
effects
of
of
what
we
hack
when
we
don't
have
the
correct
labeling.
So
you'll
start
seeing
these
really
nicely
regular
expressions
and
captures
and
stuff
and
yeah.
The
reason
is
because
of
of
the
lack
of
labels,
so
you
know
when
we're
done.
Hopefully,
there'll
be
no
more
nasty
levels
like
nasty,
regular
expressions
in
the
label
matches
cool
is
that
is
that
explained.
C
B
C
Poking
at
the
cons,
the
cli,
we
don't
really
have
much,
the
only
other
thing
I'll,
add
and
I'm
not
even
sure
if
this
is
potentially
relevant.
But
maybe
when
we're
thinking
of
the
drill
down
screens
something
to
capture
what?
If
there's
I'm
wondering
if
a
visualization
of
what
the
number
of
pods
we
have
versus
pod
disruption,
budgets
and
things
would
be
useful.
B
C
So
it's
it's
not
important.
It's
probably
not
important
to
an
sre
diagnosing
it.
Well,
it's
been
likely
to
be
imported
to
an
sre
diagnosing
an
issue,
but
for
when
we're
doing
speed
of
deployments
and
like
upgrades
cycling,
nodes
hpa
can
potentially
get
stuck
with
a
bad
disruption
budget
and
things
like
that.
B
D
C
Out
stalled
for
about
an
hour-
and
I
realized
now
like
I
can't
shut
down,
because
I
can't
terminate
this
pod,
because
your
pod
disruption
budget
says
that
I
cannot
actually
allow
any
pods
to
go
down
and
you've
got
pods
on
me
that
I
cannot
terminate
it's
not
a
big
issue,
and
I
guess
I
bring
it
up
because
it
affects
me
doing
these
upgrade
work
more
than
anything.
But
it
did.
D
C
Yeah,
so
it's
the
ingress
engine
next
one
and
I
wasn't
sure
if
it
was
we're
getting
off
topic
here,
but
I
wasn't
sure
if
it
was
because
I
was
during
the
load
period
when
the
horizontal
pod
order
scaler
was
going
on
or
something
but
it
was
like.
It
was
telling
me
yeah.
I,
your
pod
destruction,
budget
fingers
engine
x
is
two
and
there's
only
two
pods
running.
Maybe
it
was
the
canary
deployment
or
something,
and
it
just
would
flat
out,
refuse
to
move
I'll.
C
Does
it
stall
and
waits
it?
Well,
it's
kind
of
it's
so
kubernetes
will
go.
I
can
I'm
trying
to
drain
the
node
but
to
drain
the
node.
I
delete
these
two
this
pod,
but
I
cannot
delete
this
pod
because
it
violates
your
pod
disruption,
budget
and
then
gcp.
So
gpi
will
go.
I'm
just
gonna.
I
can't
drain
the
node
and
therefore
I
can't
terminate
it.
I'm
just
gonna
stop
and
sit
here
and
do
nothing.
B
C
C
C
C
C
C
And
I
think,
as
I
said,
I'm
pretty
sure
the
situation
that
I
got
caught
out
by
was
probably
because
it
was
the
horizontal
pot
audio
scale.
I
just
scaled
things
down
so
much
and
then
the
pod
disruption
budget
is
fixed
to
two
in
the
get
lab
chart
or
it
was
fixed,
the
two
and
and
yeah.
So
I'm
pretty
sure
it's
just
a
misconfiguration
issue
or
something
like.
A
D
So
so
we
left
yesterday
with
some
changes
that
we
were
going
to
do.
I
I'm
still
catching
up,
but
it
sounds
like
that.
The
first
change
was
to
change
the
health
check
for
the
kubernetes
cluster,
so
currently
in
aj
proxy
we're
using
slash
readiness
for
checking
the
health
of
the
cluster,
and
we
realized
realized
yesterday
that
this
was.
D
This
is
not
a
good
way
to
check
the
health,
because
what
we
see
is
when
we
terminate
pods,
we
see
some
requests
that
are
going
through
to
a
pod,
that's
in
the
process
of
being
terminated,
which
will
then
fail
the
readiness
and
that
could
potentially
bring
the
cluster
out
of
service
completely,
and
we
do
see
when
we
look
at
the
graphs
we
look
at
when
we
look
at
prometheus.
We
do
see
that
clusters
are
occasionally
being
marked
as
down,
so
this
is
not
good.
My
suggestion
was
to
change
it
from
readiness
to
health.
D
This
is
like
a
very
old
readiness
health
check,
endpoint
that
we
used
to
use,
I
think,
was
the
first
one.
We
created
there's
three
of
them:
there's
readiness,
health
and
liveness
that
was
rolled
out
on
staging
and
then
from
what
I
saw
on
the
on
the
issue.
It
started
to
be
rolled
out
on
production,
and
then
we
saw
the
problem
on
canary,
so
we
rolled
it
back,
so
I
need
to
figure
out.
What's
going
on
with
that,
we.
A
D
D
D
D
B
B
D
D
B
D
B
D
Right
so
so
this
is
a
story
about
we
have
like
one
pod
and
we're
seeing
a
bunch
of
requests.
What
I
wanted
to
do
was
just
show
when
we
start
seeing
502s
from
this
pod
and
when
the
health
check
starts
failing
to
do
that,
we're
going
to
have
to
split
this
out
by
filters,
so
we'll
do
a
we'll
do
a
split
chart
to
start
with
the
filter
and
the
first
filter
is.
D
D
D
This
is
staging,
so
there
isn't
as
much
going
on
here.
First
thing
I
see
here
is
that
we
have
some
401s
and
then
we
get
a
little
502
at
the
end,
and
this
is
really
what
we
want
to
avoid.
This
is
a
user
facing
502,
and
when
we
see
this
on
prod,
it
looks
even
a
bit
worse
now
I
don't
know
whether
we
have
made
any
of
the
nginx
configuration
changes
in
staging.
Yet
I
haven't
fully
caught
up.
Yes,.
D
D
D
D
What
we,
what
we
don't,
I
guess
what
we
don't
really
expect
is
to
see
any
of
these
readiness
check
failures
at
all,
because
what
we
hope
to
happen
is
that
kubernetes
will
switch
a
pod
to
terminating
and
as
soon
as
it
does,
that
we'll
stop
routing
requests
to
it.
What
we
see
instead
is
that
we're
seeing
readiness
checks
like
going
down
into
the
pod
and
returning
a
503,
even
though
the
pod
is
in
the
process
of
being
terminated,.
B
Jeff,
could
you
just
just
to
help
me
understand
this
a
little
bit
more?
Would
you
mind
going
and
changing
the
the
time
in
the
days
histogram
to
start
time,
because
then,
if
it'd
be
interesting
with
those
503s
that
we
see
in
the
top
there,
what
time
they
started
like,
were
they
so
in
the
dates
histogram?
You
can
see
field
next
next
column
down
and
then,
where
it
says
json
time,
that's
the
time
that
the
log
happened,
which
was
at
the
end
of
the
request.
Sometimes
the
start
time
is
much.
B
I
thought
workhorse
did,
but
maybe
it
doesn't,
we
should
put
it
on
if
it
doesn't,
because
it's
super
helpful
for
this
kind
of
stuff,
because
then
you
know
if
that
request
was
stalled
for
like
five
minutes
or
whether
it
was
dripping
in
like
during
the
shutdown
phase
right.
But
if
we
don't
have
it
now,
we
don't
have
it.
I
mean.
B
B
C
I'm
still
trying
to
wrap
my
head
around
once.
My
understanding,
which
is
could
be
wrong,
is
because,
when
a
potter's
mark's
terminating
and
when
the
signals
are
sent
to
it
versus
when
it
gets
removed
from
the
service
is
there's
no
guarantees
in
the
way.
So
I
don't
see
how
we're
ever
going
to
avoid
at
least
seeing
a
little
bit
of
503
on
the
readiness.
D
C
C
D
D
D
D
B
D
C
B
C
Yeah,
I'm
just
trying
to
mentally
map
how?
Because
we've
got
because
there's
like
nginx
in
the
middle
of
this
right,
because
you've
got
standard
kubernetes
service,
but
then
you've
got
nginx
and
it
sounds
like
even
things
higher
up
of
engine
x
proxy
like
trying
to
call
readiness.
Is
that
correct?
Is
that
h,
a
proxy.
D
D
Yeah
we
can
take
a
look
at
the
user
agent
we
did
have
like
I
mentioned
at
the
beginning.
We
had
aj
proxy
using
this
readiness
endpoint
as
well,
and
I
think
that
was
a
mistake
right.
But
but
one
thing
I'd
like
to
show
here:
if
we've
already
made
this
configuration
change
on
staging,
so
the
pod
was
started
stopping
at
803
and
we
were
successfully
sending
a
200
all
the
way
up
to
807..
C
C
D
D
C
D
C
C
Anyway,
we
can
we
we
we
should
try
and
and
see
what
we
can
glean
from
that,
because
that
should
have
some
messages
about
when
the
end
points
are
up
like
when
it's
like.
I'm
updating
my
like
I'm
updating
my
node
to
remove
that
pod
from
being
routed
to,
but
that's
only
for
new
connections
for
existing
connections,
there's
always
like
global
iq
tables
rules
that
are
like.
If
it's
data
for
an
existing
connection,
I
will
always
like
wrap
that
data.
D
And,
and
when
I
did,
this
testing
like,
I
definitely
saw
the
end
point
being
removed
like
I
was
looking
at
the
service
and
the
ip
address
for
the
pod
was
being
removed
by
the
service
endpoint.
But
we
were
still
able
to
send
messages
through
nginx
ingress
and
what
we
observed
yesterday
was
that
if
we
just
did
a
nginx
reload,
then
the
messages
would
stop
yeah.
So
it's
like
nginx
was
holding
on
connections
to
the
pod.
Somehow,
even
though
it
was
removed
from
the
service
endpoint.
C
D
C
C
D
C
D
Even
with
it
turned
on,
he
said,
nginx
doesn't
actually
reload,
there's
some
other
code
in
the
load
balancer
that
updates
those
endpoints.
But
I
I
didn't
look
into
it,
but
I,
I
suspect
that
there's
something
happening
on
nginx
when
we
don't
have
this
direct
service.
Endpoint
enabled
that
that
that
prevents
this
from
happening.
C
C
Nginx
it
will
go.
It
will
see
that
the
endpoints
to
change
and
reload
the
configuration
which
will
probably
drop
the
connections-
that's
bad.
If
you
have
a
lot
of
pods
like
like
thousands
of
pods,
because
you,
like
you
know
every
time
the
pod
changes
you're
reloading
nginx
constantly,
but
I
think
for
us
it
might,
or
all
I'm
wondering
is
I
put
in
that
comment-
is:
have
we
traded
one
set
of
problems
for
another?
By
with
this
annotation?
Have
we
fixed
one
set
of
problems
but
introduced
another.
C
D
C
D
C
Deploy
it
separately
like
yeah,
you
can
do
a
whole
like
just
other
helm,
release
of
it.
That's
just
could
even
be
sitting
in
a
different
name
space.
If
you
really
wanted
to
keep
it
separate,
but
just
pointing
across
to
the
right
service
or
yeah
yeah,
and
then
testing
that
and
then
you
could
just
change
the
ip
I'm
going
to
point
to
the
chart
and
inverse
engine
x
and
I'm
going
to
point
to
the
other
one.
C
C
C
D
Yeah
I
was
looking,
I
didn't.
I
wasn't
able
to
find
anything:
okay,
okay,
well,
that's
sort
of
where
we
are
today.
What
I'm
probably
going
to
do
is
kind
of
look
to
see
what
happened
with
the
other
health
check
and
yeah
we'll
see,
but
it
sounds
like
we
may
need
to
put
some
pressure
to
get
the
nginx
ingress
upgrade
up.
You
know
done
sooner
or
later.
A
D
Yeah
the
update
on
traffic
splitting
is
that
it
looks
like
it's
moving
along.
The
last
update
I
saw
from
skarbik
was
that
he's
he's
pretty
happy
and
the
mr
has
moved
to
maintain
a
review,
so
I
think
we're
we're
in
good
shape
there
I'd
like
to
try
it
myself.
I
haven't
been
doing
any
of
the
testing
myself
yet
so
maybe
I'll
have
time
to
do
that
today,.
A
D
The
nginx,
the
nginx
issue,
the
like
high
availability,
no
downtime
upgrades
for
engine
x,
there's
one,
mr
that
I'm
that
should
be
able
to
get
reviewed,
hopefully
in
the
next
day
or
two,
and
I'm
still
still
haven't
rolled
that
out
to
production.
This
is
ensuring
that
nginx
drains
connections
before
recycle
pods,
but
that's
running
in
staging.
It's
been
running
staging
for
a
few
days
now.
So
I
think
we
can
pull
that
out.
A
C
Yeah,
I'm
I'm
wondering
now.
The
regional
cluster
is
the
regional
cluster,
but
I'm
wondering
now
with
the
zonal
clusters,
especially
if
we
do
it
during
a
quiet
period.
If
we
just
drain
the
whole
cluster,
do
a
helm,
delete
of
the
helm2
release
and
then
just
do
a
helm,
install
of
the
helm,
rig,
3
release
and
then
just
add
it
back
in
rather
than
trying.
D
C
C
D
D
C
I
I
guess
I
I'll
read
the
notes
at
some
point.
Oh
and
I'd
like
to
understand
yeah
how
much
skavic
thinks
it's
like
like
how
bad
is
the
upgrade
process
like
because
if,
at
the
end
of
the
day,
helm
data
is
just
stored
in
secret
objects
in
kubernetes,
you
know
like
that.
You
can
just
delete
them
by
hand
and
make
them
go
away
or
like
yeah,
there's
nothing.