►
From YouTube: Adding new pages to performance testing (and updating!)
Description
Quick introduction to the page load performance testing framework and dashboards, and how to maintain them.
A
Hi,
I'm
josh
lambert,
a
product
manager
here
at
get
lab,
and
today
I
thought
I
could
bought
a
new
tool
that
we
have
available
for
product
managers
and
our
engineering
teams
to
better
understand
the
perceived
performance
of
the
workflows
that
they
are
building.
So
this
is
the
performance
that
end
users
experience
as
they
interact
with
gitlab.com.
A
We
have
added
documentation
to
the
product
manager,
handbook
pages.
You
can
find
a
link
off
of
the
responsibilities
section
of
the
roll
page,
and
this
is
underneath
the
part
that
establishes
that
pms
are
responsible
for
the
cost,
profile
and
user
experience,
and
here
are
some
links
to
various
tools,
to
help
pms
understand
that
and
we
are
adding
to
them
of
course,
and
we
have
just
added
the
page
love
performance
tool
here,
so
this
links
off
to
the
product
processes,
documentation
page
and
provides
more
information.
A
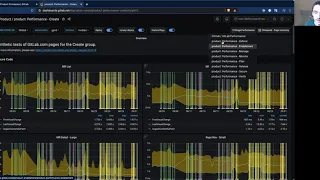
So
we
are
utilizing
sitespeed,
which
is
a
performance
testing
framework
which
provides
the
core
metrics
and
testing,
and
we
take
those
and
we
display
them
in
grafana
we
have
a
stage
dashboard
dedicated
for
each
stage
and
you
can
go
through
and
take
a
look
at
this.
For
example,
you
can
see
we
had
quite
a
lot
of
pages
already
instrumented.
I
think
we're
up
over
70,
for
example
across
all
the
stages,
and
you
can
turn
off
some
of
the
additional
flags
here.
A
A
The
other
quick
thing
here
is
that
each
of
these
also
references
the
page
that
is
being
tested
here,
for
example.
So
if
I
click
here,
I
can
see
the
exact
url
that's
being
tested,
and
so
that's
also
available
to
make
sure
we
understand.
You
know
what
exactly
we're
testing
here
and
you
can
go
verify
that.
A
A
The
key
here
is,
you
want
to
have
the
url
and
then
an
alias,
so
it's
easier
to
find
in
site,
speed
and
reference,
so
you
can
see
here,
for
example,
we're
testing
things
like
source
code,
mr
list
for
the
list
of
mrs
generally,
that
the
convention
is,
as
noted
here
group
feature
and
detail.
It
has
to
be
one
word
now.
The
other
detail
here
is
that
we
have
authenticated
and
unauthenticated
options
under
within
the
is
the
easiest.
A
A
That's
pretty
easy:
you
can
go
ahead
and
submit
a
merge
request.
We
have
a
sample
one
here
which
is
linked
off
to
and
you
can
take
a
look
at
it.
This
was
done
by
marcus
and
you
can
see
again
it's
pretty
straightforward.
You
can
edit
some
urls,
you
can
change,
you
can
edit
some
aliases
and
overall,
it's
pretty
easy
to
maintain.
A
Once
you
have
that
that
done
sites,
people
go
ahead
and
start
testing
it,
but
it
takes
about
eight
or
eight
to
ten
hours
to
kind
of
get
through
its
testing
list,
because
we
have
a
lot
of
urls
we're
testing.
So
don't
be
surprised
if
you
don't
see
the
results
immediately
in
grafana,
but
once
you
have
that
added
to
the
testing
list,
you
then
now
need
to
have
go
ahead
and
add
it
to
the
griffonette
page.
Corfuna
is
what
we
use
to
make
maintaining
these
dashboards
easy
and
we
can
edit
them
in
bulk.
A
If
you
want
to
change,
for
example,
the
metrics
that
we
display
each
stage
does
have
its
own
json
file,
and
so
you
can
take
a
look,
for
example,
at
the
create
page.
If
you
want
to
see
how
it's
laid
out
overall,
most
of
stuff,
you
don't
need
to
worry
about,
but
down
here.
Essentially
it
is
a
row
for
each
group
and
then
there's
some
json
here
and
then
you
can
see
how
we
call
a
function,
product
common
page
detail
and
we
simply
pass
in
some
pretty
simple
parameters.
A
A
So,
let's
keep
heading
down
and
again
we
have
a
lot
of
items
being
tested
here.
So
you
can
see
here
we
have
wiki
history
with
the
pages
wiki
ascii
doc,
and
the
new
charts
that
are
now
available
just
might
take
a
second
for
these
to
load
again
because
we
have
so
many
dashboards.
So
that's
great!
You
can
see
here.
This
was
merged
yesterday
and
you
can
see
we
already
have
some
of
these
being
updated.
In
this
case,
you
can
see
that
there's
not
a
lot
of
content
up
until
just
now.
A
So
that's
what
it'll
look
like
and
you
can
see
it's
accessible
pretty
quickly
again
the
site,
speed
changes
take
about
eight
to
twenty
hours,
but
the
component
as
soon
as
it's
merged
will
take
effect
immediately.
If
you
have
any
questions,
please
come
find
me
or
others,
and
we
can
help
you
guys
start
it
as
well.
Thank
you
so
much.