►
From YouTube: Elastic-LogExplorer-walkthrough-part2
Description
No description was provided for this meeting.
If this is YOUR meeting, an easy way to fix this is to add a description to your video, wherever mtngs.io found it (probably YouTube).
A
A
A
A
A
A
A
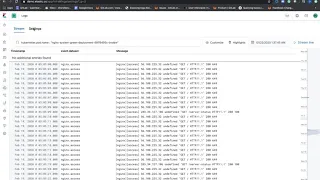
And
if
I
have,
if
I
have
data
gaps
which
I
don't
have
here,
I
would
be
able
to
see
it,
though,
if
I
heard,
the
stream
of
log
that
arrived
in
a
specific
time,
I
would
see.
I
would
see
a
histogram.
So
here
in
this
demo,
there
is
a
constant
stream
of
log,
and
this
is
why
it
looks
like
that,
in
terms
of
the
time
picker
I
can
only
choose
a
specific
point
in
time
that
I
want
to
get
into
and
if
I
choose,
for
instance,
8
a.m.
A
A
And
it
is
also
using
the
saying,
the
search
bar.
It
is
also
using
this
query
language,
the
K
key
well,
to
keep
on
a
query
language.
If
I
will
I
will
just
start
typing
a
keyword
and
the
previous
example.
We
looked
at
kubernetes,
so
I'll
just
start
typing
and
it
will
automatically
Auto
cook
do
not
want
a
complete,
but
it
will
provide
the
other
suggestion
that
are
available.
So,
let's
look.
Let's
look
at
the
name.
A
A
A
A
A
So
this
is
where
this
is.
The
souls
of
the
Dead
indices
that
I
can
I
can
select
or
I
can
choose
the
log
spot
to
look
at.
So
basically,
all
the
logs
that
I
don't
see
you
all
the
logs
that
are
coming
form
to
elasticsearch
I,
see
only
specific
indices
with
with
these
parameters
that
are
coming
from
file
bait
style
and
also
cabanas
sample
data
logs,
and
so,
if
I
have
a
different
index
and
some
some
user
can
configure
the
own
index,
then
I
would
need
to
change
the
name
here.
A
A
A
You
know
so
this
is
this
is
this
is,
for
instance,
uptime
monitoring
so
and
I'm?
Looking
at
the
specific
URL
and
I
see
if
it's
up
or
down
I
can
go
to
here,
I
should
be
able
to
see,
show
pot
logs
if
I'll
click
on
this
one
I
would
be
redirected
to
the
log
Explorer
and
the
search
bar
will
get
pre
populated
by
the
pod
ID.