►
From YouTube: Dogfooding metrics - APM/Infra check in
Description
No description was provided for this meeting.
If this is YOUR meeting, an easy way to fix this is to add a description to your video, wherever mtngs.io found it (probably YouTube).
A
B
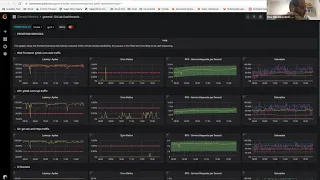
So
there's
three
triage
dashboards
that
we
that
we
use
this
is
the
first
of
them
and
this
is
kind
of
a
new
one.
It
hasn't
really
gained
traction,
but
I
like
its
simplicity.
So
it's
basically
like
the
key
services
like
you
know,
the
Web
API
get
like
the
stuff
that
uses
interact
with
and
like
the
health
of
it,
and
these
are
our
four
key
metrics
for
each
of
those
services.
B
So
it's
very
simple
I
find
it
quite
quick
to
just
take
a
look
at
it
at
one
glance,
the
one
that
the
ops
team
use,
probably
a
bit
unpopular
for
saying
this,
but
I
think
this
is
a
bit
legacy,
but
that's
my
take
on
it.
This
is
this
is
the,
but
this
is
the
de-facto
one
like
if
you're
in
the
one
of
the
reliability
teams.
This
is
what
you
look
at
every
day.
I
think
you
know,
I,
don't
think
you
guys
need
to
kind
of
recreate
this
there's
so
much
stuff
on
here.
Mmm-Hmm.
B
Know
how
much
of
us
genuinely
used
so
there's
that
one
and
then
there's
this
one,
which
is
not
great
either
I'll,
be
honest,
the
Sun
I
created
and
it's
a
bit
noisy,
but
what
it
is
is
that
it
shows
all
of
the
key
metrics
bundled
together,
so
chose
all
of
the
apdex
scores
for
all
of
the
services.
So
if
one
is,
if
one
service
is
behaving
badly,
it'll
be
down
below
everything
else,
and
so
you
can
see
here.
B
Normally
everything
should
be
at
100%
for
the
app
that
score,
and
you
can
see
here
that
some
things
are
I
sort
of
down
there
and
then
we
actually
use
you
know
it
said:
schools
are
it's
it's.
Basically,
its
standard
deviation
right.
So
if
we
look-
and
we
say
like
the
standard
deviation
of
this
metric
is
like
it,
you
know
we
kind
of
expected
to
move
within
this
range
and
how
many
standard
deviations
away
from
its
median
value.
Is
it
that's
called
a
Zed
school.
B
It's
like
a
static
thing
and
what's
quite
nice,
is
that
you
can
kind
of
defer.
You
know.
Six
Sigma
is
their
classic.
Like
is
six
standard
deviations
away
from
the
mean
which
is
actually
kind
of
impossible,
because
nothing
is
really
like.
That's
a
very,
very
rare
sort
of
event,
but
obviously
you
need
normalize
that
Gaussian
data
to
do
that,
and
but
you
can
see
here
so
he
measures
its
course.
I
mean
I'll,
be
honest,
I,
don't
know
this.
This
dashboard
hasn't
been
a
great
success.
B
I
would
say
it's
between
this
one,
which
has
got
a
lot
of
stuff
that
you
don't
need
to
recreate
and
then
maybe
like.
If
you
just
you
know,
kind
of
creating
something
like
the
general
public
splash
screen.
I
would
I
would
say,
go
with
something
like
this,
like
a
triage
dashboard
that
people
can
take
a
look
at
that
just
gives
you
like
an
overall
view
of
the
system.
The
other
thing
to
kind
of
keep
in
mind
or
think
about.
Is
you
know
we
being
this
transfer
this
transparent
company?
We've
got
a
public
refiner
instance.
B
And
that
there's
the
screen
that
we
open
up
on
here
is
this:
like
I
I,
don't
I'm,
not
a
big
fan
of
this
one
either
because
you
know
like
Italy
customers,
don't
really
need
to
know.
What's
going
on
and
giddy
it
doesn't
affect
them
directly.
They
should
you
know
we
should
be
telling
them
about
the
things
that
affect
them.
So
this
is
the
the
official
public's
splash
screen
at
the
moment.
B
But
the
reason
I'm
showing
is
is
because
we're
we
might
get
some
traction
is
by
building
a
dashboard
for
our
customers
right,
because
this
is
the
one
that
you
know.
Customers
can
go
to
it's
not
very
helpful.
You
know
I
would
like
to
see
them
see
this,
but
again
it's
not
amazing,
but
maybe
we
should
be
sending
our
users
and
our
customers
and
good
luck
come
to
the
dashboard
that
runs
in
gitlab
calm,
something
to
think
about,
like
maybe
it's
a
slightly
medium-term
plan,
but.
A
A
B
B
A
B
A
B
B
A
B
Fixed
yeah,
so,
okay,
in
that
case,
if
the
two
most
important
ones
are
latency
now
this
latency
upticks
and
area
ratios.
This
request
per
second
is
actually
less
important
like
because
the
thing
that
affects
users
is
not
how
many
requests
we're
dealing
with
but
like
how
slow
their
requests
are
and
how
many
errors
they
sing
right.
So
if
you
were
to
do
a
two
by
two
I
would
say
it's
these
two
columns
here.
A
B
Yeah,
because
that
would
be
I
mean
something
else
to
think
about,
like
I
would
really
really
like.
So
all
of
the
stuff
is
specific
to
get
lab.
Comm
like
I,
think
this
is
the
first
conversation
I
had
with
Clement
about
this.
Was
you
know
we
don't
have
this
in
the
product
and
I
have
kind
of
been
like
building
the
stuff
in
a
way
that
we
can
take
it
and
move
it
into
the
product
at
some
point
and
and
JSON.
B
It
is
very
much
part
of
that
because
with
JSON
and
we
can
recompose
the
queries
so
that
they
work
in
the
application
as
well
and
so
something
to
just
think
about
or
put
in
your
head
and
let
it
lie
there
is:
can
we
take
these
dashboards
and
ship
them
by
default
with
the
product
so
that
administrator
I?
Suppose
it's
a
different
team?
You
guys
aren't
really
thinking
about
that,
but
it
should
be
with
your
dashboards
right.
We
should
be
using
the
dashboards
that
you
guys
have
built
for
the
self-help
self
health.
B
B
B
A
Yeah
I
mean
yeah
I,
just
had
a
conversation
with
my
godness
I.
Think
that
you
know
to
some
extent
external
users
are
not
good.
Labels
can
expose
matrix
in
by
themself.
If
they
have
the
knowledge,
maybe
we
can
provide
them
with
the
guidance
on
how
to
do
it
once
they
can
expose
anymore.
They
want
that's,
that's
a
different
conversation,
but
it's
a
good
idea.
Yeah.
B
A
B
What
what
I'm
planning
on
doing
kind
of
like
outside
of
that
is
a
lot
of
people
have
come
to
me
at
conferences
and
stuff
and
said,
like
very
few
people
take
what
they
do,
with
dashboards
and
and
also
with
Prometheus
queries
and
and
put
it
online
and
loads
of
people.
Come
to
me
and
says:
you'll
run
books
repository
where
all
of
this
stuff
is
kept
is
like
it's
kind
of
like
the
go
to
like
I.
B
And
so
the
first
thing
that
I'm
going
to
do
is
I'm
going
to
take
that
stuff
and
I'm
going
to
use
the
JSON
it's
to
generate
bunch
of
files
that
those
power
users
can
install
into
their
Prometheus
and
into
the
graph
on
to
get
all
these
dashboards
right,
like
all
really
nice
ones
and
then
and
then
maybe
as
a
future
step.
We
can
actually
put
it
in
the
product,
but
that'll
be
like
the
first
step
in
that
direction.
Yeah.
A
A
Okay,
the
next.
The
next
thing
is,
we
discuss
also
the
slackline
application,
which
we
know
that
it
is
from.
What
I
understand
we
understood
is
that
it
is
printing
like
the
URL
of
the
of
the
graph
on
a
dashboard,
and
the
question
is:
can
we
change
is
to
change
it
to
print?
Also,
the
the
gait
lab
link
for
the
child
link
for
the
get
labs
dashboard.
A
B
B
I
was
like
oh
well,
I
have
to
use
this,
but
if
someone
in
the
team
submits
a
merge
request,
assign
it
to
myself
or
amar
Mars
kind
of
taking
over
that
project
to
some
degree
and
I'll
just
put
a
link
to
his
I,
just
I,
just
pinged
you
with
his
with
his
handle
in
there
and
and
if
they
they
can.
You
welcome
to
send
America's.
Do
you
know
where
the
slackline
project
is
kept.
B
B
And
then
they
and
then
they
go
to
the
web
page,
they
navigate,
they
take
a
picture
of
the
panel
and
then
they
turn
that
into
a
PNG
file
and
obviously
you
guys
aren't
gonna
have
that
with
with
your
dashboards.
But
it's
probably
fine,
like
you
know,
we
don't
need
that
and
and
getting
involved
with
the
headless
browsers,
it's
a
bit
of
a
pain.
You
know
we
don't
need
we
shipping
that
as
part
of
the
product,
so
yeah.
B
B
There
is
a
second
way
that
we
can
do
it
by
just
sending
by
configuring
the
alert
with
some
some
links,
but
let's
see
figure
out
if
they
struggle
with
that
approach,
then
there's
another
way
so
accept
this
and
okay.
This
really
isn't
working
then
come
back
to
me
and
I
can
I
can
explain
it
away,
but
it's
a
little
bit
more
intricate,
but
it
should
be.
It
should
be
trivial
to
add
it
in
there.
B
B
It's
quite
a
lot
of
stuff
in
there,
but
basically
this
is
like
a
rosetta
stone
like
in
the
same
way
that
you
know
the
product
people
use
stages
like
yamo,
and
it's
got
like
all
the
stages
and
all
the
people
and
all
the
engineering
managers
and
everything
and
that
file.
So
we've
got
this
thing
called
Service
Catalog
and
it's
like
all
the
services
and
then
like
all
the
dashboards
and
all
the
links
and
all
the
queries
and
all
the
people
for
services
right,
and
we
will
make
a
change
we
added
in
here.
B
What
I,
much
rather
you
guys
did
was
that
you
added
a
new
attribute
in
there.
That
is
get
lab,
dashboard,
URL
or
something
like
that,
and
we
added
it
for
each
of
the
projects
and
then
what
slackline
does
is
it?
Actually?
It
will
consume
the
service
catalog
Yama
file
right,
so
it
it.
It
takes
information
out
of
there
and
so,
instead
of
directly
hard
coding.
The
gitlab
dashboard
in
the
slackline
is
quite
generic.