►
From YouTube: Overview of pajamas velocity spreadsheet
Description
No description was provided for this meeting.
If this is YOUR meeting, an easy way to fix this is to add a description to your video, wherever mtngs.io found it (probably YouTube).
A
Okay,
I'm
going
to
talk
through
a
spreadsheet
that
I
created
to
talk
about
the
pajamas
efforts
and
how
much
time
is
left.
This
is
rough
and
I'm
going
to
go
through
kind
of
the
whole
sheet
as
an
overview
and
then
talk
about
some
of
the
math
I'm
doing
and
how
we
can
perfect
this.
It's
definitely
not
correct.
I
don't
feel,
but
this
gets
us
into
a
place
where
we
can
stop
start
talking
about
some
of
the
knobs
and
dials
that
make
up
these
predictions.
A
So,
along
the
left,
we
have
each
component.
We
have
the
component
research
status
as
the
first
thing.
This
is
important
because
the
ones
that
are
done
means
they
can
go
through
component
migration
with
the
whole
org.
The
ones
that
still
don't
have
their
research
started
are
ones
where
we
still
have
to
invest,
sometimes
a
full
release
to
figure
out
all
of
the
migration
guides,
as
well
as
how
many
times
it
actually
appears
in
the
code
base.
A
So
we
have
links
to
each
epic
for
those
if
you
want
reference,
so
these
total
the
next
section
is
in
dark
gray.
This
is
the
whole
backlog
analysis,
so
open
versus
closed
issues
in
get
lab.
The
closed
issues
here
and
this
open
issues
column
I've
added
three
additional
columns
based
on
some
additions
from
the
team.
So
these
are
issues
we
know
will
be
created
and
once
we're
guessing
will
be
created-
and
these
are
I
put
swag
on
them-
they're,
just
wild
guesses,
currently
they're,
like
educated
wild
guesses.
A
A
A
A
So
moving
on
to
that,
given
that
we
know
how
many
open
issues
they
are,
there
are
and
the
complexity
factor,
I've
modeled
three
different
ways
to
determine
the
total
time.
To
close
all
of
the
issues
that
we
have
here,
the
first
one
I
used
our
value
stream
metric
as
and
you
can
see
down
below,
is
where
I'm
kind
of
doing
the
math
on
some
of
these.
So
the
median
time
to
close
all
of
our
issues.
A
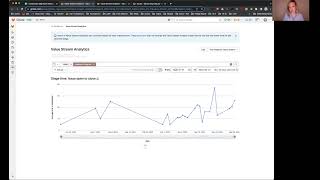
If
I
open
that
in
value
stream,
I
was
looking
on
the
pajamas
integrate
label
from
january
the
1st
to
march
31st
and
the
issue
time
open
like
from
the
time
the
issue
was
created
and
the
time
the
issue
was
closed
was
two
weeks.
I
wasn't
able
to
do
time
issue
assigned
to
issue
closed,
which
I
think
would
have
been
more
accurate
here.
A
What
this
is
also
doing
is
I've
turned
it
on
to
filter
by
start
date,
so
these
are
only
the
issues
that
were
generated
by
our
team
during
that
time
and
closed
during
that
time.
So
these
are
the
more
recent
issues
when
I
was
running
it
before
we
had
issues
that
were
closed
after
a
thousand
days
open.
So
I
just
did
the
analysis
on
around
150
issues
within
that
were
opened
up
and
closed
in
q1.
So
I
took
that
median
time
to
close
of
two
weeks.
A
I
translated
it
into
the
for
my
velocity
column,
I'm
using
the
amount
closed
per
week
and
for
this
one.
This
is
with
one
engineer,
so
I'm
able
to
then
multiply
by
the
complexity
factor
in
that
value
stream
number
and
get
the
total
number
so
five
issues
times
the
0.5
velocity,
which
is
one
engineer
per
week,
closing
half
an
issue
times
n11,
which
is
the
one
factor
of
complexity,
so
move
that
down.
A
It
gets
us
to
48.78
total
and
then
weeks
till
done
is
taking
the
total
engineers,
the
total
weeks
that
were
done,
dividing
it
by
the
engineers
that
we
were
using.
The
way
I
got
to
50
engineers
was,
there
was
a
goal
of
300
issues
in
q1
and
a
per
engineer
goal
of
six.
So
if
we
took
that
300
divided
by
the
six
we
get
down
to
that
point
five
and
all
of
these
numbers,
I
might
have
done
something
wrong.
So
please
pop
in.
A
297
issues
were
closed
and
that
took
me
to
a
comp,
a
velocity
of
24.8
per
week
for
the
whole
org
and
so
doing
the
math
from
there
same
thing,
total
issues
open
times
that
velocity-
and
I
divided
it
by
the
total
engineers,
because
that
that
value
was
across
the
whole
org
and
then
I
divided
it
by
the
complexity
factor
so
and
filled
that
down.
That,
surprisingly,
got
right
in
the
same
level
around
98,
and
then
I
did
it
with
the
q2
planned
velocity,
which
was
if
we
do
the
200
issues
in
q2.
A
So
with
that
final
q2
velocity,
it
would
be
like
2.81
years.
So
that
feels
really
huge,
and
so
I
think
that
if
we
go-
and
we
look
at
this
in
a
bit
more
depth
and
talk
through
some
of
these
knobs
and
dials,
like
I
mentioned
complexity
factor
the
total
time.
To
close-
I
I
was
thinking
also
of
maybe
mapping
doing
like
a
query
per
component,
and
then
we
look
at
okay.