►
From YouTube: Peach API Web Interface Walkthrough
Description
A walkthrough of the web interface of Peach API.
A
A
little
background
that
you
wanted
to
show
you
guys
a
couple
of
rough
edges.
It
was
slated
to
be
rolled
out
and
then,
of
course,
we
stopped
kind
of
working
on
it
for
the
first
initial
versions
of
our
tool.
We
kind
of
relied
on
our
integrations
into
other
people's
ticketing
systems
to
push
all
the
data
you're
gonna
seen
for
their
for
their
use
and
in
their
workflow.
All
right.
Let's
see
if
this
will
share
out.
Okay.
A
All
right,
okay,
so
for
our
UI
we'd
kind
of
land
in
a
dashboard,
similar
concept,
I
think
to
what
we're
working
on
with
git
lab
and
for
us.
We
have
this
idea
of
we're
kind
of
collecting.
This
idea
of
severity
exploit
ability
and
the
vulnerability
type.
So
from
this
screen,
we're
gonna
give
an
overview
of
the
severity
of
the
vulnerabilities,
we're
finding
we're
gonna,
give
an
indication
of
kind
of
the
top
vulnerabilities
that
are
affecting
their
project
and
then
weird
and
then
for
us.
We
tend
to
view
our
vulnerabilities
by
endpoint
and
operation.
A
One
of
things
that's
a
little
different
about
how
our
tool
works
from
Zaap
is.
We
can
actually
test
multiple
endpoints
in
one
scan
run
since
we're
dealing
with
the
api's.
We
want
to
make
sure
we
could
support
the
idea
of
micro
services
or
more
complicated
environments
that
might
include
an
authentication
and
host
versus
the
actual
target
implementation
host
for
this
can
I
have
a
single
endpoint,
though
an
API
that's
being
displayed
for
each
of
the
endpoints
and
operations.
We're
gonna
give
a
breakdown
of
the
different
numbers
of
findings
and
their
severity
and
their
severity.
A
From
there
we
can
drop
into
a
finding
section.
That's
gonna
start
giving
a
list
of
the
currently
active
findings
that
they're
dealing
with
along
with
some
trend,
history,
information.
We
do
have
the
idea
of
being
able
to
diff
two
scans
together
and
identify
issues
that
are
new
and
only
display
issues
that
are
currently
being
found
in
the
branch
that
we're
viewing.
We
don't
have
any
logic
in
here
that
deals
with
the
concept
of
merging
between
branches.
A
We
would
assume
that
as
a
merge
operation
occurs,
you're
gonna
do
a
CI
run
of
our
scanner
and
the
findings
will
be
updated
for
them
for
the
branch
that
you've
merged
into.
So
if
you
need
a
holistic
view,
the
primary
branch
is
kind
of
where
you
would
go
to
find
that,
otherwise,
you
can
look
at
your
targeted
feature
branch
to
see
what
work
is
currently
going
on
in
terms
of
how
we're
displaying
this
data.
A
Obviously
we
have
an
impact
happening
over
here,
we're
kind
of
tagging
things
with
exploitability
and
then
this
kind
of
a-five
a-six
stuff.
This
trim
this
kind
of
maps
over
to
the
OWASP
top
10,
and
so
this
is
giving
a
view
pretty
quickly
to
the
end
user,
if
they're
only
interested
in
and
you
have
visibility
into
a
wasp
pop
can
kind
of
how
things
are
mapping
for
their
skin
and
then
from
here.
I
can
go
ahead
and
pick
an
individual
issue
and
we
can
drill
into
it.
A
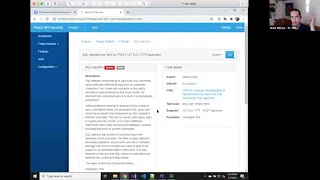
So,
for
example,
maybe
I
can
look
at
a
sequel
injection
what's
going
on
and
we'll
give
them
kind
of
a
nice
little
breakdown
of
the
issue
for
our
tool.
One
of
the
things
that
we
also
have
a
distinction
between
is
the
module.
That's
performing
the
check
or
the
investigation
that
resulted
in
the
vulnerability.
For
example,
we
have
like
a
sequel
injection
module,
that's
going
to
go
in
and
prepare
different
tests
to
do
against
the
endpoint.
A
That
will
result
in
one
of
these
issues
being
found
and
that
gets
paired
with
different
ways
of
detecting
that
the
issue
has
occurred
and
we
kind
of
the
lingo
we
use
is
we
have.
The
check
is
the
logic
that
creates
the
test
case
for
for
like
a
sequel
injection
and
then
an
assert
is
the
module
that
that
found
the
issue
that
we
basically
said:
hey
something
bad
has
happened.
A
The
user
has
the
ability
to
go
into
our
system
and
modify
and
customize
how
the
asserts
work.
So,
for
example,
if
I
felt
that
500
was
not
indicative
of
this
type
of
issue,
I
can
go
in
and
disable
that
in
the
configuration
for
this
issue,
another
assert
that
might
trigger
would
be
a
log
analysis
assertion.
A
So
another
way
to
find
sequel
injection
is:
we
can
monitor
a
log
and
detect
that,
in
which
case,
this
detection
language
would
change
along
with
the
assert
that's
listed
there
in
the
description
we
also
inline
the
thing
that
was
changed
and
will
list
our
idea,
what
a
preamp
with
the
parameter
it's
being
modified,
its
original
value
and
it's
a
new
value.
This
is
something
that
can
be
pulled
out
of
the
description.
This
is
just
where
we
chose
to
display
that
information,
but
it
is
available.
A
The
other
thing
that's
a
little
different.
That's
a
different
piece
of
information.
We're
displaying
from
I
think
the
other
scanners
is.
We
have
a
concept
of
being
able
to
integrate
into
a
unit
test
framework,
in
fact,
for
this
scan
test,
I've
integrated
into
a
Python
testing
framework,
and
so
one
of
the
things
that
I'm
reporting
here
is
going
to
be
the
test
case
in
the
unit
test
framework
that
we
used
as
the
base
data
for
doing
this
test,
and
so
it's
an
extra
piece
of
information
that
can
allow
the
user
to
understand.
A
B
A
B
A
B
A
B
It's
something
to
think
about
for
later
are
just
the
feedback
we've
gotten
from
some
user
testing
is
unknowns.
People
tend
to
treat
as
critical
because
they
don't
know
it
could
be
a
critical.
It
could
be
noise
because
of
the
propensity
of
fuzzing
to
generate
lots
and
lots
of
unknown
findings.
We
may
just
need
to
think
how
we
potentially
segregate
those
out
on
the
UI
from
other
don't
test
things
through
calculator.
There's.
A
Probably
a
another
AUSA
discussion
on
you
know:
I
do
I
do
feel
that
it
we
can
probably
provide
some
guidance
on
on
how
bad
something
we
find
through.
Fuzzing
is,
in
some
cases,
I
I
do
feel
like
from
past
experiences
of
the
users
and
fuzzing.
At
some
point,
you
have
to
revise
some
guidance
on
which
ones
we
should
focus
on
and
which
ones
we
should
not
for
this
system.
One
of
the
ways
that
can
be
possibly
accomplished
is
by
may
be
using
the
assertion.
A
The
way
we
finding
the
issue
has
occurred
could
be
a
guidance
on
that,
for
example,
if
we
see
interesting
things
in
a
log
analysis
that
could
provide
us
some
hints
on
how
to
assign
interest
to
it
versus
that,
is
it
just
a
500
err
like
did
your
application
code
actually
exception?
Did
you?
We
see
a
database
or
storage
error
message
and
maybe
find
some
guidance
yeah.
The
triaging
of
fuzzing
vulnerabilities
is
always
a
challenge
to
get
right.
A
A
What's
going
on,
you
know
if
it
was
me
going
through
a
triage
process.
The
first
thing
I'm
gonna
want
to
do
is
I.
Look
at
one
of
these
is
I
just
want
to
see
the
posts
that
are
going
on
the
issue.
P,
must
you
request
some
responses,
and
you
know
an
eyeball
that
can
probably
give
me
a
good
good
sense
of
whether
or
not
I
think
this
is
a
false,
positive,
a
real
issue
and
maybe
also
where
it
should
get
sent
to
you
in
terms
of
the
developer
that
would
work
on
it.
A
C
A
You
know
one
thing:
that's
that
would
be
nice
is
to
point
out
exactly
what's
changing
in
bold,
but
one
of
the
things
that
can
happen
is
the
user
can
look
at
what's
happening,
so
we
see
that
we're
changing
the
parameter
first
yeah
and
up
above
we
caught,
we
point
out
that
that's
form
data,
and
so
we
know
to
go.
Look
for
the
first
name,
which
is
percent
27
single
tick
was
over
changing
versus
the
original
one.
C
A
So
this
is
the
in
the
case
of
unit
tests.
What
we
do
is
we
leverage
the
logic
in
the
unit
test
to
make
sure
that
we
can
perform
the
sequence
of
operations
every
time,
for
example,
if
I
had
to
go
get
off,
so
this
is
the
from
the
time
we
rather
unit
test,
and
we
man
in
the
middle
do
it
to
change
it.
This
is
the
original
request
that
we
then
modified
the
first
name
of
so
this
is
the
the
exact
request
that
we're
basing
this
off
of.
D
A
A
The
other
thing
that
I
am
not
sure.
Let's
see
if
I,
have
an
example
of
this
we
have.
We
do
have
the
concept
of
a
check
being
able
to
find
multiple
vulnerabilities
in
one
go,
which
I
believe
is
not
displaying
correctly,
but
we
do
have
I
think
the
only
one
that's
really
using
that
right
now
is.
We
have
one
that
will
check
four
CVEs
in
the
case
of
checks,
four
CVEs
we
can
have
kind
of
in
one
loner
ability,
sub
vulnerabilities
off
of
it.
That
would
indicate
here's
like
all
the
different
TVs
we
found.
I.
A
A
C
So,
probably
not
a
not
a
question,
maybe
one
thing
that'll
be
interesting
for
us
to
dig
into
more,
though
you
you
were
talking
about
your
workflow,
about
how
you
triage
these
quickly
and
that
you
look
at
the
recorded
request
response
pairs
on
one
of
your
first
things.
Maybe
that'll
be
something
that
as
we
build
this
out,
we
can
emphasize
more
as
part
of
our
interfaces.
A
Yeah
I
think
you
know
once
we're
past,
maybe
the
first
person
to
look
at
it.
You
might
not
be
as
super
technical
once
this
gets
something
where
you're
involving
any
of
the
engineering
team
members
I
really
do
feel
strongly.
That
I
would
want
to
see
the
request
bodies.
That's
like
the
first
thing:
I'm
gonna
do
to
get
intelligence
of.
What's
going
on,
I
think
from
there.
The
next
thing
I'd
want
to
see
is
the
code
path
and
I
think
a
great
future
feature
for
me.
A
You
know
for
mature
customers
would
be
being
able
to
have
their
back.
You
know
the
back
the
target
being
instrumented
in
a
way
that
would
pull
some
of
that
additional
information
out,
but
I
think
from
a
user
experience.
Anything
we
can
do
to
create
a
really
fast
triage
process
would
be
hugely
beneficial
agreed.
C
D
And
I
think
the
core
issue
around
that,
along
with
the
artifacts
sorry,
the
downloading,
a
postman
collection
is
how
to
get
that
amount
of
data
over
to
the
dashboard,
because
right
now
the
only
place
is
to
throw
it
into
that
JSON
document.
So
this
does
introduce
I.
Think
the
the
need
to
have
links
to
additional
assets.
Yep.
A
Yeah,
absolutely
certainly
when
we
start
doing
with
the
fuzzing,
you
know
the
size
of
the
injections
could
be.
You
know
larger
than
is
reasonable
to
eat
this
store
inside
of
a
report,
format
or
anything
like
that,
and
that
definitely
brings
up
questions
on
you
know:
gayness
eyes,
caps
and
limits
and
verses
and
how
long
we
keep
those
assets.
A
One
of
the
things
that
would
happen
in
in
in
my
integrations
with
with
issues
is-
and
this
might
parallel
over
to
the
workflow
in
and
get
lab.
If
we
have,
if
the
users
flow
is
they're,
gonna,
take
a
vulnerability
and
turn
it
into
an
issue
when
they
turn
it
into
an
issue
and
those
files
can
get
attached
to
it.
That
might
be
the
point
where
we
say
we're:
gonna
retain
those
assets
for
a
little
bit
longer,
and
maybe
there
is
still
some
idea
of
you
know
for
a
scam
that
you're
doing
we're.
C
B
Actually,
very
similar
to
how
we've
got
the
flow
set
up
today
is
in
the
M.
Are
the
results
are
basically
ephemeral
for
that
scan
for
that
particular
feature
branch.
Unless
you
take
an
action
on
it,
I
change
the
status
I
convert
it
to
an
issue,
I
open,
an
M
R
against
it,
so
I
think
that'd
be
a
good
paradigm
for
something
like
that.
We
have
the
vulnerability
object
and
to
me
that
would
make
sense
to
start
attaching
asset
there
and
then
the
issues
in
the
mrs
will
the
link
to
that.
That's
a
good
point.
A
Great,
so
the
other
side
of
the
configuration
of
the
UI
for
this
is
largely
around
configuration
of
the
options.
So
all
the
checks
are,
the
majority
of
the
checks
in
our
system
have
some
level
of
configuration,
along
with
with
the
asserts
and
then
also,
of
course,
generalize
things
like
the
TLS
CA
cert
you're
going
to
put
in
so
we
can,
you
know,
forged
SSL
certificates
and
things
of
that
nature.
A
We
are
right
now
able
to
store
that
configuration
in
a
gamma
file
similar
to
what
the
other
scanners
are
doing.
The
downside
is,
you
know
our
our
conversion
DM,
we
do
not
sit
down
and
you
know
and
intentionally
make
it
user
accessible.
It's
really
just
a
serialization
of
our
configurations
of
our
configuration
options
internally,
it's
not
terrible,
but
it
can
get
a
little
complex
if
you
have
a
lot
of
profiles.
A
So
one
thing
that
we
support
is
this
concept
of
creating
a
profile
on
top
of
a
configuration
that
you
might
use
different
situations.
So,
for
example,
you
might
have
a
weekly
scan
that
you
expect
to
take
much
much
longer.
Maybe
you
turn
on
a
lot
of
fuzzing
for
that
and
it
runs
for
several
days,
and
you
don't
run
that
very
often
it's
really.
You
wouldn't
run
that
on
a
feature
branch,
but
it
is
linked
to
your
project
versus
you
might
have
a
concept
of.
A
Maybe
you
have
a
very
quick
cycle
scan
that
goes
on
feature
branches
that
must
pass
before
you
can
promote
that
up
the
chain
and
then
maybe
there's
on
the
more
of
a
master
branch,
there's
a
more
full
scan
that
occurs
nightly
on
that.
As
you
verify,
you
know,
merge
merges
into
that
main
branch
from
the
yamo
perspective.
A
You
know
their
own
proprietary
error
codes.
They
can
put
it
in
here
and
say:
hey.
If
you
see
this,
then
that's
that's
our
database
there.
You
should
definitely
assert
you
cert
on
that
they
can
go
in
and
configure
the
log
analyzer
and
the
strings.
That's
looking
for
and
the
categories
that
are
being
used.
They
can
also
come
in
and
maybe
modify
the
types
of
injections
that
we're
doing
kind
of
a
high
layer
and
say
things
like
well
I.
Don't
want
to
do
that
or
maybe
my
database
has
a
couple
strings.
You
don't
know
about
that.
A
A
The
reason
for
that
would
be
if
I
have
one
endpoint
in
Python,
flask
and
I
have
another
one,
that's
written
in
in
Java
the
assertion
configurations
for
what
a
false-positive
might
be
or
what
checks
I
want
to
perform
on.
Those
two
sites
could
be
very
different,
so
an
added
complexity
to
kind
of
how
this
all
works
is
at
this
profile.
A
Layer,
you're
gonna,
see
that
I've
tagged
this
with
there's
a
route
specifier
here
and
one
of
the
things
that
the
user
has
the
option
of
doing
is
also
defining
different
routes
of
endpoints
that
we're
gonna
be
testing
by
default.
We
kind
of
have
a
catch-all,
and
it
just
says
that
whatever
you,
whatever
you
access,
while
we're
in
the
middle
of
your
communication,
it's
gonna
get
tested,
but
it
would
be
common
for
an
end
user
to
have
two
routes,
one
maybe
for
an
authentication
box.
A
So
they
do
not
want
to
test
and
then
one
for
things
I
do
want
to
test
or
if
they
have
different
back-end
systems,
and
they
want
to
customize
that
they
could
have
more
than
one
route
here.
As
you
add
routes,
the
screens
of
the
profile
can
get
more
complicated,
and
if
you
were
dealing
with
this
in
the
amyl,
it
would
even
be
more
so
because
some
of
you
start
having
an
explosion
of
options
that
might
be
listed.
A
We
have
done
some
work
to
only
show
changes
to
our
default
configuration
in
the
amyl.
So
right
now,
if
you
export
yeah,
no
configuration
it's
not
going
to
show
every
check
every
assertion
and
every
option:
it's
gonna
show
the
ones
the
user
has
enabled,
and
so
it
does
look
a
little
bit
more
reasonable.
In
that
sense,.
A
A
We
have
some
general
timeouts
that
they
can
tweak.
This
can
really
affect
the
performance,
sometimes
of
the
testing
that
we're
doing
by
how
long
do
we
end
up
waiting
for
responses
from
stuff-
and
you
know
just
a
bunch
of
other
stuff,
this
ignored
failure
screen
will
go
away
in
our
system.
We
have
the
ability
to
mark
something.
Is
we're
not
gonna?
You
know
it's
not
I'm
finding.
We
don't
want
to
deal
with
it.
A
This
would
simply
show
our
list
of
all
the
ones
they've
disabled
or
chosen
not
to
address
the
reason
we
have
this
is
you
know
a
common
thing
that
we
would
get
asked
by
a
red
team
or
a
team
that
it
would
oversee
the
engineering
group
running
this
tool?
Is
they
want
to
know
if
the
engineering
team
has
made
any
weird
choices
that
they
are
then,
like
me
would
be
in
disagreement
with,
so
we
have
a
central
screen
where
they
can
go
and
say:
here's
all
the
stuff.
D
A
D
A
The
only
way
to
stop
finding
an
issue
is
a
trim,
the
check
off.
So
our
second
way
of
doing
that
is,
you
can
disable
a
finding
is
kind
of
we
had
to
have
this
on
and
off
button
in
our
finding
UI
right
here,
and
if
you
click
that
we
still
find
the
issue,
we
just
don't
report
it
into
the
UI
or
to
integrations,
and
since
that
could
be
a
sneaky
way
to
hide,
doing
work
or
you
know
making
the
wrong
choice.
We
want
to
make
sure
that
we
call
that
to
the
attention
of
someone.
D
A
D
A
And
you
know
whether
ways
I
talk
about
that
is,
you
know
like
we're,
seeing
a
bunch
of
clear
tech,
clear
text,
authentication
issues
here.
It's
quite
likely
at
some
point
that
you
know
one
section
of
your
API,
maybe
need
to
be
unnethe
indicated
for
a
mobile
app
or
for
whatever
reason-
and
you
know,
but
you
don't
want
to
stop
looking
for
clear
text,
authentication
so
an
easy
way
to
handle.
That
is.
We
can
just
say
for
this
instance
of
this
vulnerability,
stop
reporting
it
and
then
from
this
UI
we
would
list
any
ignored
faults.
D
A
Exactly
so,
it's
going
to
be
the
combination
of
the
check.
I,
don't
remember
if
it
includes
assert
and
then
it's
going
to
be
the
endpoint
and
operation.
So
it
kind
of
be
like
delete
on
this
Plus
this
and
then
that's
kind
of
scoping
of
it.
Okay,
we're
trying
to
make
the
on
off
thing
just
really
really
targeted
to
an
instance
of
a
vulnerability.
A
A
C
A
Usually,
what
I
do
is
it
would
be
on
board
a
customer
I
spend
you
know
we
would
spend
some
time
doing
what
I
call
integration
configuration,
which
is
my
goal
for
this
tool,
was
to
make
it
so
the
configuration
only
changes
when
you
make
major
changes
to
your
code
base
and
not
on
kind
of
a
day
to
day.
So
my
pictures,
the
customers
is
when
you
turn
the
tool
on
we're.
A
Gonna
spend
some
time,
configuring,
the
assertions
and
the
checks
to
get
the
timing
of
the
scans
here
to
what
meets
your
SLA
and
to
get
the
results.
You
know
coming
back
the
right
way
and
then
once
that's
done,
hopefully
it's
just
set
it
and
forget
it.
So,
for
me,
I
think
the
biggest
thing
you
would
end
up
doing
is
you'd
come
in
and
modify
some
of
these
assertions.
A
A
But
most
of
the
configuration
is
going
to
be
kind
of
one
getting
any
integration
work
and
then
to
going
through
and
making
tweaks
to
the
checks
and
assertions
that
you're
gonna
do
so
I
think
for
the
first
round
of
documentation,
I
am
gonna,
try
and
include
a
section
that
says
hey
if
you
get
a
whole
bunch
of
false
positives,
here's
three
things
you
can
just
do
in
the
ammo
to
start
you
know
getting
a
better
better
handle
on
those.
While
we
work
to
either
having
UI
around
the
configuration
file
or
better
documentation
around
that.
C
Okay,
thanks
yeah,
because,
especially
as
you
were
going
through,
the
the
profile
section
I
was
trying
to
mentally
map
like
what
did
these
profiles
look
like
versus?
What
will
have
it
get
lab
right,
because
if
you're
in
your
CI
pipeline,
you'll,
probably
just
have
one
unless
you
use
an
environment
variable
to
flip
it
or
our
on-demand
scans,
possibly
so
yeah.
This
is
good
context
to
hear
that
it's
mostly
the
configuration
of
the
checks
more
so
than
profiles
being
a
major
thing.
People
spend
a
lot
of
time
with
yeah.
A
You
know
most
people,
usually
so
I,
guess
what
my
experience
with
the
profiles
is
the
red
team's
got.
You
know
the
red
team
was
usually
hit,
the
full
button
and
they're
usually
doing
a
one-off
scan
and
then
other
than
that
I
usually
start
people
like
quick
and
nightly,
and
just
kind
of
you
know
slowly
ramp
them
up
I
like
starting
people
at
the
fastest
scan.
So
they
can
see
a
couple,
but
couple
vulnerabilities
get
invested
in
it
and
then
they
don't.
You
know,
because
we
go
up.
A
B
Are
you
able
to
I
think
you
kind
of
alluded
to
this?
You
can
segment
it
out
by
the
specific
end
points
or
the
routes,
but
I
guess
what
I
would
see
doing
with
this
is
like
only
run
some
of
the
more
intense
fuzzing
on
parts
of
the
code
that
had
changed
like
if
I
detected
that
what
underlied
a
particular
end
point
had
been
modified,
or
there
was
a
new
one
added.
Is
that
something
that
it
could
do
today?
Is
that
I
guess
Sam,
maybe
more
question
for
your
roadmap
around
this
yeah.
A
That
idea,
one
of
the
things
that
we
also
need
to
understand
is
a
little
bit
more,
how
the
vulnerabilities
and
things
that
we're
finding
map
to
the
code
changes,
and
so
we
do
have
some
ideas
in
flight
that
we're
brainstorming
on
how
we
could
identify
get
some
code
intelligence
to
say
things
like
hey
this
operations
in
this
section
of
the
code
or
even
from
our
scans
instrumenting
the
back
end
target
and
being
able
to
see
the
areas
of
the
code
we're
hitting
as
we
do
so.
The
checks.
C
You
know
I
think
eventually,
once
we're
able
to
use
both
peep
technology
as
well
as
some
of
the
coverage
guide
in
fuzzing
technology.
Bringing
those
together
should
probably
help
us
dramatically
there
as
well,
since
we'd
have
an
instrument
to
build.
In
that
case,
you
know
we
could
probably
use
the
the
peach
technology
to
try
all
the
different
things
in
the
API
spec
and
see
what
happens
in
the
actual
implementation
itself.
A
D
A
Jobs
sure
you're
right,
I,
totally
glossed
over
jobs.
Jobs
for
us
is
is
a
scam
and
so,
for
this
case,
I've
seated
two
scans
today
in
here.
For
this
view,
aside
from
the
normal
information,
you
would
get
about
completion
and
whatnot.
This
is
also
where,
if
a
scan
failed,
you'd
get
an
area
you'd
be
able
to
see
an
error
message
from
our
tool
that
says
here's
what
happened
like
we
couldn't
look
up
the
DNS
name
of
your
target
end
point
or
something.
What
happened
like
your
target
disappeared?
We
can't
contact
it
anymore.
A
D
A
C
A
Know
I,
don't
think
they're
the
necessary
is
so
I,
don't
know
if
I
have
psycho
install,
but
I
do
have.
So.
Basically,
we
have
our
kind
of
a
anyone's
used
insomnia.
It's
basically
a
clone
of
postman,
that's
open
source
and
we
forked
that
project
and
added
and
kind
of
made
a
version
for
our
customers
that
had
our
scanning
the
ability
to
start
scans
built
into
it.
And
that
was
really
great
for
demos
to
customers
and
having
them
do
proof
of
concepts
where
they
didn't
have
to
do.
A
C
C
A
A
It
provides
that
input,
data
and
so
sidecar
was
kind
of
a
graphical
way
of
doing
that,
where
you
can
basically
just
say
take
whatever
is
in
my
you
know
in
my
you
know,
operation
here
and
make
it
and
start
testing
it,
and
then
we
could
and
then
we
could
like
pull,
backs
relational
stats
on
the
tests,
and
things
like
that.
So,
as
you
know,
I
think
it's
usefulness
was
more
from
getting
things
working
and
evaluating
the
tool
than
something
I
would
expect
users
to
actually
make
a
lot
of
use
out
of.
A
A
A
D
So
I
don't
know
if,
if
everyone's
seen
this
diagram,
so
you
get
the
peach
Runner
here
and
Mike.
Certainly
if
there's
things
that
are
inaccurate,
but
let
me
know
so
basically
yeah
burp
suite
fiddler
horror
swagger.
All
of
these
you
can
export
files
which
then
can
go
into
the
peach
runner,
and
we
also
have
a
tool
called
peat
recorder,
so
you
can
send
HTTP
requests
through
peat
recorder
and
then
peat
recorder
will
say
about
a
har
file
and
then
the
har
file
can
be
used
as
a
seed,
essentially
for
peach
runner.
D
D
A
We
also
support
things
like
oh
yeah.
You
have
selenium
on
their
integrations
with
selenium
and
other
technologies.
I
think
my
hope
with
this
tool
was
that
you
know
a
neat
way
of
doing
this
for
a
mature
customer
was,
you
know,
really
driving
everything
off
of
their
unit
tests,
since
the
unit
tests
are
the
most
likely
to
get
updated
as
new
features
are
added
and
not
required,
and
then
remove
a
lot
of
the
maintenance
burden
from
the
user.