►
From YouTube: GitLab 12.8 Kickoff - Monitor:APM
A
Hi
welcome
to
the
kickoff
call
for
12.8
for
the
monitor
EPM
group.
My
name
is
Kenny
Johnston
I'll,
be
your
host
today,
I'm
the
director
of
product
for
our
ops,
section
I'm,
covering
for
the
Hershkovitz,
who
is
the
product
manager
for
this
group,
but
is
a
way
participating
in
our
CEO
Shadow
program.
I'm
going
to
share
my
screen
and
go
through
our
planning
issue
and
highlight
some
important
issues
that
were
working
on
in
V
12.8
release.
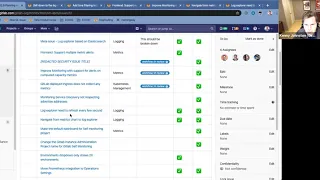
A
All
right,
so
these
are
in
priority
order.
The
first
items
are
in
our
login
category
and
really
about
finishing
up
some
work
around
our
effort
to
move
logging
to
viable.
So
we
had
hopes
to
have
that
chip
in
12.7.
There
were
a
couple
of
items
that
were
blocking
us
from
shipping
completely
and
so
we'll
be
finishing
up
in
12.8.
A
We
all
the
this
meta
issue
is
a
kind
of
culmination
of
all
the
items
in
building
our
log
Explorer,
so
that
one
will
close,
as
we
finish
off
these
last
two-
we're
also
adding
support
for
multi
metrics
alerts,
which
was
in
last
releases
scheduled
as
well
as
supporting
alerts
on
computed
capacity
metrics.
These
are
tied
together.
A
Normally,
you
would
want
to
see
alerts
on
a
capacity
metric
like
what
has
been
allocated
in
terms
of
memory
and
what
has
been
utilized.
You
want
to
make
sure
that
your
allocated
you're,
not
you,
know,
utilizing
90%
of
what's
been
allocated.
Multiple
metrics
alert
is
when
you
have
multiple
metrics
on
a
chart,
you
might
want
to
quickly
configure
alerts
on
each
one
of
those
individually.
This
gives
you
the
kind
of
front-end
support
to
do
that.
A
There
are
a
couple
of
around
not
collecting
appropriate
metrics,
a
couple
of
security
issues
that
you'll
see
interspersed
here,
whose
titles
have
been
redacted.
We
are
continuing
on
our
longest
for
kind
of
next
iterations
are
adding
the
ability
to
do
that.
Drill
down
ID
I
mentioned
navigating
from
metrics
charts
to
log
Explorer.
Let's
take
a
look
at
that
one
here,
as
well
as
the
ability
to
make
sure
that
your
log
Explorer
view
is
consistently
refreshed,
so
you
don't
have
to
continually
go
back
and
hit
the
refresh
button
on
your
log
Explorer
view.
A
There
are
a
couple
of
items
related
to
our
github
self
monitoring,
so
we
are
in
12.7
allowing
users
to
create
a
self
monitoring
project
that
connects
to
the
instance
level
Prometheus
cluster,
so
that
git
lab
administrators
can
make
sure
that
they're
supporting
their
users
in
a
efficient
manner,
using
some
of
the
same
tools,
including
metrics
and
alerts
that
we
give
for
your
application
monitoring.
So
these
include
creating
a
self
monitoring.
Initial
dashboard
of
kind
of
key
metrics
that
we've
found
from
our
git
lab
comm
support.
A
Experience
are
important
when
viewing
the
health
of
your
git
lab
instance,
as
well
as
adjusting
the
name
and
ensuring
that
it
shows
up
correctly
in
our
our
left
side
panel
here
in
operations
we're
moving
some
of
the
other
settings
that
have
been
buried
a
little
bit
like
the
Prometheus
integration
into
this
operations.
Setting
section
I,
don't
actually
have
my
settings
permissions
for
this
project,
but
if
you
did,
you
would
have
a
settings
and
operations
drop-down
also
we're.
A
Moving,
allows
the
search
integration
to
operation
settings
as
well,
and
then
a
couple
of
items
around
how
our
dropdowns,
how
we
interact
with
the
drop
downs
in
our
dashboards.
So
those
are
the
highlights
of
the
issues
for
12.8
that
the
monitor
health
team
will
be
working
on.
If
you
have
any
feedback
feel
free
to
comment
on
this
issue,
it
will
be
linked
in
the
video
description
and
I'm
sure
you
look
forward
to,
though
of
coming
back
for
12.9
thanks
everybody,
you,
you.