►
Description
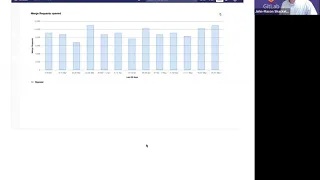
Embedding Analytics Charts: https://gitlab.com/gitlab-org/gitlab/-/issues/213924
A
Hello,
I'm,
John
Shackleford
product
manager
for
analytics
here
at
gitlab,
and
this
is
the
release
13
to
kick-off.
Video
I
want
to
share
with
you
today
in
analytics
feature
related
to
embedding
charts
and
then
get
lab
handbook
and
eventually
other
places
as
well
so
I'm
going
to
share
my
screen
and
talk
with
you
why
we
want
to
do
this.
A
What
our
meantime
to
merge
is
for
issues
and
so
on,
and
these
are
charts
that
are
embedded
in
our
handbook
page,
which
describe
key
performance
metrics
for
our
teams
today
comes
from
science.
Now
the
data
is
all
in
get
lab
and
it's,
but
it's
being
pulled
into
this
SCI
sense
system
and
then
rendered
as
an
embed
here
in
the
handbook
page.
Well,
we've
got
the
data
and
get
lab
but
originating
in
get
lab,
and
we
want
to
show
it
this
data
directly
from
get
lab.
A
Well,
one
of
the
missing
links
is
just
the
ability
to
embed
our
analytics.
Charts
were
right
into
another
web
page
or
dashboard,
or
something
like
that.
So
I'll
just
walk
you
through
part
of
the
way
we
realized
that
we
needed
to
do.
This
was
that
we
have
a
story
here
about
supporting
the
get
live,
engineering
and
quality
teams
by
better
meeting
their
needs
with
gitlab
and
likes
capabilities.
A
So
the
way
that
this
works-
let
me
take
you
to
a
little
picture
here,
is
that
if
I
am
on
a
chart
page-
and
we
would
have
a
little
icon-
looks
like
a
clipboard
icon
and
when
I
click
on
that
I'm
gonna
get
a
little
dialog
box.
That
allows
me
to
copy
and
paste
some
HTML
code
and
iframe,
essentially
with
some
JavaScript.
That
I
can
then
paste
in
to
another
page
and
have
that
chart
appear
there.