►
From YouTube: GitLab 13.2 Kickoff - Monitor:APM
Description
No description was provided for this meeting.
If this is YOUR meeting, an easy way to fix this is to add a description to your video, wherever mtngs.io found it (probably YouTube).
A
A
We
are
planning
to
clone
several
cough
on
a
dashboard
which
were
and
identified
by
the
info
team,
and
ideally,
we
would
like
them
to
start
dog
for
the
mints
and
we
can
get
more
feedback
in
identify
the
kick
and
gaps.
And
lastly,
we
have
several
customer
enhancement
around
a
matrix
end
of
it.
So
let's
get
going
item
number
one
support
alerting
for
custom
dashboard.
This
is
a
rather
old
issue
more
than
a
year
ago,
but
still
very,
very
event,
and
basically,
what
would
like
is
to
support
a
little
on
custom
dashboard.
A
A
A
A
Issue
number
four
public
method,
balto
404,
and
when
a
user
is
logged
on
login
in
the
previous
iteration
we've
we've
built
the
ability
to
configure
the
dashboard
that
will
be
publicly
accessible.
This
is
also
part
of
our
doc
folding
metric
effort.
However,
it
seems
that
the
public
is
both
still
toe
for
when
the
user
is
not
something.
So
next
one
is
to
display
a
metric
label
value
in
single
state
panel.
This
is
also
dock
floating
activity
and
in
one
of
the
dashboards
that
will
try
to
clone
by
one
of
our
list
managers.
A
Next,
one
is
on
the
metric
dashboard.
We
want
to
allow
user
to
customize
the
metric
child
for
the
landing
page.
Normally,
when
you
loved
it
metric
page,
you
will
hit
default
dashboard.
We
know
that
some
users
like
to
create
their
own
dashboard,
sometimes
visual
dashboard,
is
not
relevant.
So,
ideally
would
like
a
user
to
be
able
to
customize
the
landing
page.
A
A
A
Number
eight
is
a
sparkle
on
child
type
beetle.
So
as
we
build
our
as
we
spend
the
ability
to
build
in
different
child's
would
like
our
user
to
have
some
sort
of
a
preview,
but
so
they'll
be
able
to
see
what
what
the
dashpot
would
look
like
today.
The
current
experience
is
that
user
create
a
dashboard,
you
setup
the
squirrel,
and
then
he
like
way
that
the
queries
is
collected
you'll,
be
able
to
see
they'll,
be
able
to
see
the
right
they
like
metric
in
the
dashboard.
A
They
would
like
to
create
some
sort
of
a
preview,
so
this
will
help
our
user
to
create
the
right,
but
sometimes
you
don't
know
how
to
Bob
would
look
like
if
you
try
different
queries,
and
today,
with
users
are
doing,
is
that
they
are
going
to
commit
to
that
from
parameters.
But
still
the
chart
is
same.
Vomitus
is
not
exactly
the
chart
you
see
on
our
metric
page,
because
we
have
different
visualization
and
different
types
of
chart
capabilities.
A
So,
ideally,
would
like
to
provide
some
sort
of
preview
button,
and
this
is
a
spike
issue
for
that
number.
Nine
is
also
a
spike
issue
to
the
couple
environment
from
metrics.
It
appears
that,
in
order
for
our
user
to
set
up
their
dashboard
the
metric
dashboard,
they
need
to
set
up
environments,
and
sometimes
this
is
not
the
case.
A
For
instance,
if
I'm
using
manual
vomitus
I,
don't
have
an
environment,
sometimes
environment,
the
metric
bot
inherit
different
parameters
form
the
environment
and
basically,
we
want
to
decouple
those
two,
and
next
one
is
actually
on
the
self
monitoring
dashboard.
So
in
github
we
have
the
self
monitoring
project.
A
It's
a
project
that
monitor
github
instance.
We
have
a
default
dashboard
for
that
which
is
a
specific
and
customize
dashboard
for
our
for
our
users
and
would
like
to
have
the
ability
for
the
users
to
edit
the
button
to
edit,
so
it
the
dashboard.
So
we
need
to
fix
that
right
now,
edit
button
is
throwing
an
elbow
because
it's
a
different
dashboard.
You
cannot
edit
it
for
dashboard.
So
what
we'll
need
to
do
is
to
change
it
to
be
like
to
remove
the
edit
pattern
and
change
it
to
be
a
duplicate
of
dashboard.
A
A
So
today,
I'll
log
explore
only
only
surface
loads
of
the
deployed
application.
However,
we
know
that
in
a
cluster
there
are
more
applications
and
component
that
the
not
only
a
part
of
the
application,
so,
for
instance,
users
can
deploy
Ingenix
you
can
deploy
there.
They
want
to
see
the
file
log
logs.
They
want
to
see
their
kubernetes
logs
that
the
cluster
loads
and
more
into
that.
A
So
this
implementation
issue
actually
expand
the
capability
of
us
showing
all
the
logs
that
are
coming
out
of
the
cluster
versus
only
the
application
logs
a
issue
now,
but
where
single
child
should
use
the
full
length
length
of
the
screen
is
the
one
here
you
can
see
when
I
have
a
single
chart
on
a
dashboard,
because
if
there
is
a
lot
of
a
wide
space
here-
and
ideally
we
want
to
make
it
look
something
like
that.
So
we
can
use
the
full
size
of
the
page.
A.
A
A
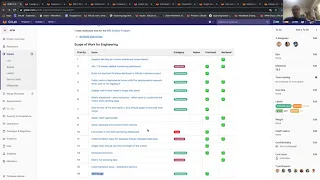
Issue
number
15:
this
is
the
implementation
issue
for
dashboard
action.
There
are
multiple
dashboard
actions
that
we've
mapped
in
this
design
issue
and
obviously
we
need
to
break
it
down,
but,
for
instance,
we
want
to
add
a
certain
button
so
to
be
easy
for
the
user
to
change
different
settings
such
as
UTC
time
and
and
more.
We
want
to
have
a
way
for
our
user
to
create
a
new
dashboard
from
the
UI,
and
we
want
two
distinct,
distinct
action
for
and
separate,
distinct
action
for
like
custom
and
default
dashboard.
A
We
know
that
there
are
actions
that
we
can
do
in
custom
dash,
both
in
not
in
the
bored.
So
we
want
to
have
like
a
clear
separation
and
basically
move
things
around.
So
you
can
look
more
in
the
in
the
design
issue.
It
will
probably
break
down
into
several
implementation
issue,
not
sure
we'll
be
able
to
do
all
of
them
in
a
single
iteration.