►
From YouTube: GitLab 15.7 KickOff - Monitor:Observability
A
This
is
the
15.7
planning
issue
for
observability
in
this
release.
We're
going
to
be
focusing
on
utilizing
the
plumbing
that
we've
built
over
the
last
couple
of
releases
and
releasing
a
couple
of
features
that
allows
the
user
to
really
start
seeing
the
advantages
of
combining
observability
data
together
with
a
devops
platform
and
use.
Some
of
these
features
end
to
end.
A
A
In
this
case,
you
see
an
example
of
this
is
the
where
the
observability
page
is,
but
the
the
menus,
the
navigation,
the
the
URLs,
the
buttons
are
all
within
the
gitlab
UI
and
moving
back
and
forth
between
Pages
happens
through
the
gitlab
high
level.
Ui.
There's
no
nesting,
there's
no
going
deep
within
sub
Pages
navigation
happens
only
at
the
high
level
and
the
user
doesn't
get
lost.
The
theme
is
adapted
to
make
it
look
as
if
it
is
completely
native.
A
A
So
the
way
it
looks
like
I've
highlighted
this
screenshot
here,
a
user
can
take
the
URL
off
a
certain
chart.
A
chart,
for
example,
is
this
one
right
like
this:
this
chart
here
would
have
a
URL.
A
URL
can
be
bounded
in
time
can
be
fixed
in
time
from
time
a
to
time
b
or
can
be
moving
in
time.
That
URL
can
be
copy
pasted.
A
In
this
case,
one
would
copy
paste
a
bounded
query
that
starts
and
stops
at
a
certain
time,
because
one
would
want
to
highlight
a
specific
issue
that
specific
issue
could
be,
for
example,
something
happening
in
this
graph.
So,
instead
of
doing
doing
a
screenshot
that
and
also
having
to
copy
a
link,
one
would
just
take
the
link
and
then
paste
it
directly
into
the
the
issue
editor,
which
would
then
recognized
based
on
the
URL.
In
this
case
this
is
a
demo,
so
it
says
your
localhost,
but
we
have
our
own
URLs.
A
It
would
detect
and
start
embedding
a
graph.
This
graph
is
a
real
graph.
One
can
click
through
on
the
graph
to
go
to
the
actual
page
that
you
see
here
then
so.
This
is
one
of
the
first
features
to
really
show
that
it's
useful
to
get
observability
data
accessible
from
a
feature
from
a
platform
like
gitlab,
because
it
allows
you
to
within
the
development
cycle
of
the
an
application,
be
able
to
embed
and
talk
about
issues
and
whatever
they
would
be
and
do
it
live
with
the
graphs
instead
of
having
to
send
screenshots
around.
A
So
now
we
get
into
some
of
the
features
of
15.7
15.7.
In
this
case,
the
focus
is
we
we
have
an
over.
We
have
a
higher
level,
epic
called
phase,
two
Avera
tracking
that
tracks
this,
and
one
can
take
a
look,
but
this
this
is
basically
how
to
get
certain
of
our
features
to
maturity,
in
this
case
error
tracking
this.
For
this
to
happen,
there's
a
lot
of
sub
issues,
but
the
ones
that
we're
going
to
be
focusing
in
this
release
are
these
two.
A
A
So
one
can
track
this
in
this
epic
over
here
the
what
is
a
data
source,
a
data
source
is
a
way
for
the
UI
to
import
data
from
somewhere
else,
Prometheus
data
tracing
data
like
gig
or
sensory
data
for
errors
and
elastic
data
from
or
open
search
data
for
logs
or
even
some
data
specific
to
certain
Cloud
providers.
These
are
the
data
sources
that
we
have
kept
in
our
fork
and
that
we
are
going
to
be
maintaining,
and
these
are
the
data
sources
that
we
want
to
allow.
A
Anyone
to
point
to
this
is
the
the
way
that
one
can
use
the
observability.
The
UI
is
goes
to
two
ways:
one:
it
works
with
our
existing
back-ends.
We
have
error
tracking
or
the
beginning
of
error
tracking,
and
we
have
we're
working
on
metrics
and
we,
which
is
a
Prometheus
based
back
API
type
backend
and
where
we
have
a
a
tracing
backend.
So
those
are
our
own
backends,
but
with
a
customer,
the
customer's
data
already
lives
in
existing
back-ends
existing
providers.
A
We
don't
want
to
close
our
doors
to
where
the
data
is
and
provided
usable,
provide
advantages
and
features
to
the
user
right
away.
So
we
will,
in
this
with
this
feature,
allow
the
user
to
be
able
to
add
any
app
any
area
sources
they
want
and
be
able
to
then
query
and
visualize
them
within
the
system
just
like
that.
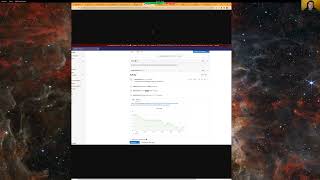
A
data
source
basically
gets
selected
up
here
and
then
one
one
chooses,
for
example,
if
one
wants
to
query
a
Prometheus
system
and
then
one
can
type
the
query
here
and
get
the
graphs.
A
A
Then
the
main
other
feature
that
we
want
to
get
done
is
managing
dashboards
in
Project
repositories
as
code.
This
is
another
one
other
incentive
for
a
user
to
be
able
to
combine
observability
data
together
with
the
DeVos
platform.
We
want
to
be
able
to
have
dashboards
saved
inside
of
each
project
repository
and
then
at
the
projects
level.
One
would
be
able
to
then
see
all
the
dashboards
in
this
in
this
manner
here
so
to
speak
or
in
this
manner
here.
A
We
can
improve
it
and
make
it
so
that
one
can
edit
the
dashboard
also
in
the
UI
here
and
commit
it
back,
but
for
the
next
release,
we'll
be
going
from
git
to
the
UI,
and
this
will
allow
us
to
have
dashboards
as
code
and
have
dashboards
live
right
next
to
the
code
that
they're
supposed
to
Monitor
and
represent
yeah
okay,
a
couple
of
other
high-level
tasks
that
I
want
to
highlight,
which
are
here.
These
are
not
features.
These
are
mainly
two
things.
One
is
the
metrics
design
that
continues.
A
We
have
in
15.6
built
a
design
for
our
metrics
backend.
We
will
now
be
creating
an
architectural
blueprint,
circulating
it
and
to
be
able
to
start
implementation
as
soon
as
we
can,
and
then
the
next
piece
is
operational
excellence.
In
our
case,
we
want
to
focus
on
setting
up
alerts
for
our
platform.
Our
team
manages
the
observability
platforms
themselves.
We
we
run
it
ourselves
because
we
want
to
be
able
for
the
customer
eventually
to
run
it
on
site
the
same
exact
way
as
we
do.
So.
A
That's
why
our
team
dog
foods
that
effort
we
are
currently
watching
it
with
a
couple
of
metrics
we're
going
to
be
setting
up
a
real
system
of
alerts
to
make
sure
that
we're
there
when
the
platform
goes
down.
This
is
one
of
the
piece
that
goes
towards
operational
excellence
and
is
documented
within
this
epic
over
here
in
this
issue
over
here
all
right.
That
is
it.
Thank
you
very
much
for
watching.