►
Description
This video goes over recent weekly changes in this incubation group, and also includes details ClickHouse vs TimescaleDB benchmarks.
Benchmarking details - https://gitlab.com/gitlab-org/incubation-engineering/apm/apm/-/issues/4
Weekly demo issue - https://gitlab.com/gitlab-org/incubation-engineering/apm/apm/-/issues/11
Handbook page - https://about.gitlab.com/handbook/engineering/incubation/monitor-apm/
A
Hello
there,
joe
shaw
here
full
stack
engineer
working
in
the
incubation
engineering
department
for
application,
performance
management,
monitoring,
observability
all
that
kind
of
stuff,
our
aim
being
to
build
an
observability
stack
into
gitlab
as
part
of
the
sas
solution
for
gitlab.
So
looking
at
agent
monitoring,
collecting
metrics
application
performance
metrics
and
how
we
store
them,
query
them
visualize
them
all
that
kind
of
stuff.
Here's
my
weekly
demo
update
and
the
weekly
issue
that
we
create
to
track
that.
So
you
see
that
here.
A
A
It's
horizontally,
scalable
this
issue,
I've
shown
before
in
these
videos.
This
has
a
bit
of
background.
A
few
links
to
some
interesting
blogs,
like
uber's
logging
platform
built
on
click
house.
We
wanted
to
compare
it
against
some
other
databases,
primarily
time
scale
db,
because
we
already
run
postgres
quite
large,
postgres
instances.
A
So
there's
already
a
lot
of
familiarity
there,
time
scales
built
on
top
of
that,
and
we
wanted
to
see
how
it
would
compare
and
whether
you
know
it
would
be
worth
supporting
a
new
database
to
do
this
or
whether
it
might
be
worth
sticking
with
postgres
with
scale,
because
time
scale
would
also
give
us
that
multi-model
capability,
where
we
could
store
other
sorts
of
data
in
there.
You
know
traces
and
things
like
that,
as
well
as
the
time
series
database,
specifically
my
cat's,
climbing
around
on
some
stuff
back
there.
A
They
didn't
work
out
of
the
box
initially,
so
I
haven't
put
put
any
more
time
into
getting
those
ones
running.
But
I
will
come
back
to
that
at
some
point
so
that
one's
still
left
unchecked
here.
So
I
added
some
more
documentation
here.
So
the
the
outline
of
the
benchmark
run
the
sort
of
variables
we're
using
so,
for
example,
use
case
cpu
only
or
devops,
so
it's
sort
of
devops
data
we'd
be
looking
at
the
number
of
workers
that
we
run
for
these
tests.
A
A
So
we've
got
a
hundred
hosts
as
an
example
here,
so
those
would
be
the
sort
of
machines
generating
the
metrics
and
that
that
results
in
just
over
what
is
that
number
2.5
is
that
20
250
million
individual
metrics
for
the
just
for
the
cpu
only
case
you
see
hundred
hosts
is
the
base
case
that
we're
looking
at
there.
It's
quite
a
significant
number
of
metrics.
A
We
scale
that
up
to
4
000
metrics,
which
I
believe
as
if
I
remember
correctly,
results
in
something
like
10
billion,
metrics
being
generated
and
stored.
So
you
know
significant
number,
but
not
impossible
to
get
to.
If
you've
got
a
lot
of
customers
running
lots
of
agents
in,
say
big
clusters,
you
could
you
could
easily
get
up
to
that
sort
of
level
fairly
quickly.
A
Does
it
does
a
load
run
where
it
loads
all
that
data
in
and
stores
metrics
as
we
go
along
and
then
runs
all
the
different
queries
we
generate
stops.
Clean
up
gets
some
aggregate
metrics
from
prometheus
that
we've
stored
and
then
goes
on
to
the
next
database,
with
some
delays
in
between
to
let
to
let
the
sort
of
things
settle
down
and
we
clean
up
volumes
and
things
like
that,
so
we're
starting
with
completely
fresh
databases.
A
In
the
background
I
added
I've
added
some
collapse,
sections
in
here,
for
example,
the
sort
of
example
schemas
that
we
end
up
for
the
devops
stuff.
So
I've
kind
of
outlined
those
here,
so
people
can
have
a
look
at
those
and
see
what
we
end
up.
The
one
that
we
end
up
targeting
most
is
the
cpu
one
here,
and
you
can
see
that
the
schema
there
and
there's
a
separate
tag
schema
that's
used
in
this
benchmark.
A
So
this
is
this:
is
a
click
house
specific
one,
the
time
scale
one's
very
similar,
although
in
the
background
it
time
scale,
is
storing
lots
of
sort
of
tables
that
are
generated
as
segments
which
are
then
turned
into
sort
of
these
hyper
tables?
That
end
up
being
things
that
you
actually
query,
so
you
can
see
some
examples.
A
There
there's
this
bit
of
example,
data
snippet
there,
so
you
got
some
fairly
typical
tags:
hosts
regions,
data
centers,
a
bunch
of
cpu
metrics
there,
some
disk
metrics
there
it's
in
this
sort
of
csv
format
that
we
use.
I
think,
actually,
I
think
it's
the
influx
db
wire
format
that
this
is
this
is
stored
in
because
the
time
series
benchmarking
tool
was
created
by
influx
db.
First
and
now
it's
taken
on
by
time
scale,
as
we've
mentioned
before
my
assumption.
A
So
so
you
know
I'm
assuming
that's
that's
going
to
be
as
about
as
good
as
it
gets
with
time
scale,
whereas
other
ones
like
the
click
house,
one
and
the
other,
the
other
databases
they've
been
contributed,
but
I've
had
to
make
sort
of
patches
to
make
them
work
properly.
Things
like
that,
so
we
can
assume
there's,
perhaps
some
tuning
that
could
be
done
there.
A
I've
documented
the
queries
as
well
that
we
run
as
part
of
the
benchmarks
and
put
some
descriptions
in
so,
for
example,
like
the
cpu
max
or
one
query,
get
the
maximum
of
all
the
cpu
metrics
for
a
particular
render
host
in
a
random
eight-hour
segment,
a
random
eight
hours
and
grew
up
by
one
hour
and
and
I've
put
the
queries
in
here.
So
you
can
actually
see
an
example.
Query
that's
running
there.
So
it's
getting
an
hour!
A
A
A
We
we
ended
up
having
to
increase
the
disk
space
there.
So
it's
a
google
cloud
vm
we
were
running
it
on
n2
standard,
16,
vm,
so
16
vcpus
gig
of
memory.
So
it's
kind
of
a
recommended
setup
for
a
lot
of
these
time:
series
databases,
lots
of
relatively
low
powered,
cpu
cores
and
a
large
amount
of
ram
to
deal
with
the
queries.
We
ended
up,
giving
it
500
gig
of
a
persistent
ssd,
so
we
want
to
try
and
get
the
best
performance
out
of
this.
A
They
could
all
run
on
an
attached
typical,
spinning
disk,
but
the
ssd
is
the
recommended
way
to
run
these.
Given
the
you
name:
output
there
for
the
linux.
This
is
an
ubuntu
image
there,
so
you've
got
ubuntu
sort
of
lts
version
there
kernel
version
and
where
we
run
this
using
a
scripted
bash
script
that
orchestrates
the
benchmark
and
it
uses
compose
in
the
benchmarking
tool
that
we've
added
to
start
various
services.
Everything
runs
there
makes
it
easy
to
get
logs
out
of
services,
and
things
like
that.
A
A
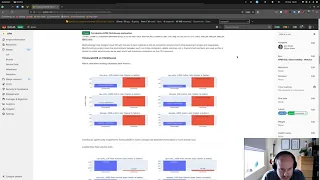
So
let's
have
a
look
so
metric
rate
when
we're
loading
higher
is
better.
You
can
see
that
click
house
performs
a
lot
better
there
in
all
of
these
cases,
so
which
case
being
say,
cpu
only
100.
That
means
a
cpu
only
case
with
100
scale
or
hosts.
If
you
like,
that's
the
sort
of
generated
data
set,
then
1000
and
4000,
that's
the
really
big
data
set
and
then
devops,
which
is
all
the
tables
not
just
the
cpu.
A
A
So
we
can
see
how
much
storage
these
databases
are
using
on
disk,
which
is
another
important
factor,
and
you
can
say,
click
house
really
outperforms
time
scale,
thereby
almost
a
factor
of
10
in
all
cases,
so
significantly
lower
amount-
and
you
can
see
here-
and
this
is
in
bytes-
see
this.
The
size
is
sort
of
nearly
300k
gig,
with
timescale
and
much
much
less
space
on
click
out.
So
it
turns
out.
A
It
was
time
scale
causing
a
benchmark
tests
to
fail
with
the
200
gig
disk,
and
that's
why
we
had
to
increase
it,
and
then
we
start
actually
looking
at
these
queries.
So
what
I've
grabbed
from
the
query
from
the
data
set
here
is
the
95th
percentile
latency,
that's
aggregated
for
the
1000
queries
that
run
for
each
of
these
query
types.
So
you've
got
the
actual
test
case
here
so
again,
cpu
only
100
hosts
and
here's
the
query
name.
So
each
of
these
have
been
running
in
different
sessions,
but
I've
grouped
them
by
the
query.
A
So
we
can
see
what's
going
on.
This
is
all
by
the
way
generated
using
a
jupyter
notebook
with
python,
so
the
benchmark
data
it
doesn't
do
this
live
the
benchmark.
Data
is
stored
on
disk.
I
pull
it
from
the
vm,
so
there's
a
notebook
that
I've
added
to
that
that
tsbs
repo,
that
we
forked-
that
does
this
data
analysis
and
we
can
quite
easily
change
that
to
to
look
at
different
percentiles.
Here
I
could
put
the
you
know
50th
in
there
as
well,
for
example,
and
we
might
do
that
at
some
point.
A
So
again,
click
house
performing
really
well
there
all
sorts
or
sort
of
10
20
milliseconds.
This
is
only
milliseconds
time
scale
going
over
a
second
in
a
number
of
cases
there
again
for
this
one
and
I'll
scroll
down
to
a
case
where
it
doesn't
perform
that
just
so
there
is.
You
know
this
this
group,
by
order
by
limit
it's
a
more
complex
query
and
the
the
tables
that
I
set
up
and
cookouts
aren't
really
optimized
to
this
query.
They
don't
have
the
sort
of
proper
indexes
on
them.
A
However,
having
said
that,
while
it
is
significantly
larger
by
an
order
of
magnitude,
in
some
cases,
it's
not
drastically
slow
and
it's
certainly
it's
not
over
a
second,
whereas
if
you
look
at
some
of
these
time,
scale
ones
where
it's
failed,
for
example,
the
devops
case
here,
click
house
still
clocking
in
nearly
three
seconds
but
time
scale
taking
well
over
20
seconds
in
the
in
the
95th
percentile.
That's
you
know
five
percent
worse
95
better,
but
for
the
vast
majority
of
cases
click
out
out
performs
on
these
queries.
A
This
is
another
one.
This
last
point,
one
where
it's
querying
the
sort
of
very
last
point
in
a
data
set
is
a
mixed
bag.
Some
some
perform
better
some
performers
again
nothing
drastically
over
a
second
and
when
you're
creating
these
quite
complex
time
series
data
sets
running.
You
know
complex
analysis.
A
We
can
get
for
the
containers
and
memory
usage,
so
we
we
plot
it
near
the
cpu
rate
and
memory
usage
bytes,
which
is
a
metric
that
sort
of
contains
all
the
different
lower
level
memory
stats
like
sort
of
caches
buffers
resonance,
set
size
things
like
that,
so
the
cpu
usage
rate
there
and
you
can
see
the
cpu
usage
rate
in
a
lot
of
these
plots.
It's
quite
similar.
A
And
what
you'll
see
as
I
scroll
down
is
that,
while
the
cpu
is
fairly
consistent
between
the
two
often
the
average
of
click
out
is
a
bit
lower,
but
it's
variation
standard
deviation
seems
to
be
a
lot
higher.
You'll
see
that
the
usage
memory
usage
invites
again
with
click.
Asses
is
a
lot
lower
than
time
scales.
Let
me
scroll
down
a
bit
more
and
you
can
see
timescale.
A
For
example,
this
one
here
getting
well
up
to
60.
Gig
of
memory,
which
is
getting
close
to
the
actual
host
machine
memory
capacity
there,
as
click
house
stays
well
well
below
that
again
that
one
devops
4
000
creeping
above
60.
So
it
may
well
be
that
in
these
cases
the
actual
vm
is
under
provisioned
for
time
scale
here,
which
is
assigned
you
know.
Obviously,
click
house
performs
far
better
on
this
on
this
size
of
vm
and
we've
documented
some
limitations
there.
So
you
know
workers
and
databases
on
the
same
machine.
A
Here's,
for
example,
that
this
sort
of
naive
schema
that
we're
going
to
put
in
there
first
and
get
that
working
just
to
see
how
this
compares
against
the
existing
benchmarking
and
because
click
house
is
not
that
well
known,
and
I
don't
have
any
sort
of
production
experience
with
it.
I
don't
have
a
good
intuition
when
it
comes
to
designing
the
tables,
as
I
might
do
with
a
typical
relational
database.
For
example,
it's
a
column,
storage
database,
the
indexing
and
things
like
that
works
quite
differently
to
say
something
like
postgres.
A
So
I
need
to
do
a
few
experiments
just
to
just
to
see
if
what
I'm
doing
makes
sense
from
a
performance
point
of
view,
and
then
I'm
not
doing
something
like
completely
ridiculous.
But
luckily
now,
if
I,
if
I
get
this
merged
into
that
project,
I
can
just
run
these
tests
again
and
and
the
analysis
I
can
run
really
quickly.