►
From YouTube: Measuring DORA4 Metrics in GitLab
Description
Haim & Orit discuss the implementation plan for DORA4 metrics in GitLab
Epic: https://gitlab.com/groups/gitlab-org/-/epics/4358
A
A
So
the
four
are
deployment
frequency
lead
time
for
changes,
time
to
restore
service
change,
failure
rate,
it's
very
important
to
state
that
the
doral
metrics
all
relate
to
the
production
environment.
They
do
not
look
at
dev
testing
or
other
environments.
This
is
based
on
production
environments,
because
what
they
want
to
see
is
how
measuring
this
impact
on
the
end
user.
The
end
user
only
has
access
to
the
production
environments.
A
Is
built-
and
this
is
based
on
the
old
2019
metrics,
there's,
there's
a
new
report
for
2021
that
came
out,
and
we
probably
should
update
the
metrics
here,
but
in
any
case,
based
on
that
report,
what
do
we
see?
We
have
four
different
classifications
for
how
organizations
perform
elite
performers
high
performers,
medium
performers
and
low
performers,
and
for
each
one
of
the
metrics
there's
a
different
definition,
so
deployment
frequency
is
how
often
I
deploy
to
production
where
our
elite
performers
deploy
multiple
deployments
per
day
and
our
low
performers
are
very
waterfally.
A
They
have
one
big
release,
maybe
once
a
or
twice
a
year,
and
everyone
else
is
in
between
lead
time
for
changes
is
how
often
does
my
code
from
the
minute
I
started
coding
it
until
it
reaches
production
and
we'll
talk
about
how
we
measure
that
in
gitlab,
because
it's
a
little
bit
different,
but
just
in
general,
I
just
want
to
give
an
introduction.
What
is
dora
in
the
textbook
definition
and
elite
performers?
A
You
know
if
they
deploy
multiple
times
a
day,
then,
theoretically,
my
code
commit
can,
in
the
same
day,
can
reach
production
time
to
restore
service
is
if
I
have
an
outage
in
production.
How
quickly
do
I
repair
it
and
the
service
gets
back
up,
and
this
is
also
a
little
bit
tricky?
What
is
a
service
impairment?
Is
it?
You
know
the
entire
service
is
not
working
or
is
there's
a
bug.
A
A
A
Really
it's
a
combination,
because
if
we
look
only
at
velocity,
we
might
be
releasing
lots
of
buggy
code
and
then
you
know
my
stability
goes
down,
so
it
doesn't
help
me
to
just
you
know:
release
stuff
out
to
production
without
testing
it
properly
or
fixing
it
in
time
it.
So
you
really
have
to
look
at
the
two
together.
It's
not
really
wise
to
look
at
only
half
of
them,
but
they
do
mean
different
things.
A
B
A
So
I've
seen
everyone
being
interested
in
this
enterprises
and
small
medium
businesses.
Usually
the
enterprise
customers
are
willing
to
pay
for
it,
and
really
this
at
the
moment
is
only
available
for
ultimate
customers.
So
the
majority
of
the
customers
that
I
talk
to
are
enterprises.
However,
when
you
look
at
the
at
the
dora
reports,
usually
the
elite
performers
are
the
ones
with
the
new
newer
technologies.
A
A
A
So
it
depends
who
your
persona
is
and
that's
really
tricky
for
dora,
because
on
the
one
hand
we
are
catering
to
the
executive
persona
to
the
person
who
wants
to
know
what
is
my
roi.
I
just
put
a
ton
of
money
on
my
devops
infrastructure
in
my
organization
and
I
want
to
know
what's
in
it.
For
me,
it's
really
hard
to
slap
dollars
on
it.
A
So
there's
the
exact
persona
that
is
interested
in
seeing
improvement
over
time
and
at
the
end
of
the
day,
you
can
say
that
if
I
deploy
frequently
to
customers,
that
means
more
people
are
getting
new
functionality,
maybe
they're
paying
for
it,
and
that
means
hard
earned
cash,
which
is
great,
and
you
can
also
think
about
it
at
the
other
side.
If
I'm,
if
I
don't
have
an
outage
or
if
I
fix
outages
really
quickly,
then
I
don't
have
to
pay
all
these
penalties
that
I
have
for
slas
and
other
things.
A
So
again,
this
translates
into
money.
It's.
You
can't
really
see
the
money
in
in
front
of
your
face,
but
it's
there
behind
the
scenes
and
on
the
other
hand,
we
have
the
development
teams
themselves
that
are
interested
the
more
autonomous
teams
we
have
and
the
more
independent
they
want
they
are.
They
themselves
want
to
understand
how
they're
improving,
how
they're
improving
both
in
terms
of
quality
and
in
terms
of
the
velocity
and
the
more
automation
that
they
put
in
that
translates
into
this
velocity
and
scalability.
A
So
it
depends
on
who
is
your
persona
and
we
have
different
personas
for
dora
metrics.
It
can
be
the
team
level
and
it
can
be
the
exact
level,
and
that's
also
why
we're
also
thinking
about
different
ways
to
tier
this
and
to
chart
to
charge.
In
my
mind,
everyone
should
enjoy
dora
metrics,
and
that's
we'll
also
talk
about
this.
It
says
that
here
in
this
epic,
how
we
plan
to
do
that.
A
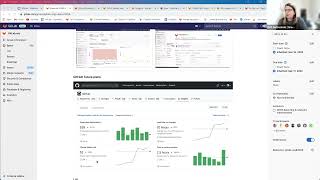
You
have
here
what
this
looks
like
in
github,
for
example,
you
can
see
production
change,
failure
rate
and
so
on,
and
this
is
talking
about
the
mvc.
We
still
haven't
completed
the
nbc
because,
as
I
mentioned,
we
only
have
two
of
the
metrics
and
not
four
of
the
metrics,
but
we're
getting
there.
You
know
yourself
because
we
just
put
in
the
morning
this
in
the
planning,
the
other
two
api
requests.
A
We
actually
already
completed
the
two
that
were
defined
as
the
mvc
and
showing
the
different
trends
in
different
levels,
and
what
we
said
would
not
be
in
the
mvc
was
the
ability
to
sort
by
milestone
additional
metrics,
which
are
not
the
ford
dora
ability
to
add
annotations.
This
is
really
important.
A
So,
as
I
mentioned,
the
nbc
starts
with
everything
in
ultimate
what
we
want
in
the
future.
So,
as
I
mentioned
in
the
future,
we
want
everyone
to
enjoy
dora
metrics,
even
our
open
source
community
on
our
few
free
users.
This
is
our
stewardship
promise
to
to
make
sure
that,
even
if
you
have
a
free
license,
you
can
benefit
from
a
lot
of
different
things.
So
what
we
plan
to
do
is
in
the
gitlab
core
in
the
free
model
to
have
these
tile
views.
A
A
Okay
yep,
these
are
this
is
old
ux
because
we
already
implemented
a
bunch
of
stuff.
So
we
can
definitely
update
the
epic.
But
it's
not
that
important
in
premium.
What
we
wanted
to
do
is
get
give
the
customers
on
the
project
level
access
to
to
the
graphs
and
the
tiles
like
the
free.
The
reason
is
because
the
premium
is
targeted
towards
the
team
view
and
collaboration
and
then
in
ultimate.
A
A
A
A
So
it's
a
cool
api
because
it's
the
same
api
for
all
the
metrics,
and
so
you
can
get
all
the
the
metrics
or
you
can
select
an
individual
one
which
is
really
fun
and
the
api
for
projects
and
groups
is
very
similar.
So
you
can
see
the
projects,
one
is
the
get
project
id
and
the
group
level
is
groups
id
so
they're
very,
very
similar,
and
they
give
you
a
lot
of
data.
The
api
is
super
flexible.
You
can
see
all
the
options
here.
You
can
change
the
start
and
end
date.
A
A
You
can
do
whatever
you
want
as
long
as
the
the
environment
here
is
defined
in
the
gitlab
cimo
file.
You
can
you
can
query
for
any
tier,
and
this
is
really
important
for
different
reasons.
A
lot
of
people,
enterprise
customers
that
I
spoke
to
that
are
in
highly
regulated
industries,
for
example,
banks.
They
can't
deploy
to
production
easily.
They
have
a
lot
of
hoops
to
go
through
and
even
though
the
their
velocity
is
really
quick
and
they
deploy
things
and
finish
the
coding
really
quickly.
A
B
A
A
Again
this
is
only
available
for
ultimate
customers
right
now,
so
something
that's
really
interesting.
Besides
the
basic
support
I've
heard
from
a
customer,
they
wanted
the
ability
to
exclude
environments
from
dora,
so,
for
example,
they
wanted.
I
don't
remember
exactly
what
this
customer
wanted.
Maybe
I
wrote
it
okay,
so
the
group
level
dorimetric
is
they
aggregate
the
data
it
takes
all
the
the
data
from
all
the
production
environments
and
adds
them
together
based
on
environment
tiers.
A
But
maybe
I
remember
that
this
specific
customer
that
I
spoke
to
had
different
geo
locations
for
their
production,
so
they
they
have
a
production
environment
in
europe
and
they
have
a
production
in
the
americas
and
they
wanted
to
be
able
to
compare
them.
So
in
this
case
you
can
exclude
it
and
then
get
only
a
specific
production
environment.
B
B
A
A
I
should
mention
that
as
a
way
of
starting
implementing
dora,
we
use
the
gitlab
iteration
value
and
since
this
started
from
work
from
the
release
team
on
ci
cd,
this
was
added
under
analytics
cicd.
But
I
think
dora
is
important
enough
to
have
its
own
separate
location,
which
needs
some
ux
work.
But
we
haven't
done
that.
B
A
A
A
So
what
we
had
planned
to
do-
and
this
is
just
a
representative
of
one
of
the
dora
metrics-
was
to
be
able
to
show
a
graph,
and
I
opened
it
here
for
deployment
frequency,
for
example,
okay,
and
what
you
can
see
here
is
it
tells
you
what
you're
seeing
okay
and
you
can
see
that
we
can
toggle
between
last
week
last
month
and
last
90
days,
and
you
can
see
that
in
gitlab
we're
pretty
good
in
deployment
frequency.
It's
pretty
predictive
drops
are
usually
on
the
weekends.
A
A
B
A
B
A
A
A
Some
things
that
we
added
recently
was
the
average
bar
here,
which
was
something
customers
asked
for,
because
they
wanted
to
kind
of
see
how
they're
doing
how
they're
fluctuating
based
on
the
average.
Something
that
we
want
to
add
is
a
target
so
that
customers
can
add.
I
want
to
be
at
120,
for
example,
and
so
I'll
see
my
average
and
I'll
see
a
bar.
That
represents
the
target
and
I
can
see
if
I'm
above
or
below
target,
and
we
can
change
target
based
on
how
well
we're
doing.
A
A
If
you
look
at
value
stream
analytics,
for
example,
so
this
is
something
that
we
plan
to
move
over
also
to
dora.
So
that
is
the
same,
consistent
improvement
experience
and
in
the
beginning
we
started
with
with
the
last
90
days
because
of
performance
issues.
So
the
only
thing
is
that
we
need
to
be
mindful
for
performance.
A
We
don't
want
people
to
get
stuck
but
allow
people
to
customize
their
dates
in
a
more
flexible
fashion
and
also
everything
that
we
can
do
in
the
api
level.
I
would
like
to
see
that
here
on
the
graph
level
so
being
able
to
select
a
different
tier
right
now.
It
shows
me
only
production,
but
maybe
I
want
to
see
staging.
We
support
it
on
the
back
end,
there's
really
no
reason
not
to
do
it,
except
for
capacity
constraints.
A
I
would
imagine
there
would
be
a
drop
down
here
and
you
could
do
multiple
selection
or
a
single
selection
at
the
beginning,
with
the
different
deployment
tiers
and
then
after
we
add
support
for
the
environment,
name
have
environment,
name
and
again.
The
problem
here
is
that
it
shows
me
only
one
month,
for
example
or
one
week.
Maybe
I
want
to
see
a
comparative
view.
A
B
A
A
A
leadership
over
this
you
can
decide
what
is
more
important
in
my
mind,
completing
the
the
four
is
the
most
important
thing
at
the
moment:
okay,
so
that
was
this
epic.
Let's
see
if
we
have
anything
else
in
epics,
besides
everything,
that's
not
organized
in
the
epic
and
feel
free
to
organize
this.
However,
you
want
okay,
we
have
comparative
view.
B
B
A
A
Maybe
I
don't
have
enough
owners
for
deployments
in
the
production
environment,
so
there's
really
different
actions
that,
based
on
the
comparison,
I
can
understand
and
make
myself
more
efficient,
a
dashboard
based
on
projects
and
subgroups
see
what
this
is.
I
don't
remember,
but
we'll
open
that
up
and
see
so
customers
who
are
running
gitlab
as
a
service
for
the
tenants,
one
dashboard,
the
comparison
door
and
metrics
between
tenants
projects
and
subgroups.
A
A
B
A
A
A
A
A
A
A
A
For
example,
for
flight
flight
attendants,
so
pilots,
the
the
better
you
do,
the
more
you
can
do
it
by
yourself.
So
this
goes
into
different
permissions
and
rules
that
you
can
do
in
as
part
of
the
software
development
life
cycle.
So
maybe,
if
your
team
is
really
really
high
performing
you,
can
you
don't
need
manual
approval
for
deployment
to
production?
Or
maybe
you
can?
I
don't.
A
A
A
A
This
is
okay,
it's
interesting
because
it's
related
to
change
failure
rate.
There
is
some
kind
of
loose
connection
to
that,
but
it's
not
one
of
the
top
four
non-standard
release
frequency.
I
don't
even
remember
what
this
was:
let's
open
it
up
and
see
on
how
often
he's
deployed
previously
unplanned
work
to
production.
That's
not
part
of
the
planning
frequency.
A
A
A
B
A
A
lot
of
second,
the
yaml
exists
only
on
the
project
level
inside
the
source
code.
The
group
level
doesn't
have
it
it
just
aggregates
the
data,
it's
think
about
it
as
a
container
that
holds
the
different
projects.
So
the
way
that
I'm
thinking
about
it
is
okay.
I
can
see,
for
example,
sorry.
This
is
just
the
the
download
button,
but
in
if
you
look
at
test
coverage,
which
was
my
inspiration
for
this
issue
here,
you
can
select
which
projects
you
want
to
download
from.
A
B
B
A
A
B
B
A
So
maybe
an
mvc
even
starts
with
having
this
ability
at
the
project
level
and
just
having
a
link
from
the
group
level
to
specific
projects
to
download.
Then
later
you
can
aggregate
it.
I
mean
you
need
to
kind
of
think
about
the
different
iterations
that
we
can
do,
but
we
want
to
give
value
to
our
customers
as
quickly
as
possible.
So
what
is
the
smallest
component
that
I
can
do
that
helps
them
out.
A
A
Okay,
dora
best
practices.
This
is
more
of
a
documentation
issue,
a
lot
of
the
customers
that
I
talk
to
on
a
weekly
basis.
They
are
looking
for
guidance
on
how
to
get
started.
What
should
we
measure?
What
should
we
measure?
What
should
I
do
so?
I
think
we
have
a
service
to
do
here
to
our
users
to
kind
of
guide
them
through
it,
so
creating
a
blog
post
about
dora.
A
I
might
have
already
done
that
and
and
talking
about
what
what
it
is,
how
do
we
use
it,
creating
a
survey
so
that
people
can
assess
themselves
how
they're
doing
based
on
the
survey
results?
We
can
point
to
documentation
an
area
to
improve
not
only
based
on
the
survey
but
think
about
think
about
combining
the
different
analytics
that
we
have
in
gitlab.
A
Imagine
that
we
have
even
without
combining
imagine,
we
have
a
change
failure
rate
and
it's
really
low,
I'm
doing
really
poorly.
Maybe
I
can
tie
to
users
and
tell
them
hey.
Did
you
know
that
we
have
a
feature
that
does
automatic
roll
back
and
in
case
you
have
an
incident?
It
does
that
and
that
will
automatically
improve
your
change
failure
rate,
because
the
service
will
be
up
because
it
indicated
automatic
flight
go
back.
We
can
help
them
because
git
lab
is
a
huge
product.
A
A
Points
to
different
documentation
and
okay-
we
already
talked
about
this,
so
really.
This
is
all
about
making
this
more
visible
to
users
and
helping
our
users
out
when
they
get
stuck,
but
also
think
about
how
we
can
connect
this
to
value
stream
metrics
and
how
value
stream
metrics
dora
metrics
are
more
of.
How
am
I
doing
versus
the
industry?
A
A
B
A
A
I
don't
know
I
feel,
like
we
already
discussed
this
before
addadora
badge
to
the
project
level,
so
this
is.
This
is
actually
something
really
neat
that
we
thought
of
doing.
This
is
related
to
the
decision
that
we
have
to
make
whether
or
not
to
copy
the
numbers
from
the
dora
report,
but
assuming
that
we
do
decide
to
do
that,
we
can
already
give
our
users
badges
based
on
how
well
they're
doing,
which
is
really
great,
because
it's
gamification
it's
incentivizing.
B
A
A
B
So
it
makes
sense,
of
course,
for
for
the
gitlab.com.
You
know,
customers
that
to
have
this
benchmark
and
to
have
this
kind
of
comparison
index,
but
people
that
working
on-prem,
the
self-managed
and,
of
course,
not
gitlab
customers
that
measure
their
doors
so
how
they
can
kind
of
evaluate
their
results.
A
Well,
the
fact
that
someone
is
self-managed
doesn't
mean
they
can't
evaluate
the
results
they.
The
numbers
are
published
in
dora.
So
if
we
look
at
the
2019
numbers,
you
know
if,
if
you're
here,
if
you're
here,
if
you're
here,
if
you're
here
right
it
doesn't
matter
if
it's
a
cloud
platform
or
if
it's
self-managed,
on-prem
installation,
you
would
know
that
anyway,.
B
A
So
if
we
look
for
self-managed
users,
my
idea
here
was
to
present
a
tool
as
part
of
your
hiring
process.
You
saw
that
you
have
access
to
the
comp
calculator,
so
I
was
thinking
it
allows
you
to
insert
your
own
data
based
on
your
self-managed
data,
you
that
you
yourself
know,
and
it
will
show
you
where
you're
located.
A
A
A
So
the
way
that
that
you
measure
the
time
to
start
service
is
really
when,
when
a
service
is
down-
and
as
I
mentioned
it's
a
philosophical
question-
because
what
does
it
mean
that
a
service
is
it
a
bug?
Is
it
everything's
down?
So
the
way
that
I
decided,
I
thought
of
idea
to
mitigate
this
was
to
use
our
own
gitlab
incidents
and
measure
mean
time
to
resolve
incidents
as
the
the
time
to
restore
service.
A
If
you
have
an
incident,
that
means
probably
the
service
was
down
and
measure
that
it's
relatively
simple
to
measure,
and
so
I
think
it's
a
good
measurement.
The
downside
of
it
is
the
number
of
users
that
can
benefit
from
this,
because,
even
though
we're
we
wish
that
everyone
uses
gitlab
for
everything
in
reality,
a
lot
of
people,
for
instance,
don't
use
gitlab.
A
A
B
A
A
A
I
think
the
graphics
need
to
be
updated,
but
that's
the
idea.
Okay,
this
is
actually
outside
the
scope
of
dora,
but
I'll
give
you
a
little
bit
of
a
history.
So
you
understand,
if
you
go
to
the
group
level,
if
you
go
to
the
group
level
analytics
under
ci
cd
you'll
see,
there's
release
metrics
okay,
this
was
it
has
nothing
to
do
with
doral
metrics.
This
is
kind
of
bonus
points
that
we
got
when
we
introduced
dora
metrics
at
the
group
level.
A
A
A
Okay,
so
it's
adding
the
charts
once
we
add
ci
once
we
add
the
change
failure
rate
and
time
to
restore
we'll,
add
the
charts
similar
to
the
way
that
they
look
today.
So
today
we
have
a
tab
for
deployment
frequency
and
lead
time
for
chases.
Imagine
that
you
also
have
one
here
for
change
failure
rate
and
one
for
time
to
restore
service.
B
A
B
Okay,
so
I'm
happy
we
have
this
recording,
so
I
can
come
back
to
review
them
and
yeah.
I
think
that
in
the
short
term
I
try
to
at
least
you
know,
capture
some
low-hanging
fruits
and
to
see
what
can
be
done
and
for
the
long
term
we
will.
You
know,
try
to
look
in
the
kind
of
and
more
end-to-end
kind
of
perspective.