►
Description
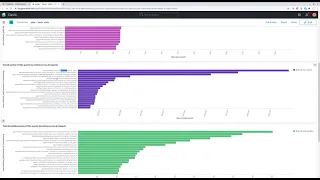
Overall statistics gathered from performance bar data can be used for identifying SQL query issues.
A
Show
a
new
performance
bar
feature
performance
bar
is
a
handy
tool
for
identifying
performance
issues.
On
a
specific
page,
for
example,
you
can
see
a
list
of
sql
queries
done
by
request
and
you
can
investigate
its
backtraces
and
identify
methods
which
executes
these
slow
queries
or
so
many
sql
queries.
A
A
A
A
A
This
is
handy
for
identifying
a
methods
which
which
execute
sql
query
most
frequently.
So
we
can
see
that
the
full
part
is
full
part
method
executes
an
sql
query
and
it's
called
really
often
so.
This
can
be
handy
for
identifying
queries
which
might
be
optimized
further
because
they
are
called
so
often
total
time
is
handy
for
identifying
methods
with
biggest
impact,
because
these
methods
execute
this
chart
shows
overall
time,
it's
duration,
multiplied
by
the
frequency.