►
From YouTube: 2023-04-20 Scalability Team Demo
Description
No description was provided for this meeting.
If this is YOUR meeting, an easy way to fix this is to add a description to your video, wherever mtngs.io found it (probably YouTube).
A
So
this
is
an
incident
where
we
crossed
the
Tipping
Point
and
you
can
see
the
this
is
kind
of
a
high
level,
generic
generic
representation
of
our
our
connection,
pool
becoming
saturated.
Obviously,
right
here,
that's
that's
an
effect,
not
a
not
a
cause.
It
Cascades
to
the
rest
of
the
application
stack
and
kind
of
the
the
usual
way
when
more
people
want
to
write
queries
than
than
the
system
can
handle
so
I'm
going
to
dig
from
here
into
into
some
causes.
B
C
A
A
few
times
a
minute
we
take,
we
look
at
a
snapshot
of
a
standard,
postgres
catalog
view
called
PD
stat
activity.
It's
got
one
row
per
per
postgres,
backend
and,
and
some
of
the
really
interesting
data
it
gives
is
what
that
back
end
is,
is
currently
waiting
on.
If
anything,
if
it's
active
and
it's
running
on
CPU
and
it's
not
currently
in
a
weight
State,
then
there
won't
be
a
value
for
a
weight
event,
but
in
this
case
we're
filtering
to
when
the
weight
event
is
the
lock
manager.
A
Lightweight
lock,
this
particular
so
lightweight
locks
in
general
are,
let
me
take
a
step
back
just
because
the
vocabulary
can
be
a
little
confusing.
Normally,
when
you
talk
about
database
locks,
we're
talking
about
what
formerly
is
called
heavyweight
locks.
This
is
a
lock
on
a
table
or
an
index
that
says
hey
I'm
using
this
table.
A
Please
don't
change
it
to
schema
at
this
very
moment,
for
example,
when
when
we
need
to
update
data
structures
in
memory
data
structures
with
with
a
safely
concurrently,
we'll
use
kind
of
a
mutex
mechanism
called
lightweight
locks,
and
in
this
case
the
specific
flavor
of
lightweight
lock
that
we're
that
we're
talking
about
is
the
one
that
guards
the
hash
table.
That
records
who
has
heavyweight
locks
and
that's
why
the
lightweight
lock
is
called
lock
manager.
A
So
just
want
to
clear
up
the
terminology,
because
that
that
can
really
hear
people
off
so
as
as,
as
that
suggestion
kind
of
implies,
when
you
see
contention
over
the
lightweight
lock
that
guards
access
to
that
heavyweight
log.
What
we're
really
seeing
is
contention
over
the
frequency
with
which
back-ends
are
trying
to
change
the
state
of
what
tables
and
indexes
they
have
locked.
A
So
the
resource
that
we're
starving
for
here
is
is
access
to
the
lightweight
low,
to
the
this
particular
lightweight
lock,
and
it's
it's
specifically
driven
by
how
often
we
acquire
and
release
heavyweight
locks
on
tables
and
indexes
by
extent,
I'm
kind
of
jumping
into
solution
before
I've
gone
through
the
whole
problem.
But
I'm
gonna
I'm
Gonna
Roll
With
It.
By
extension,
this
means
when
we
partition
a
table.
For
example,
if
we
partition
a
table
into
10
pieces,
we
now
need
10
times
as
many
locks
and
it's
not
just
locks
on
the
table.
A
It's
locks
on
all
of
the
indexes
of
the
table.
So
if
you
run
something
like
something
like
select
star
from
projects
where
ID
equals
one
you're
going
to
acquire
the
lock
on
the
table
and
every
index
for
that
table
and
each
one
of
those
each
one
of
those
heavyweight
lock
acquires
requires
acquiring
and
releasing
one
of
the
lock
manager
locks.
There's
only
16
of
these
locks,
every
table
and
index
is
guarded
by
an
arbitrary
one
of
those
16.
A
A
We
knew
that
each
replica
DB
was
getting
about
60
000
queries
per
sec
per
second,
when
we
reintroduce
the
two
additional
replicas
that
went
down
to
about
50,
000
queries
per
second
and
we're
okay
at
that
point,
and
we
were
not
okay
at
the
60k,
but
historically
a
month
earlier,
we
had
been
perfectly
fine
at
60k
and
I.
Think
the
difference
is
the
rate
of
how
often-
and
we
acquire
these
Subway
locks.
The
block
Mains
are
lightweight.
A
B
Can
I
still
interrupt
you
and
ask
some
clarifying
questions
because
I
want
to
keep
keep
up
with
what
you're
saying
so
these
are
replicas.
They
serve
free
traffic,
but
so
read
queries
still
require
heavyweight
locks.
Yes,
these
are
not
logs
that
are
happening
because
we're
modifying
something
but
read
queries
require
them.
That's.
A
B
A
There's
a
big
caveat
that
I'm
trying
to
find
the
right
place
to
add.
There
is
because
this
is
a
known
contention.
Point,
historically,
a
postgres
introduced
what
it
calls
a
fast
path
for
trying
to
acquire
a
heavy
weight.
Lock
that
essentially
says
under
the
right
conditions.
We
can
avoid
having
to
update
the
shared
memory
data
structure
and
only
update
a
local
hash
table
instead
and
the
the
require
I
can
I'm
going
to
close
for
now
I'm
going
to
gloss
over
the
requirements
for
it.
B
B
So
naively,
every
query
needs
to
take
a
heavyweight,
lock
and
they've
done
lots
of
optimizations
to
reduce
the
pain
of
this,
but
it
still
happens,
and
then
the
other
problem
you're
saying,
is
that,
depending
on
things
like
joints
in
queries,
you
don't
know
how
many
heavyweight
blocks
a
single
application
query
needs.
So
there
you
can
get
unlucky
and
run
a
bunch
of
queries
that
don't
hit
an
optimized
path
and
I
do
need
a
whole
lot
of
locks.
A
Yes,
great
summary:
yes,
thanks
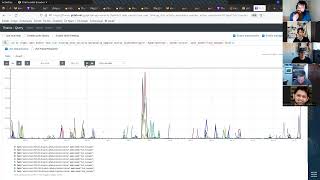
yep,
absolutely
so
so
back
to
the
graph
there's
two
things:
two
visual
aids
I
wanted
to
kind
of
talk
through.
One
of
them
is
this
graph,
where
we
can
see
that
this
is
obviously
the
incident
that
we're
talking
about,
but
this
is
a
stat
graph,
grouped
by
by
replica
we're
looking
only
at
sorry.
The
vertical
axis
is
counting
how
many
backends
were
at
the
moments
that
we
that
we
pulled
the
the
state
were
stalled
waiting
for
for
this
particular
kind
of
lightweight
lock.
A
So
if
we,
if
we
go
to
just
a
line
graph,
we
can
see
that,
on
the
most
the
most
badly
impacted
replica,
there
were
659
stole
stole
postgres
backends,
all
of
which
were
rating
for
this
type
of
law,
and
this
is
this
is
really
really
serious.
This
is
essentially
all
practically
all
of
them
were
sold
waiting.
A
You
know,
locks
and
lock-like
data
structures
for
short
periods
of
time.
It's
a
really
only
problem
when
the
contention
escalates
to
the
point
where
it
impacts,
latency
and
limits
throughput,
and
the
the
difference
between
between
the
workload
on
this
terrible
day,
and
these
more
normal
days
wasn't
too
huge.
It
was.
It
really
was
just
that
we
we
pushed
a
a
few
more
percentage
points
toward
these
replica
is
by
taking
a
few
of
its
peers.
A
A
We
are
in
a
dangerous
position
for
for
having
this
come
back,
especially
if
we
take
one
or
both
of
those,
those
old
replicas
away.
I.
Think
most
of
the
folks
here
are
probably
aware,
but
we're
all
of
these.
All
of
these
database
servers
are
running
kind
of
old
VMS,
they're
they're,
the
N1
machine
family
and
we're
we're
wanting
to
switch
them
to
to
N2
or
or
the
AMD
variants
of
N2,
and
these
last
two
ones.
A
Maybe
it
will
be
okay
when
we,
when
we
upgrade
all
of
the
replicas
to,
or
rather
all
of
the
journey
nodes
to
to
be
these
newer
machine
types
they
definitely
performed
better
during
the
incident
and
I'll
kind
of
show
show
here
that
we
didn't
have
any
samples
where
they
were
where
they
were
overwhelmed,
but
I
also
want
to
point
out
that
they,
they
also
only
got
a
slight
bump
in
in
the
query
rate,
and
we
know
that
they
have.
They
have.
A
A
I
think
they
did
slightly
better
and
it
was
just
barely
enough
that
so,
but
that's
a
fantastic
question
so
and
that's
kind
of
where
I
was
going
so
some
so
in
terms
of
so.
For
purposes
of
this
conversation,
I'm
going
to
talk
about
CPU,
speed,
really
in
terms
of
instructions
per
second,
so
assembly
instructions
for
a
second.
A
When
and
I
think
that
we're
just
I
think
that
we're
just
barely
avoiding
that,
under
normal
circumstances,
on
the
old
nodes
and
the
new
nodes
have
a
higher
instruction
throughput,
and
so
they
are
a
little
bit
further
away
from
that
100
of
the
time
the
lock
being
held.
Does
that
make
sense,
yeah
thanks.
C
That's
anything
anything
we're
looking
at
here
is
suffering
from
this,
like
the
resolution
problem
that
you
brought
up.
So
even
the
new
notes
that
barely
show
up
when
you
highlighted
them
could
be
super
close
to
the
Tipping
Point,
already
they're,
just
a
little
bit
farther
off
than
the
older
ones.
Yes,.
A
A
This
is
so
I
I'm
going
to
gloss
over
the
details
of
how
how
I
capture
this,
unless
someone's
interested,
because
I
find
it
very
interesting,
but
I'm
gonna
just
focus
on
the
data
right
now,
so
this
is
for
a
10.
Second
time
span,
we
captured
every
time
we're
capturing
every
time
we
try
to
acquire
one
of
these
16
luck,
manager,
locks
and
it's
not
immediately
available.
A
In
other
words,
when
it's
contended,
how
long
did
it
take
to
acquire
that
look
when
it
was
contended-
and
this
is
the
distribution
we're
seeing
so
in
10
seconds
we
had?
Maybe
you
know
maybe
45
000
or
so
or
45,
50,
000
or
so
points
when
it
was
contended
and
most
of
them
resolved
in
less
than
four
microseconds,
but
some
of
them.
The
long
tail
is
what
really
worries
me
where
sometimes
we
had
over
over.
A
You
know-
and
this
was
just
a
random
10
seconds
by
the
way
it
wasn't
during
an
incident.
This
was
just
I
got
up
and
I
ran
my
my
capture,
utility
and-
and
this
was
the
result-
it
there's
a
lot
of
variation
in
this
long
at
different
points
in
the
day
and
there's
I've
seen
this
long
tail
in
production
go.
You
know
several
times
higher
where
we're
we're
waiting
for
several
milliseconds
to
acquire
the
lock
and
those
are.
Those
are
I.
A
A
This
is
one
of
the
open
questions
that
I'd
like
to
try
to
answer
and
I've
got
I've
got
a
few
hypotheses
about
what
could
be
causing
it
and
some
of
them
I've
ruled
out,
and
some
of
them
are
still
kind
of
in
the
running
for
a
while
I
thought
that
that
hyper
thread
contention
May
potentially
play
a
role
and
I.
Think
that's
I
think
that's
unlikely
at
this
point,
because
sorry
I
shouldn't
talk
about
discarded
theories.
So
so
this
is.
This
is
a.
A
This
is
an
open
question
and
but
I
guess.
The
main
reason
I
wanted
to
show
this
distribution
is,
is
to
kind
of
you
know,
put
put
some
some
hard
data
in
front
of
you
and
oh
I
forgot
to
mention
these
there's
there's
two
lock
modes
that
come
into
play
with
lightweight
logs
the
shared
mode,
where
that's
a
reader
lock
and
an
exclusive
mode.
That's
it's
a
really
Rider
lock!
So
this
these
lock
manager
locks
are
almost
always
acquired
in
exclusive
mode.
A
There
are
cases
where
it's
acquired
in
shared
mode,
but
the
count,
the
the
analysis
that
we've
done
here
really
highlighted
that
it's
the
exclusive
mode
where,
where
the
contentions
happening
and
and
if
we,
if
we
capture
every
every
event,
every
call
to
LW
Locker
choir
rather
than
just
the
contended
ones
it.
It
highlighted
that
that
that
we
far
more
often
are
acquired
in
exclusive
mode
rather
than
shared
mode.
A
A
A
I
think
this
will
make
everyone
much
more
comfortable
in
in
kind
of
planning
out
our
capacity
requirements
as
well
as
being
comfortable
with
with
being
able
to
make
query
changes
like
if
we,
if
we
make
if
we
make
query
changes
or
schema
changes
like
we.
We
know
that
some
of
our
tables
are
too
big
and
we
know
that
the
solution
to
this
is
to
partition
them
and
there
are
lots
and
lots
of
great
benefits
to
do
in
this
partitioning.
A
B
C
A
So
yeah
I
want
them
to
feel
comfortable
doing
that
very
important
work,
I'm
glad
you
mentioned
the
fast
path
again.
It's
I
I
wrote
I'll
put
this
in
the
issue,
but
I
wrote
up
a
a
really
concise
kind
of
bullet
point
list
of
what
what
are
the
prerequisites
for
for
hitting
the
past
path?
And
many
of
our
queries
do
so
kind
of
one
of
my
ideas
for
follow-up
is
to
try
to
identify
queries
that
don't
like
one.
A
One
of
the
one
of
the
requirements
is
there's
each
back.
End
has
16
slots
for
for
recording,
fast
path
activity
and,
if
you,
if
we
filled
up
those
15
slots
within
the
transaction,
we
can't
use
fastpath
anymore.
For
for
the
rest
of
the
for
the
rest
of
the
queries
in
that
transaction
and
effectively,
that's
I
mean
that's,
that's
a
hard-coded
number
so,
but.
B
A
A
A
Exactly
so,
that's
kind
of
the
way
I'm
leaning,
although
definitely
I,
I
I,
also
kind
of
want
to
be
able
to
give
advice
about
how
to
Reco.
You
know
how
to
construct
the
queries
to
to
like
hit
the
fast
path,
more
often
but
really
I,
agree.
I,
don't
think
it's
practical
to
expect
everyone
to
become
an
expert
in
in
this
particular
really
weird,
optimization
goal
yeah
and.
B
A
Yeah
yeah,
exactly
like
I,
think
I,
think
kind
of
crystal
ball
time.
I.
Think
one
of
the
easiest
ways
for
us
to
run
into
this
problem
is
to
to
add
an
index
to
a
frequently
access
table,
and
perhaps
you
know
some
set
of
existing
queries
already
were
you
know
like
perhaps
joining
that
table
to
one
other
table
and
the
the
total
number
of
of
indexes
across
those
tables.
A
So
you've
got
two
tables
and
if
you've
got
14
indexes
on
on
those
tables-
and
we
add
one
index
to
either
of
those
tables,
guess
what
you
no
longer
qualify
for
a
fast
path.
So
now,
every
time
we
run
that
that
particular
query
it
has
to
do.
It
has
to
go
to
the
shared
memory
log
table
and
compete
for
these
LW
locks,
and
this
is
this
is
no
one's
fault.
It
wasn't
of
a
code
change,
it
was
a
schema
change
or
vice
versa.
A
A
B
C
A
A
That's
it!
Okay,
okay!
So
the
way
the
way
BPF
instrumentation
works
is
you
want,
so
you
want
to
cut
catch,
calls
to
a
function.
The
say
say:
the
entry
to
a
function
like
a
wlr
acquired
the
way
that
works
is
in
the
binary,
the
the
the
first
instruction.
That's
that's
part
of
entering
the
that
that
function
gets
replaced
with
a
single
byte
instruction
called
ins.
Three,
that's
that's
effectively
a
call
out
to
an
interrupt
Handler.
A
Every
call
to
that
function
is
going
to
hit
this
this
instruction
and
whatever,
whatever
the
the
other
instruction,
was
whether
it
was
a
single
byte
or
multi-byte
instruction.
We
we
will
run
that
instruction
after
calling
the
hook
that
the
interrupt
Handler
is
handing
off
to
so
what
we're
seeing
in
this
Trace
is
we're
catching
every
where
we're
we're
observing
with
with
earth
based
CPU
profiling.
That's
capturing
a
stack
Trace
from
our
process
from
our
postgres
processes,
every
every
99
times
a
second.
A
So
this
is
just
standard
CPU
profiling
on
a
timer
basis
and
I
ran
that
for
60
seconds
during
that
60
second
window
I
also
ran
the
10
second
BPF
Trace
Tracer
extracted
all
of
the
all
of
the
only
the
stacks
where
that
tracer
was
active
or
what
we're
calling
the
LW
luck
acquire
function,
and
you
can
see
that
this
is
the
just
proportionally
on
the
graph.
This
is
how
much
time
we
spent
in
LW
luck
acquire
normally.
A
B
A
B
It
because
ebpf
runs
in
the
kernel,
so
you
cannot
run
your
BPF
program
without
going
into
the
kernel
and
back
so
like
you,
never
want
to
do
extra
function,
goals
and
there's
a
reason.
This
isn't
it
it's.
It's
almost
always
terrible
to
make
a
user
space
function
into
a
function
into
a
system
call
yeah.
B
A
Yeah
exactly
so,
that's
that's
why
we
can't
do
this
approach
there.
There
are
kind
of
a
few,
a
few
other
kind
of
models
we
could
maybe
do
so.
This
is
this
is
highly
speculative
and
may
not
actually
be
practical
just
to
kind
of
preface
it
with
a
with
a
caveat
two.
The
two
kind
of
hair
brained
ideas,
I'm
entertaining
right
now
is
one
we
could.
A
A
A
B
A
A
So
the
other
hairbrained
idea
I
have
is
that
also
may
not
work
out
is
there's
a
there's.
Another
catalog
table
called
PG
locks.
That's
that's
just
describing
what
heavyweight
locks
are
currently
held
by
open
transactions
and
one
of
the
fields
it
it
includes
is:
did
we
acquire
this
lock
through
fastpath,
so
that
can
let
us
differentiate
between
whether
we're
acquiring
the
look
on
fast
path
or
not
holding
that
in
the
same
way
that
we
pull
PT
stat
activity?
A
Every
couple
you
know
a
couple
times
a
minute
may
not
give
us
a
lot
of
insight,
I'm
not
really
sure,
but
it's
it's
I
figure,
it's
worth
a
shot,
so
that
that's
the
other
thing
on
my
list
to
to
try
out
as
and
see
if
it
can
a
get
useful
information
from
it
and
B
come
up
with
a
way
to
to
make
a
metric
out
of
it.
So,
that's
that's.
That's
that's
as
far
as
I
got
so
far
on
on
ideas.
B
A
B
A
Yeah,
so
that's
that's,
that's
kind
of
the
the
whirlwinds
tour.
Hopefully
that
was
interesting
and
yeah
I
think
I
I
mean
kind
of
circling
back
to
what
we
do
about
it.
I
think
it's
important
to
get
a
utilization
metric
and-
and
it's
also
important
to
avoid
incidents
and
I
I
feel
like
we're
we're
currently
in
a
dangerous
spot
where,
if
we
lose
a
replica,
whether
it's
planned
or
unplanned,
we'll
be
we'll
be
in
a
state
where
we
could
potentially
cause
it.
B
B
A
The
last
time
I
ran
into
this
bottleneck
at
a
previous
company
about
six
years
ago.
We
we
did
actually
rewrite.
We
identified,
which
queries
were
the
the
greediest
consumers
and
we-
and
we
rewrote
them
to
to
to
with
with
this
as
an
optimization
goal,
reducing
the
the
acquisition
rate
for
the
lightweight
law.
A
In
our
case,
we
knew
we
knew
what
the
candidate
queries
were,
and
it
was,
you
know,
a
small
enough
number
that
we
could
afford
to
manually,
look
at
them
and
and
do
some
tuning
on
it
and
that
that
got
us
that
got
us
most
of
the
way
out
of
the
pinch
and
I
I
also
built
a
custom
built
the
postgrad
that
gave
us
more
lightweight
lumps
in
in
the
pool
and
a
few
versions
later.
The
community
did
the
same
thing,
which
is
why
we
have
16
now
as
a
standard.
A
Yeah,
yes,
I,
think
I,
think
I've
seen
I'll
see
if
I
can
dig
it
up.
I
think
I
saw
a
write-up
from
one
of
the
postgres
as
a
service
clones.
It
might
have
been
Aurora,
but
I
can't
remember
for
sure
that
was
talking
about
talking
about
how
to
how
to
interpret
contention
over
overlock
manager
lightweight
locks
in
particular.
A
So
that's
exactly
the
problem
we're
talking
about
and-
and
they
were
talking
about,
increasing
the
number
of
of
of
replicas
which
their
their
postgres
has
a
service.
So
they
make
more
money
if
you
run
more
replicas,
so
I
kind
of
take
that
with
a
great
assault,
but
it
is
good
advice.
Also
so
yeah,
a
great
question,
I
I
guess,
that's
that's
kind
of
my
my
Half
Baked
answer
is:
is
yeah,
adding
replicas
and
and
trying
to
optimize
queries
to
to
to
reduce
the
the
acquisition
rate?
A
I
guess
like
from
our
perspective.
We
do.
We
do
a
lot
of
caching
and
query
results
so
from
the
application
side,
if,
if
there
are
frequently
run
queries
that
we
could
afford
to
to
cast
more
often
at
a
at
a
at
any
of
the
other
layers,
that's
another
way
to
to
mitigate
by
just
reducing
the
the
block
manager,
acquisition
rate.
A
A
Cool
I
I've
only
documented
about
half
the
research
I've
done
so,
but
a
lot
of
the
flame
guys
we
looked
at
are
are
not
in
the
issue
yet,
but
I
I
intend
to
get
them
there
to
air
tomorrow.
So
if,
if
you
happen
to
want
to
see
more
of
that,
give
me
a
ping
or
or
just
wait,
wait
a
couple
days
they'll
be
there.