►
Description
Andrew takes Marin through GitLab.com's SLO framework.
Some topics covered include:
* Symptom-based Alerting vs. Caused-based Alerting, RED Method Monitoring, USE Method Monitoring
* How we calculate the SLI, SLA, SLO for each service
* How to use our Grafana graphs to visualise the SLA trend for each service
A
So
I
kind
of
started
off
on
on
this
page,
which
is
the
SLA
page,
and
so
this
is
kind
of
telling
us,
according
to
all
of
these
metrics,
that
we've
been
recording
how
much
of
the
time
we
are
within
our
accepted
target
or
targets
for
for
SLO,
and
so
you
can
see
over
the
last.
This
is
30
days.
You
know
it
was
just
under
80%
and
now
it's
up
at
95,
just
somewhere
above
95
percent
and
another
really
important
thing
to
kind
of
keep
in
mind.
A
You
know
that
release
or
we
revert
the
change
that
did
it
rather
than
you
know
that
change
was
in
for
over
a
month
for
right
and
incidentally,
during
that
time
we
had
very
little
observability
into
sidekick
and
and
so
kind
of
while
I'm
walking
through
all
of
this,
you
might
kind
of
be
looking
at
the
numbers
and
going
like
Oh
like
85%.
That's
rubbish
like
this
is
a
rubbish
framing,
but
I
feel
that
the
framework
is
good.
A
We
just
have
to
improve
the
quality
of
the
data
that
comes
into
the
framework
in
order
for
it
to
to
really
start
seeing
seeing
the
results-
and
you
know,
as
I
said
here,
you
can
see
sidekick
only
achieved
its
its
SLA
sixty
one
percent
of
the
time
and
gets
as
well
I.
Don't
quite
know
why
that
is.
Oh,
it's
related.
It's
the
same
problem.
Actually
it
was.
It
was
a
problem
in
the
Prometheus
Ruby
library
and
then
so
from
there.
A
One
of
the
other
things
that
that
we
were
just
talking
about
before
we
started
recording
was
the
first
time
I
opened.
This
page
had
only
had
three
items
on
it
and
it
actually
looks
like
me
still
missing
a
lot
of
the
items
here.
Oh,
no
sorry
Thank,
You,
Polly,
mrs.,
because
this
is
the
primary
services,
so
I
exclude
sort
of
services
that
aren't
user.
Placing
from
this
dashboard
but
I
guess
the
best
thing
to
start
with
is
how
it's
how
it
started.
A
So
for
each
of
our
services
we
have
a
set
of
key
metrics
right,
and
so
it's
kind
of
a
combination.
There's
a
guy
called
Brendan
Gregg
he's
like
a
famous
observability
guy,
and
he
came
up
with
this
approach-
called
the
use
method,
which
is
mutilation,
saturation
and
errors
and
then
there's
another
guy
called
Tom.
A
Wookie
is
the
VP
product
at
Pavano
and
he
came
up
with
the
red
method,
which
is
requests,
errors,
durations
right
and
our
key
metrics
are
kind
of
a
combination
of
those
two
for
the
metrics
out
of
those
that
suit
our
workload
and
and
the
way
that
we
work
as
a
company.
So
it's
a
little
bit
of
both,
but
we
have
for
each.
We
trying
to
record
latency,
which
we
record
as
upticks
so
is.
This
is
the
service
running
within
reasonable
parameters
for
foster
children
and
we
have
like
an
error
rate
and
that's
always
a
rate.
A
It's
not,
there
were
50
errors
in
the
last
minute,
so
it's
always.
There
was
1%
errors
in
the
last
minute,
so
you
know
it's
it's
much
better
than
than
fixing
on
50,
because
we're
a
really
fast
growing
company
and
last
month's
50
might
seem
like
a
lot
and
this
month
with
growth,
50
small
and
so
it's
much
better
to
use
as
ratios
the
third
one
we
have
is
the
requests
per
second
for
every
service.
A
So
if
you
are
rid
of
you
might
have
you
know
a
hundred
thousand
requests
a
second,
not
a
hundred
thousand,
but
a
thousand
requests
a
second.
If
it's
the
web,
it
might
be
a
hundred
whatever
you
know,
those
those
are
bad
examples,
and
then
we
also
have
saturation
so
I'll
just
and
we
what
we've
been
what
I've
been
trying
to
do
is
is
put
these
metrics
in
place
for
every
one
of
our
for
every
one
of
our
services.
A
So
on
the
on
the
new
dashboards
that
we
have
been
building,
we'll
see
that
each
of
them
has
got
a
link
to
the
main
services
in
the
application
and
those
are
on
the
select
links
bar
up
here.
We've
got
API
CI
runners,
front-end,
that's
what
we
call
a
jade
proxy
giddily
monitoring,
which
is
Prometheus
and
Thanos
pages
obvious
for
training,
obvious
etc.
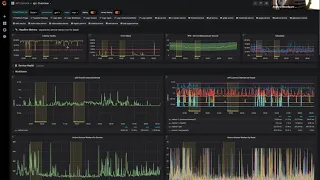
A
So
each
of
these
dashboards
kind
of
looks
the
same,
and
it's
kind
of
like
the
standard
dashboard
for
a
service,
and
so
the
first
thing
you'll
see
on
each
one
of
these
dashboards
that
you
go
to.
Is
this
headline
metrics
and
that's
your
service
metrics
right?
Yes,
your
key
service
metrics
and
what
I
was
saying
just
before
we
started
the
recording
was
that
either
Thanos
or
Prometheus
or
something
is
feeling
pretty
slow
this
morning.
A
B
A
It
actually
it's
actually
worse
than
that,
because
it'll
timeout
and
and
then
it
will
silently
timeout
so
it'll
give
you
the
data
that
it's
gods,
but
it
won't
give
you
the
data,
that's
missing
and
obviously
it
could
be
critical
data.
That's
missing
and
you
know
the
unaware
that
it's
missing
yeah,
it's
kind
of
like
you,
don't
know
what
you
don't
know
and
yeah.
A
We
get
this
kind
of
global
view,
but
what
we
continue
to
do
for
the
moment
is
is
evaluate
those
rules
at
the
Prometheus
level,
because
I'm
more
comfortable
with
so
it
was
actually
my
fault
because
I
had
that
set
to
30
days
from
my
previous
discussion.
So
a
live
demo
is
a
but
you
you
guys
I
set
this
to
12
hours
now,
and
so
here
this
is
the
the
API
service,
and
these
are
our
four
key
metrics
like
we
have
optics
arrow
ratios,
request
per
second
and
what
the
requests
per
second,
you
can
see.
A
We've
got
the
normal
boundary
and
that's
where
we
kind
of
expect
the
data
to
be
at
this
time
of
day
on
the
stairs
of
the
week,
and
so,
if
that
yellow
line
spikes
up
above
the
the
green
area,
then
there's
probably
something
weird
going
on
and
it
might
be
worth
investigating
and
then
we've
got
the
the
saturation
ejection.
So
these
saturation
metrics
are
not
directly
part
of
the
SLO
framework,
but
obviously,
if
you're,
if
you're
metric
become
saturated,
it
will
have
an
impact
on
your
errors
and
your
apdex.
A
B
A
A
A
Basically,
a
ratio
of
how
many
of
of
the
servers
that
are
supposed
to
be
able
processes
that
are
supposed
to
be
serving
the
registry
are
running
and
really
what
I
found
is
that
that
alone
isn't
a
very
useful
metric,
because
you
know
90%
could
be
running
and
everything
could
be
fine
and
you
don't
out
to
wait
for
that.
It's
only
when
it
gets
to
the
point
that
the
latency
satirising
or
the
error,
it's
surprising
that
it's
problem.
A
Oh
there's,
there's
also
another
really
important
document
that
I
should
link
in
the
in
the
notes
for
this,
which
is
there's
a
Google
Doc
called
my
philosophy
to
alerting
and
no
no
it's
it's
an
amazing
talk
and
it's
kind
of
like
the
way
that
everyone's
moving
they're
alerting
and
so
what
it
is
is.
It
makes
a
distinction
between
cause
based
alerts
and
symptom
behind.
A
B
B
A
A
A
Those
are
probably
the
three
main
ones
in
that
in
that
example,
and
they
work
together
right
and
so
to
come
up
with
an
error
ratio.
We
actually
some
all
of
those
things
together,
and
so
one
of
the
things
that
can
be
really
useful
is
to
go
look
at
the
components
of
so
each.
We
call
the
engine
X
the
workhorse
and
the
rails,
components
and
roll
together.
A
They
are
a
service,
and
so,
if
you
go
look
down
here,
you
can
see
what
the
components
of
the
registry
service
are
and
in
fact
with
the
registry
there's
any
one.
So
it's
just
the
the
process
not
very
exciting,
but
sometimes,
if
you
open
up
this
component
matrix
over
here,
you
can
get
some
interesting
information
about
which
component
is
erroring,
but
going
back
to
here.
So
this
is.
A
This
is
kind
of
a
good
example
in
a
bad
example,
because
what
you'll
see
here
this
is
our
metric
and
then
there's
these
two
different
dotted
lines
all
right.
The
the
lower
one
is
our
is
a
what
we
consider
a
degradation
like
the
service
is
not
great
its
degraded
and
then
the
upper
one
that
the
sort
of
dirtier
one
the
the
bolder
one
is
our
outage
rites.
And
so,
when
we
reach
that
level,
we
consider
that
we
actually,
this
should
be
a
knowledge
and
each
service
has
got
a
different,
different
SLO.
A
And
what
you'll
find
is
that
this
is
always
halfway
between
zero
and
your
Artic.
So
we
just
calculated
as
halfway
and
that's
when
you,
when
you
get
degraded.
So
in
fact,
we
only
specify
one
number
for
each
service
and
some
services
like
get
Lea
I.
Think
it's
0.1%,
because
we
see
very
low
error
rates
in
guinea,
but
then
for
some
services
like
sidekick,
it's
something
like
5%,
so
there's
a
very
big
variation
right.
A
B
A
The
registry,
so
this
can
kind
of
go
up
and
down,
and
and
nothing
will
happen,
lucking
will
happen
and,
and
we
need
to,
we
need
to
probably
just
put
one
on
here.
The
reason
we
don't
have.
This
is
kind
of
historical
we
didn't
have
Layton
sees
recorded
when
we
did
their
solos
and
since
then,
we've
got
Layton
season.
So
there's
a
bunch
of
reasons
why
it's
not
just
to
get
from
this
now.
A
Way
of
like
the
speed
at
which
the
error
rate
rises
and
how
high
it
goes,
you
know
because
you
can
have
slow
burn
errors
and
you
can
have
spiky
errors
and
they
have
different
thresholds
and
I
have
a
plan
or
how
we
can
implement
that
quite
quite
straightforwardly.
I'm.
Sorry,
that's
gonna
be
the
next
step,
but
at
the
moment
we've
got
the
static
line.
If
this
goes
above
that
we
get
an
alert,
let's
go
look
at
give
me.
A
A
So
that's
good,
but
the
the
updates,
that
is
to
say
the
number
of
requests
that
complete
within
an
acceptable
time
period
we
acceptable,
depends
on
the
request,
is,
is
below
you
know,
below
99%
I
think
that
yeah
it's
a
law
is
99
percent,
so
we
we
expect
that
one
percent
of
requests
take
longer
than
than
we
expect
them
to,
and
at
the
moment
it's
more
like
two
percent
of
requests
are
taking
longer
than
you
expect
them
to
you.
So
this
will.
A
Ad
genie
well
actually
look
at
it,
it's
very
spiky
and
we
have
to
it,
has
to
exceed
for
five
minutes.
In
order
for
us
to
get
that
alert
and
I
suspect
yeah,
you
can
see
what's
happening
here
is
kind
of
pulling
up
and
going
down
and
because
of
the
way
Prometheus
doesn't
hurt,
it
has
to
be
below
the
threshold
for
five
minutes
in
order
to
live,
so
we
may
not
have
got
an
alert
for
that
yet
anywho
this.
So
we've
tried
to
extend
this
across
each
component
in
the
in
the
application.
A
B
A
Could
say
that,
for
you
know
the
number
at
the
amount
of
time
so
here
this
is
kind
of
interesting
because
over
the
last
seven
days
and
so
pretty
much
most
of
the
new
dashboards
of
the
service,
elf
road
which
I
don't
have
been
buggy
for
because,
if
I
needed
all
the
time,
but
when
you
open
it,
you
can
see
that
this
latency
metric
is
meeting
its
its
objectives
about
72
percent
of
the
time,
no
time
right
and
on
giddily.
The
error
rates
is
actually
being
much
better
its
meeting
its
objectives,
ninety-eight
percent
of
the
time.
A
Really,
if,
when
you
combine
them,
what
you
get
is
kind
of
an
overall
view
of
a
ranking
of
all
the
services
in
the
system,
right
so
I
think
that's
the
best
way
to
look
at
it
like
this
service
is
meeting
its
its
objectives.
100%
of
the
time,
this
service
is
meeting
its
objectives
70%
of
the
time.
This
is
the
service
when
we
need
to
put
some
effort
in
obviously
that,
if
it
could
be,
you
know,
let's
review
our
objectives,
are
they
are
they
valid?
The
second
thing
is:
are
our
metrics
valid?
A
B
A
So
it
could
be
any
of
those
three
things.
Okay
would
expect
over
time
that
you
know,
as
we
iterate
on
this,
the
metrics
will
get
better
and
our
objectives
will
get
better
and
what
will
be
left
is
like
application
problems,
and
obviously
the
other
thing
is
that
this
gives
you
like
a
long-term
trend
right.
So
you
know
if
Diddley's
been
working
really
well
and
it
just
starts
decreasing.
We
will
see
that
in
this
graph,
so
going
back
to
the
can.
B
A
Okay,
so
this
one
over
here
we
look
over
there.
This
is
just
intended
to
be
like
the
small
quick
view.
So
when
you
open
up
the
dashboard
you
get
this
so
we'll
go
down
we'll
scroll
down
to
a
key
service
metrics
the
first
far
as
middle
icon-
and
you
can
see
here
on
the
saturation
that
the
matrix
that
is
alerting
on
here
is
called
single
node
CPU
component.
A
It
means
that
we
have
40
gdb
service,
41.7
and
we're
on
there,
and
most
of
those
kidney
servers
are
sitting
at
like
40
percent
or
30
percent
CPU
right,
but
one
of
them
is
sitting
at
93
percent
CPU
and
all
the
requests
that
are
going
to
that
giddily
server
are
getting
slowed
down
right,
so
it
is
saturated
and,
and
so
it
is
the
bottleneck
on
CPU.
So
what
we
do
is
we
look
at
the
average
CPU
for
each
computer
in
athletes
like
in
the
get
Lafitte's
in
this.
A
In
this
case,
and
we
say
what
is
out
of
all
the
averages,
what
is
the
worst
case-
and
here
you
can
see
it's
that
so
recently
what
I
did
was
because
you
always
need
to
drill
further.
This
is
just
like
a
headline
like
like
health
check,
I've
added
this
thing
called
saturation
details,
and
so
we
know
that
the
the
problem
here
is
single
node,
CPU.
A
A
B
B
B
So
basically,
I
already
I'll
try
to
translate
this,
in
other
words
in
if
I
get
it
wrong.
Correct
me,
basically,
the
fact
that
this
one
server
is
spiking
so
much
and
causing
some
so
many
issues
for
for
projects
that
are
on
that
chart
means
that
our
whole
little
e
service
on
all
nodes,
so
all
forty-something
is
being
I,
don't
know
degraded
as
as
the
overall
service.
So
that's
wrong.
B
Okay,
so,
basically,
if
we
have
a
healthy
service,
any
small
part
of
that
service,
any
component
of
that
service
can
actually
affect
it,
and
that
can
give
you
and
a
clear
overview
that
something
wrong
is
happening.
You
need
to
dig
deeper
rather
than
want.
Oh
I'm,
just
seeing
a
metric
something's
wrong.
No,
like
you
need
to
dig
deeper
for
sure
so.
A
I
mean-
and
the
other
thing
that's
worth
stating
right
is
like
people
could
say.
Well,
it's
only
request
on
that
server
and
oh,
we
could
just
take
get
lab
kits
and
move
it
to
so
get
lab,
get
level,
get
lab
and
move
it
to
its
own
server.
But
if
this
carries
on
that,
the
problem
is
that,
like
saturation,
like
obviously
often
leads
to
downstream
saturation.
So
if
you
have
a
lot
of
requests
that
are
all
hang
up
on
me,
git
server,
because
Gidley
server,
because
that
kiddie
server
is,
is
really
struggling.
A
Then
you
holding
onto
like
a
whole
bunch
of
unicorn
workers
upstream,
and
so
it
kind
of
it.
It's
like
a
bit
of
an
infection,
it
spreads,
and
so
it
will
affect
other
people
on
other
servers,
because
the
bottleneck
will
kind
of
back
up
backwards
and
the
the
analogy
that
I
always
like
to
use
is
like
sometimes
you're
driving
along
the
motorway
and
there's
like
a
little
road
on
the
side.
A
That's
congested
right
and
like
it
doesn't
really
matter
very
much,
but
all
the
cars
that
are
trying
to
get
off
on
that
off-ramp
are
kind
of
backing
up
and
therefore
they
backup
like
a
huge
motorway
because
of
one
downstream
resource
right
that
that's
that's
saturated,
that
the
road
and
and
so
it
kind
of
spreads
backwards
and
and
the
same
thing
happens
with
computer
traffic.
It's
a
bit
of
a
weird
analogy,
but
it
works.
For
me.
A
We
see
these
spikes
in
in
rock
throughputs
on
the
kid
elite,
and
the
problem
with
this
is
that
it's
very
useful
from
a
recording
point
of
view,
but
it's
a
little
bit
abstract,
like
people
are
like
what
does
that
mean,
and
and
now
that
I've
got
these-
that
are
these
detail
charts
down
here?
You
cancel
it
for
white
throughput
saturation.
A
And
you
can
see
that
this
is
happening
on
538
and
537
538,
so
it
gives
you
like
a
very
good
idea
of
where
the
problem
is
and
I'm
pretty
happy
with
it.
For
that,
and
these
these
charts
are
actually
reused
through
different
services.
So,
depending
on
what
saturation
metrics
a
service
is
constrained
by
you
know,
it'll
have
those
who
have
those
charts,
goofy
Megan.
A
We
don't
actually
think
in
me
on
this
and
I'll
explain
why
in
a
second,
but
you
know
for
each
of
those
services,
this
number
is
now
the
combined
amount
of
time
that
the
error
rate
is
above.
It
is
alone
and
the
latency
is
above
it
says,
on
the
right
and
so
sidekicks
terrible,
but
we
know
that
that's
a
data
problem,
kids,
is
also
not
bad
same
data
problem
and
then,
and
then
these
ones.
A
This
is
a
really
interesting
one,
because
we've
got
a
team
like
a
key
metric
for
the
company,
which
is
to
say
that
95%
of
CI
jobs
should
start
within
one
minute,
so
this
over
here
is
actually
based
on
on
CI
jobs,
starting
in
a
minute.
That's
our
latency
threshold,
so
forgivingly
we're
talking
about
milliseconds
and
for
CI
runners,
we're
talking
about
one
minutes
and
that's
what
I
really
like
about
ethics.
Is
you
can
scale
it
between
these
different
things
and
just
talk
about
a
percentage
like
what
percentage
is
meeting
a
threshold?
A
So
the
reason
why
this
is
only
good
sidekick,
get
CI
runners,
registry,
API
and
web
is
that
this
is
the
services
that
users
interact
with
right,
and
so,
if
we
did
a
really
good
job
at
architecting,
our
system,
which
is
obviously
the
direction
going,
you
could
have
like
a
ghibli
service
that
fails
and
and
has
all
sorts
of
problems.
But
if
it
doesn't
impact
the
user,
then
you
know
you
don't
hold
it
against
its.
A
It's
not
a
problem,
and
so
these
are
the
services
that
that
impact
users,
and
so
those
are
the
one
that
that
we
have
the
headline
figures
for,
and
you
know
we
expect
things
to
fail,
but
it's
just
that
that
failure
should
not
escalate
up
to
impact
users,
and
so
that's
why
we've
only
got
these
services
here.
But
you
know,
if
you
go
to
any
one
of
these
services
individually,
you
can
see
the
numbers
for
that
service.
I'm
scared
to
see
our
owners
cooking.
A
And
what
I
probably
do,
which
I
haven't
got
at
the
moment,
is
on
the
service.
Health
road
probably
include,
like
a
nice
long
term,
metric
like
over
the
last
three
weeks
for
the
for
the
error
rate
and
the
optics
individually,
and
you
can
see
and
if
they're
going
up
or
down,
because
we
are
sort
of
missing
that
opener.
So
you
know
here
this.
This
is
our
one
minute
like
how
many
CI
jobs
start
in
a
minute,
so
sit
pretty
much
said.
A
So
we
have
you
gonna,
continue
to
reiterate
on
that.
But
you
know
this
translates
it's
funny,
because
this
translates
exactly
to
what
the
the
the
mission
statement
was,
which
is
that
95
percent
of
jobs
start
in
a
minute,
and
so
your
app
tech
school
needs
to
be
95
percent
or
above
and
when
we
started
this.
A
A
Like
like
goal
of
all
of
these
is
like
every
so
often
just
ratchet
these
numbers
up
in
little
bits,
and
then
you
know
ratchet
them
a
little
bit
more
and
over
time
the
services
help
you
improve.
I
think
that's
all
the
things
that
I've
got
to
talk
to
I.
Don't
there's
anything
extra
that
you
want
me
to
show
or
if
you
have
any
questions.