►
From YouTube: Incident Management at GitLab Nov 2019
Description
No description was provided for this meeting.
If this is YOUR meeting, an easy way to fix this is to add a description to your video, wherever mtngs.io found it (probably YouTube).
A
Hi,
my
name's
Fernando
and
I'm,
a
technical
marketing
manager
here
at
get
lab
I'll,
be
introducing
incident
management
to
you,
so
incidents
can
lead
to
the
disruption
of
a
service
which
can
be
very
costly,
especially
if
there's
no
culture
on
managing
and
resolving
these
outages
quickly.
With
collapse
incident
management,
we
empower
DevOps
teams
by
automating
the
creation
of
rich
relevant
incidents
and
enable
collaboration
on
multiple
communication
platforms.
Let's
get
started,
this
is
a
project
configured
to
use
incident
management,
let's
go
to
the
operations,
tab
and
click
on
metrics.
A
Let's
sort
by
the
last
30
minutes
so
here
we
can
see
all
the
response
metrics
coming
from
the
nginx
ingress
pod
and
we
can
see
throughput.
We
can
see
latency
and
we
can
see
the
HTTP
error
rate
so
right
now
there
hasn't
been
any
errors
which
I've
occurred.
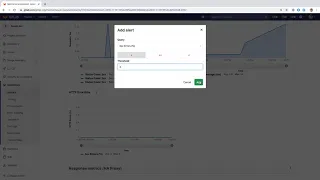
So
let's
go
ahead
and
add
an
alert
and
we
can
add
an
alert
on
500
errors
that
are
greater
than
3.
So
this
means
that
we'll
get
alerted
for
more
than
3%
500
errors.
A
After
merging
Emma,
we
can
see
that
the
error
rate
has
greatly
risen
to
a
hundred
percent.
Well
above
the
threshold,
this
generated
an
issue
which
we
can
see
here.
We
can
then
go
ahead
and
generate
a
link
to
this
chart
with
the
link
copied.
We
go
back
to
the
issue
and
we
can
paste
it
to
the
description.
This
is
useful
after
an
initial
triage
to
check
out
the
metrics
and
share
them
with
the
team.
This
will
generate
the
charts
within
the
issue.
A
A
If
we
go
back
to
the
issue,
we
can
see
that
our
comment
was
posted.
Now
that
you
know
how
alerts
work
how's
it
configured
into
a
project.
Well,
I
can
simply
be
done
by
clicking
on
settings
and
going
to
integrations
and
from
there
you
can
configure
your
alerts.
Endpoint
gillip
is
automatically
configured
to
receive
alerts
from
integrated
instances
of
Prometheus
alerts
can
also
be
set
up
from
any
source
using
the
alerts.
Rest
endpoint
on
the
same
integrations
page.