►
Description
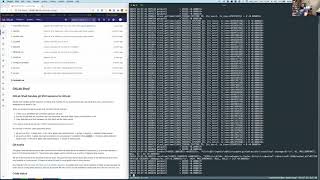
Walkthrough of what an strace of a typical request in Puma looks like, and a quick comparison on how Unicorn is different.
Part 1: https://www.youtube.com/watch?v=fcY5pPUq35U
Part 2: https://www.youtube.com/watch?v=tThs8QeP2qY
Part 4: https://www.youtube.com/watch?v=dgJH4wpR5OE
A
Hi,
everyone
welcome
to
another
s,
trace
video,
so
in
this
one
we're
going
to
get
into
using
s
trace
to
understand
what
unicorn
and
puma
and
rails
in
general
are
doing
when
a
request
comes
in.
So
let's
dive
in
okay.
So
here
we
have
a
13.2
instance
running
puma
and
if
we
just
look
at
yes
see,
we've
got
two
cluster
workers,
each
of
which
will
have
four
worker
threads.
That
can
each
handle
a
request
separately,
so
we
basically
have
eight
threads
total
that
can
take
a
request.
A
A
All
right
so
we're
going
to
follow
any
child
processes,
get
the
accurate
timestamp
capture
the
time
that
syscall
took
with
capital.
T
yy
is
printing
out
the
file
paths
we
capture
up
to
a
kilobyte
of
each
string
and
here's
your
output
file.
Okay,
so
we'll
kick
off
the
trace
and
we'll
pull
up
this
project,
that
is
on
local
storage,
all
right.
There
we
go,
and
so
we
can
see
we
actually
have
three
different
requests
that
came
out
from
the
performance
bar
here.
A
A
Actually
it's
listening
on
three
messages,
this
pipe
from
somewhere
that
might
be
from
its
parent
process
anyway,
so
gitlab.sockets
gonna
have
any
traffic
from
workhorse,
so
external
requests,
localhost
8080,
we'll
get
requests
from
gitlab
shell,
so
ssh
requests
that
come
in
and
some
guilty
requests
as
well.
Will
fire
off
internal
api
calls
to
make
sure
that
they're
allowed
to
do
whatever
the
request?
Is?
Okay?
So
that's
that's
just
it's!
It's
saying
either
look
for
external
requests
or
look
for
internal
requests,
whichever
one
comes
in
first
with
that
select
okay.
A
A
Here's
the
encoding
we
accept
and
so
on.
You
can
see
that
bar
enables
you
right
there,
okay
and
then
so
it's
a
total
of
16k
roughly
of
data,
so
we
only
get
the
first
k
of
that.
So
we
can't
see
the
full
request
there.
We
could
use
the
browser
tools
if
we
really
cared
about
that.
Okay,
so
unicorn
and
puma
are
essentially
single
threaded
within
the
context
of
a
given
request.
That's
not
entirely
true,
but
it's
true
enough
for
our
purposes.
A
A
Yeah,
okay,
so
two
two
three
okay
yeah,
so
there's
the
parent
process,
which
is
cluster
worker
one
here,
okay,
so
that's
one
of
the
threads,
not
the
the
lead
thread,
which
is
the
pid
in
ps,
okay,
and
so
actually
here
you
can
see
these
get
pid
calls
right
here.
This
is
saying:
what's
the
actual
process
id
here,
so
this
is
the
actual
thing
that
you
see
in
ps,
like
we
just
saw.
A
Okay,
true
text
is
just
synchronizing
with
other
threads
there's
a
little
skip
over
most
of
this
and
just
gets
the
interesting
parts.
So
the
first
thing
we
do
before
anything
else
happens.
Is
we
write
out
to
production.log
that
we're
starting
this
request
clock
get
time,
we'll
see
a
lot
with
puma
and
unicorn?
A
So
typically,
what
that
means
is
that
something
in
the
background
is
happening,
and
so,
when
you
see
a
long
string
of
clock
get
times,
that's
just
we're
doing
some
kind
of
processing
in
user
land,
and
we
just
need
to
know
what
time
it
is.
So
it's
really
just
we're
not
accessing
the
kernel
at
all
other
than
just
get
the
time.
So
when
you
see
a
lot
of
those
it's
kind
of
idle
within
in
terms
of
kernel,
not
in
terms
of
the
actual
worker,
it's
doing
it's
doing
something.
A
A
Okay,
so
here
we're
starting
to
query
the
database.
This
is
a
local
postgres,
so
it's
over
a
unix
socket.
If
it
were
an
external
postgres
it'd
be
over
tcp.
It
may
or
may
not
be
encrypted
at
that
point,
which
would
make
it
hard
to
read,
but
conveniently
with
local
it's
not
encrypted.
So
you
can
see
that
we're
actually
sending
select
to
postgres
and
we're
getting
back
something
it
doesn't.
We
haven't
actually
made
a
real
query
there.
As
far
as
I
can
tell
so
here
we
go.
A
A
A
A
A
A
A
A
A
A
A
A
A
A
Checking
it's
doing
something
that
we
can't
see
in
s
trace
right,
because
stress
is
only
showing
us
what
happens
when
we
reach
out
to
the
world,
and
this
is
all
internal
processing.
So
it's
it's
got
some
value
back
from
redis
and
some
value
back
from
the
database
and
it's
trying
to
decide.
You
know
what
to
do
next
or
maybe
rendering
I'm
not
rendering
yet,
okay,
more
redis
queries.
A
We
set
some
options
on
the
socket,
and
here
we
try
to
connect
to
that
same
ip
address.
We
saw
above
for
udp,
but
with
tcp
and
an
ipv6
format
once
again,
port
8075,
which
is
how
we
we
know
this
is
actually
gitly
all
right.
So
we
connect
and
now
we're
e-pulling
here.
So
we
try
to
connect.
It
comes
back
and
says
we're
working
on
it.
So
here
we
create
an
e-poll
on
that
which
is
basically
saying.
A
A
A
A
And
it's
all
binary.
I
think
this
is
just
setting
up
the
connection
in
the
first
place.
So
when
I
said
at
the
start
of
the
video
that
unicorn
and
puma
are
single
threaded,
that's
were
reached.
The
work
isn't
enclosed
entirely
in
a
single.
You
know,
threat
of
execution.
That
is
this
is
where
it
actually
is
not
quite
true,
so
you
will
see
the
gilly
requests
go
out
on
the
main
thread
or
process
depending
on
which
boom
or
earth
guillotine,
but
then
there
are
on
both
of
them
listener.
A
A
A
A
A
A
A
Here's
the
name
of
the
project
which
we
can
see.
That
should
be
it,
so
we
send
that
yeah.
Okay,
so
here
we
go.
This
is
what
I
was
talking
about.
So
on
202
243.
We
send
that
and
then
milliseconds
later
we
start
clearing
the
database
without
seemingly
never
getting
a
response
back.
But
let's
see
if
another
thread
got
it
back,
yeah,
okay,
so
20833
did
receive
a
message
back
and
it's
binary.
We
can't
really
understand
it.
A
That's
just
the
header
actually
and
then
down
here
we
get
the
full,
the
full
data
back,
okay,
so
yeah!
So
that's
those
that's
what
I
was
saying,
but
so
there's
this
this
child
thread.
That's
just
handling
gilly
requests.
Essentially,
so
let's
go
back
to
the
main
thread
now,
all
right.
Can
you
see
if
we
have
any
project
mirrors
which
are
not
notification
settings
so
things
to
keep
in
mind?
A
You
want
to
just
look
at
the
time
stamps
here
and
what
you're
looking
for
are
big
jumps,
so
keep
in
mind
that
most
syscalls
are
really
fast,
and
so
it
doesn't
really
matter
if
you
see
ten
thousand
lines
of
a
fastest
call
right
after
the
other,
because
that's
not
a
big
impact.
A
lot
of
the
times
we're
looking
for
is
one
request
that
took
five
seconds,
for
example.
A
A
A
Some
more
reduced
queries
so
things
that
we
that
can
commonly
cause
problems
that
are
not
immediately
obvious,
slow,
ldap
sync.
So
if
we're
waiting
on
dns
to
get
your
ldap
server
or
the
ldap
server
is
taking
a
long
time
to
get
back
to
you,
you're
not
going
to
see
that
in
the
logs
anywhere.
So
that's
something
that
s
trace
is
useful
for
and
you
can
actually
see
that
we're
getting
getting
a
dns
entry
for
ldap
we're
calling
out
to
that.
It's
taking
five
seconds
to
respond
and
that's
what
makes
everything
slow.
A
A
So
it's
not
going
to
be
hard
to
understand
those,
and
I
wouldn't
use
s
trace
in
general
on
those
unless
you're
trying
to
understand
something
very
specific
about
what
we're
getting
stuck
on
and
even
then
assuming
the
page
is
loading.
You
can
use
perfbar
to
really
dig
into
what's
taking
a
long
time
and
where
it's
coming
from.
A
A
A
A
A
A
A
A
A
One
thing
one
thing
to
note
is
that
we
do
log
before
we
write
the
response,
so
it
is
every
now
and
then
possible
that
we've
logged
that
were
successful,
even
though
the
request
actually
fails.
This
happens
a
lot
when
workhorse
drops
the
connection.
So
what
will
happen
is
a
client
makes
a
connection
goes
to
workhorse
workhorse
forwards
down
to
unicorn
or
puma.
Puma
starts
the
work,
but
then
the
client
drops
the
connection.
Workhorse
then
drops
the
connection
to
get
that
socket
as
well.
So
unicorn
will
do
all
the
work.
A
Loga,
200
or
puma
logo
200
write
it
out
to
the
socket
and
then
fail
to
write
it
because
sockets
already
been
closed.
So,
in
that
case,
you've
got
three
different
response:
codes
being
logged
there,
nginx
will
log
4.99,
because
the
client
hung
up
workforce
will
log
a
502,
because
you
know
the
puma
didn't
respond
in
time
and
then
puma
itself
will
logger
200,
because,
as
far
as
it
knows,
it
succeeded
until
it
actually
tried
to
write
the
response.
A
So
that's
a
little
confusing
and
something
that
happens
fairly,
often
just
to
be
aware
of
okay,
so
that
is
again
the
the
basic
life
cycle
of
request.
Let's
actually
go
back
up
to
the
start
here,
find
that
okay,
so
with
puma
the
the
process
that
gets
the
request
in
is
usually
not
the
one
that
actually
does
all
the
work.
A
A
Yeah,
so
we've
got
two
two
four
six
and
then
two
two
four
three
so
two
or
two
four
three
doesn't
work,
but
two
or
two
four
six
actually
took
in
their
request.
You
can
see
these
are
both
threads
for
the
same
process.
So
we
basically
have.
Is
you
have
one
thread
that
just
listens
on
the
socket
and
then
accepts
the
request
as
it
comes
in,
but
it
won't
the
pid
that
accepts
the
request,
will
not
be
the
one
that
actually
does
the
work.
A
So
then
you'll
see
a
different
pid,
do
a
receive
from
and
actually
read
in
the
the
details
of
the
request
over
the
socket.
So
that's
what
you're
seeing
here
20246
says
it
actually
responds
with
the
initial
response
and
then
20243
does
the
actual
work
and
sends
back
the
the
full
response
at
the
end.
Okay,
let's
briefly
go
over
the
differences
with
unicorn,
which
are
not
very
great,
we'll
just
go
over
that
same
thing.
We
just
went
over
with
unicorn
real
quick
and
what
is
it
enable
water
enabled?
I
can't
remember
enable
okay.
A
And,
let's
load
the
page,
yeah
five,
two
all
right
I'll
give
unicorn
30
seconds
to
come
up.
I
know
this
is
the
best
part
waiting
here
for
this
to
come
up,
but
we'll
be
basically
done
once
that
comes
up.
So
if
you're,
not
interested
in
unicorn,
then
feel
free
to
stop
the
video
all
right
great.
It's
up.
A
A
5628
is
the
same
process
that
both
accepts
and
actually
does
all
the
work.
So
so,
like
you
mentioned
at
the
start
of
video,
puma
has
multiple
threads
per
process
and
each
one
of
those
threads
can
handle
an
image,
will
request.
Unicorn
each
process
is
kind
of
an
island.
You
know
it
isn't
one
one
main
thread
within
it,
which
is
the
work
you
know
with
the
inception,
with
the
notable
exception
of
the
grpc
list
and
threads,
but
other
than
that.
A
A
Right
now,
unicorn,
and
then,
if
we
look
here
this,
the
process
id
and
mps
actually
matches
what
we
see
in
s
trace,
because
it's
the
main
the
main
thread
within
the
process.
That's
doing
all
the
work.
Okay,
so
that's
that's
the
only
real
difference
between
puma
unicorn
other
than
that.
All
the
work
you
see
within
the
s
trace
is
going
to
be
the
same
yep.
So
that
is
a
quick
summary
of
what
you
can
see
in
a
typical
rails.
Request
great
all
right
next
time,
we'll
go
over
kitty,
which
will
be
interesting
thanks.