►
From YouTube: Using Strace to Understand GitLab - Part 1: Intro
Description
Start of a series describing how to use Strace to understand how programs work internally.
0:00 Intro
0:28 What is strace
1:50 When not to use strace
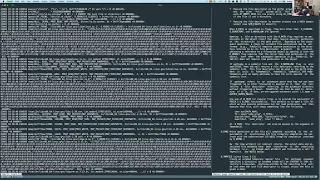
3:08 Tracing 'ls -la'
5:25 execve
7:33 open
9:00 stat
9:48 mmap
14:18 mprotect
21:05 Summary
Strace man page: https://man7.org/linux/man-pages/man1/strace.1.html
Brendan Gregg article on performance impacts of strace: http://www.brendangregg.com/blog/2014-05-11/strace-wow-much-syscall.html
Part 2: https://www.youtube.com/watch?v=tThs8QeP2qY
Part 3: https://www.youtube.com/watch?v=J-GkU7Mmqy4
Part 4: https://www.youtube.com/watch?v=dgJH4wpR5OE
A
Hi
everyone,
so
I
wanted
to
make
a
series
of
videos
about
you,
know
s
trace
and
how
to
use
it
to
understand
gitlab
and
related
programs.
So
this
will
be
the
first
video
and
we'll
talk
about
you
know:
what
is
s
trace?
What
does
it
actually
do
when
to
use
it
when
not
to
use
it
and
then
we'll
go
through
a
really
simple
program
in
using
s
trees,
to
understand
what
it's
doing
so
so
what
is
s
trace
s
trace?
A
Is
a
linux
utility
that
will
allow
you
to
see
the
system
calls
made
by
a
given
application
into
the
kernel.
So
system
calls
are
the
api
the
kernel
provides
to
programs
linux
in
this
case
to
to
access
resources
that
the
kernel
controls
so
opening
files
sending
network
traffic
things
things
of
that
nature.
Io
is
the
most
common
thing
that
we
care
about,
but
you
know
it
does
a
lot
more
than
that,
and
so
it
what
that
does
it
kind
of
helps?
A
You
understand
the
internals
of
a
program,
you
know
what
is
it
actually
doing?
It
gives
you
the
ground
truth.
Instead
of
looking
at
logs
and
hoping
the
logs
are
verbose
enough,
maybe
they
aren't
and
it
just
lets
you
kind
of
peer
inside.
So
unlike
a
tool
like
gdb
or
perf,
it
doesn't
actually
show
you
the
code
right.
So
it's
just
giving
you
kind
of
the
shadow
of
the
program.
A
A
A
A
It
might
be
400
times
slower
I'll
link
to
an
article
by
brennan
greg
in
the
description
that
talks
about
the
overhead
s
trace
puts
so
I
use
s
trace
mostly
on
my
own
instance
just
to
try
to
understand
how
a
program
is
working
and
what
are
we
doing
in
the
scenario
and
then
in
more
rare
situations
on
a
customer's
instance.
We'll
have
to
use
it,
but
we
try
to
avoid
that
whenever
possible,
just
because
it
has
such
a
significant
performance
impact,
you
don't
want
to
leave
it
running
for
any
more
than
a
few
seconds.
A
If
you
can
avoid
it,
and
then
you
almost
never
want
to
run
in
a
healthy
instance
because
it
causes
so
much
load.
One
other
thing
to
keep
in
mind
with
s
trace
is
that
occasionally
it
will
get
stuck
after
you
exit
it.
So
you
can
control
c.
You
return
to
your
terminal,
you
think
you're
done,
but
it's
actually
still
running
in
the
background
slightly
down.
A
So
if
you're
running
it
in
any
kind
of
environment,
you
care
about
always
check
in
ps
to
make
sure
that
it
actually
exited,
because
if
it
doesn't
you'll
cause
an
outage
and
that's
bad.
Okay,
all
right!
Let
me
share
my
screen
and
we'll
go
through
a
quick
example
of
just
seeing
what
it
looks
like
to
s
trace
ellis
so
on
the
right
here.
A
A
There
we
go
here,
it
is
so.
This
is
saying
that
as
a
as
a
given
process
is
being
traced,
if
it
forks
or
clones,
any
new
child
processes
trace
those
as
well
and
then
we'll
do
dash
tt,
and
this
is
saying
when
we
write
the
timestamps
for
a
given
event,
log
it
with
millisecond
precision
we'll
do
dash
capital
t,
which
is
saying
log
how
long
it's
taking
for
a
given
assist.
Call
to
complete
this
is
useful.
A
A
A
Okay,
so
the
first
thing
we
see
here
is
that
we've
run
executive
e
and
this
this
call
just
executes
program.
So
we've
got
here's.
The
actual
binary
executed
here
are
the
arguments
of
the
head
so
ls,
which
we
converted
into
bin
ls
and
then
the
flags
la
okay
and
then
over.
Here
you
see,
we
have
22
vars,
that's
22,
environment
variables.
A
You
can
do
the
dash
capital
e
flag
in
s
trace
to
print
the
environment
variables,
that's
usually
not
necessary,
but
can
sometimes
be
interesting,
something
to
keep
in
mind,
okay
and
just
to
go
through
the
rest
of
the
first
line
here.
So
this
is
the
process
id
or
pid
in
later
videos
we'll
see
that
this
is
actually
the
thread
id
or
the
it's.
The
idea
of
the
thread
which
is
pid
and
within
linux,
and
then
there's
the
thread
group
id
which
you
actually
see
in
in
ps.
A
But
for
now
this
is
just
the
process
id
and
then
over.
Here
we
have
the
timestamp
with
microsecond
precision
syscall
arguments.
Is
this
call
and
then
here's
the
return
code
so
return
0
success
and
it
took
115
microseconds
to
complete
so
pretty
fast,
even
with
s
trace,
throwing
everything
down
all
right.
So
then,
on
the
next
line.
So
next
we
do
a
brk
which
can
be
used
to
extend
your
heap,
but
in
this
case
it's
just
we're
passing
in
a
null
argument
here.
A
So
what
we're
saying
is
tell
me,
tell
me
where
my
heap
ends
right
now.
I
just
need
to
understand
what
my
address
space
is,
and
so
this
is
just
a
quick
way
for
the
program
as
it
boots
up
to
understand
what
what
its
resources
are.
So
in
this
case
the
kernel
comes
back
and
says:
okay,
here's
the
end
of
your
heap.
A
So
then,
if
I
wanted
to
add
additional
memory
to
a
teep,
we
could
just
call
brk
with
a
number
higher
than
this,
and
this
took
four
microseconds,
so
very
fast,
okay,
and
so
then
we
do
an
access
which
is
just
saying.
Am
I
allowed
to
access
this
file,
and
here
we
have
the
path
at
cld.sl.preload
and
that
comes
back
and
says
this
path
doesn't
exist,
and
so
then
we
do
open
it,
which
is
opening
a
file
and
getting
a
file
handle
back.
A
Actually,
let's
look
at
the
arguments
here
so
the
first
argument
is
this
ft
cwd
and
then
we
have
the
actual
path
we
want
to
open
up
and
then
here
we're
saying,
read
only
and
close
on
exec
and
then
so.
Let's
talk
about
what
this
first
argument
is,
so
you
can
see
here
on
the
man
page
that
says
inch
drfd,
so
that
could
be.
A
So
that's
just
saying:
if
it's
for
relative
path
use
the
current
directory
for
that
open.
Does
that
by
default,
but
open
that,
let's
give
you
a
little
more
precise
okay,
so
I
open
that
and
then
we
get
a
return
code
of
three
and
s.
Trace
has
conveniently
converted
that
or
decoded
it
next
to
it
to
say:
hey
that
fd3
is
scld
the
sso.cache,
and
this
took
six
microseconds
so
very
fast,
again,
okay
and
then
we
do
an
fstat
which
let
me
pull
the
manpage
for
that.
A
So
f,
stat!
Actually
we'll
just
look
here.
So
if
you
see
the
arguments
first,
we
pass
in
the
file
descriptor
and
then
the
stat
struct,
but
we
don't
care
about
the
struct
really
yeah,
let's
see
f-stat
okay
f
says
identical
to,
except
that
it
takes
a
file
descriptor
instead
of
a
path.
So
basically
we've
gotten
this
file.
A
All
right
now
onto
mmap,
which
is
one
of
the
more
important
syscalls
that
we'll
see,
so
I
can
kind
of
be
used
in
two
ways.
The
first
is
to
map
a
file
into
the
address
space
of
the
program.
So,
instead
of
having
to
do
explicit
calls
to
the
kernel
to
read
another
thousand
bytes,
you
can
just
it
will
page
it
in
in
the
background,
and
so
you
won't
need
to
make
any
more
explicit
calls
out
which
is
more
efficient.
A
The
downside
for
us
is
that,
when
we're
s
tracing,
we
can't
see
any
reads
that
are
done
on
this
file
in
s
trace
because
it's
no
longer
hidden
in
the
kernel
directly
anyway.
So
what
we
see
here
is
not
this
first
address
or
the
first
argument
here
is
an
address
we're
saying
null,
so
we
don't
care
and
we're
saying
30
390
bytes,
which
is
the
size
of
this
file,
and
then
we're
saying
we
want
to
be
read
only,
and
this
is
going
to
be
private
to
this
process.
A
A
So
if
we
do
an
ldd
on
ls,
we
can
see
all
the
dynamic
library
or
libraries
that
are
being
dynamically
linked
into
it.
The
shared
libraries
so
sc
linux
we
have
lib
c,
the
pcre
and
so
on-
are
all
linked
into
into
ls
and
we'll
see
that
in
the
stress
here
in
a
second
okay.
So
we
open
up
this
library.
It
is
now
the
new
file
descriptor
three,
since
we
close
the
old
one.
A
Let
me
read
it
so,
unlike
the
previous
one,
we
actually
read
the
contents
here
a
bit,
and
so
you
can
see
this
this
header
here
where
it's
byte,
177
elf.
So
aside
here,
so
this
these
backslash,
followed
by
numbers,
are
those
are
non-printable,
ascii
characters,
and
so
you
can
see
if
it's
a
non-printable
character,
then
we
print
it
in
this
format.
If
it
is
printable,
then
we'll
print,
it
actually
print
the
actual
contents
here.
A
A
And
we
get
back
the
full
size
here
and
then
this
is
the
other
use
of
mmap
that
I
mentioned
where
it
can
also.
Actually
I
mentioned
it,
but
I
didn't
actually
tell
you
what
it
was
where
you
can
use
it
to
allocate
memory
for
yourself
without
having
a
file
backing,
so
it's
just
extra
memory
to
write
into
so.
In
this
case
we
don't
have
an
address.
A
A
A
A
A
We
f-stat
it
and
map
it,
protect
it
once
again,
read-only
or
sorry
not
even
readable,
for
this
first
large
chunk
and
map
some
more
and
then
close
out,
and
then
we
continue
with
the
next
shared
library.
So
the
pcr
three,
and
so
this
pattern
continues
through
each
of
the
shared
libraries
that
we
saw
from
ldd.
So
we'll
just
go
through
that
real
quick
so
that
we've
seen
the
basic
pattern
with
the
first
one.
A
Maps
and
close
it
out,
rgp
or
ctl
is
not
something
that
is
particularly
relevant
to
us,
but
just
skipped
by
that
and
protect
here.
We're
setting
a
large
chunks
of
memory,
not
large
chunks,
but
some
sets
of
memory
to
be
read
only
and
then
we're
freeing
or
unmapping
a
section
memory.
So
if
we
look
at
this
address
here,.
A
Okay,
set
to
address
and
set
robot
list
are
not
usually
relevant
to
us,
we'll
skip
by
those
rtc
action.
We
don't
really
care
about
what
it
does,
but
it's
useful
to
understand
what
it
where
we
see
it.
So
we'll
see
that,
typically,
at
the
start
of
a
new
process
so
like
particularly
with
git
when
it's
first
loading,
it'll
it'll,
run
rtc
connection
for
all
the
signals
and
say
when
I
receive
signal
x.
This
is
what
I
want
to.
A
A
A
So
we
start
opening
up
lacao
files,
which
makes
sense
since
we
have
to
print
out
to
the
console,
and
we
need
to
know
what
language
to
do
that
in
for
the
first
two
files
on
a
test,
but
we
do
find
the
lc
identification,
so
we
open
it
f-stat
it
and
map
it
close.
It
same
pattern.
We
saw
with
the
shared
library
and
let
me
go
ahead
and
proceed
to
do
the
rest.
Do
that
with
a
whole
bunch
of
locale
files.
A
A
Excuse
me,
and
so
we
do,
that
we
f-stat
it
and
then
we
we
run
get
dead
ends
so
we're
getting
the
director
entities
so
the
files
associated
with
this
directory-
and
it
comes
back.
We
get
three
entries
back,
which
makes
sense
so
the
current
directory,
the
parent
directory
and
the
example
or
dot
get
directory
within
there.
Okay
and
then
we
get
the
ascended
attributes,
which
is
not
something
we
normally
see.
It's
kind
of
an
ls
thing,
which
makes
sense
we
try
to
create
the
socket
here,
creates
a
socket
file.
A
So
you
can
see,
we've
got
a
new
file
handle
back,
you
can
file,
handle
four
and
then
we're
trying
to
connect
to
this
ncsd
socket
not
really
relevant
to
us,
but
we
will
see
sockets
when
we
see
some
more
networking
so
just
keep
that
in
the
back
of
your
mind.
So
we
can
skip
past
all
this
nss
switch
stuff,
not
really
relevant.
A
A
A
See
if
there's
any
more
directs,
there
are
none.
So
we
get
back
a
zero
on
that
read
in
our
final
locale
messages,
and
then
we
check
standard
out
here,
which
is
fd1,
which
we
can
see
is
a
pseudo
terminal.
Pts
see
the
terminal
0
in
this
case,
and
then
we
write
out
the
first
line
of
the
output.
We
saw
total
12,
so
we're
right
here.
A
Okay
and
then
we
check
our
time,
which
we'll
need
for
the
sorry
time
zone
which
we'll
need
to
print
out
the
times
for
the
files
that
we
found
and
let
me
write
out
the
remainder
of
the
lines
that
we
see
in
the
terminal
and
then
at
that
point
once
you've
written
all
that
out,
we
close
standard
out,
we
close
standard
error
and
then
we
exit
with
zero
here
and
you
can
see
that
we
did
indeed
x.
It
was
zero
in
the
final
line
of
that
trace.
A
A
You
know,
but
if
you
look
at
the
actual
amount
of
time
spent,
so
we
started
at
18
18
49.633,
we
ended
18
18
49.641,
so
we
spent
about
eight
milliseconds
or
so
for
all
that.
For
all
that
to
happen,
and
that's
with
this
trace,
throwing
things
down,
you
know
10
or
20
or
50
times
from
normal
speed.
So
ls
is
fast.
Computers
are
fast,
even
though
they're.
You
know
this
is
kind
of
a
wall
of
text.
A
A
Okay,
so
that
I
think,
is
a
good
place
to
stop
for
the
first
video.
So
that's
that's
kind
of
what
s
trace
is
and
a
quick
example
of
a
simple
program.
We
won't
go
into
that
much
detail
with
the
syscalls
in
future
videos.
This
is
just
kind
of
an
intro,
but
we'll
go
over
in
the
next
one.
A
couple
of
examples
we'll
get
and
then
we'll
look
at
s,
tracing
puba
and
unicorn
within
git
lab
and
the
last
video
will
be
giddly
and
how
that
interacts
with
all
different
pieces.