►
From YouTube: GitLab CI/CD - Cloud Native Build Logs feature overview
Description
Grzegorz explains how Cloud Native Build Logs feature works and how the production rollout looked like.
A
A
A
So
the
first
problem
with
a
traditional
build
logs
was
that
we
were
storing
them
on
disk.
So
the
diagram
here
is
a
simplification
of
our
infrastructure
or
almost
any
cloud
native
infrastructure.
So
in
the
front
we
do
have
a
load
balancer.
Then
we
usually
do
have
a
couple
of
nodes
that
are
horizontally
scalable
in
the
cloud
and
that's
you
know
very
a
simple
explanation
of
how
a
cloud
native
application
might
look
like
in
case
of
build
logs.
A
The
same
file
needs
to
be
available
for
every
node,
because
in
in
case
of
all
the
other
nodes
being
overloaded,
for
example,
load
balancer
might
choose
to
direct
the
request
to
node
one
and
it
needs
to
have
access
to
build
log
number
one
right
in
the
next
request.
When
someone
hits
a
refresh
button
in
their
browser,
they
might
be
directed
to
node,
2
and
node.
2
needs
to
have
the
same
access
to
the
same,
build
one
lock
right
and
then
we
of
course
do
have
many
build
logs.
A
Currently
on
github.com,
the
number
is
very
high,
so
we
in
in
the
past
we
had
been
storing
all
of
them
on
nfs
on
the
on
the
builds
mount
point
and
the
same
mount
point
had
to
be
mounted
on
every
node
that
the
user
might
connect
to
depending
on
where
the
load
balancer
is
going
to
direct
them
and
it
it
has
been
had
been
serving
us
very
well.
It
was
like
quite
efficient
mechanism,
especially
when
you
are
appending
data
to
a
build
log
on
nfs
or
any
other
block
storage.
A
There
is
some
caching
caching
buffering
involved
that
makes
it
quite
efficient,
but
it's
very
difficult
to
actually
do
that
on
kubernetes,
because
in
this
particular
case
we
do
have
three
nodes
described
on
the
diagram,
but
kubernetes
works
a
little
bit
differently.
Kubernetes
is
very
efficient
when
it's
balancing
small
containers-
these
are
small
virtual
machines
or
you
know
it's
much
more
efficient
for
kubernetes
to
move
them
around
when
they
are
small
in
case
of
the
current
architecture.
Web
nodes
are
quite
weak.
A
So
you
can
imagine
that
we
would
need
to
mount
nfs
chart
on
every
in
every
pot.
We
might
have
thousands
of
them
the
more
mount
points
you
have
the
more
difficult
it
is
for
nfs
to
manage
the
content
on
all
of
them,
so
it
might
be
very
inefficient
and
there
are
many
more
problems
with
nfs
in
kubernetes
long
story
short.
A
So
you
can
see
that
we
experienced
data
loss
in
april.
Then
we
experienced
data
loss
again
in
july
right
and
then
we
experienced
out
of
memory
outage
in
october,
so
it
was
quite
difficult
to
roll
this
feature
out
on
gitlab.com.
But
before
I
explain
you
more
about
how
we
approach
the
rollout,
I
would
like
to
explain
how
the
future
works.
So
if
we
are
not
storing
data
to
nfs,
where
are
we
storing
data,
so
we
decided
to
actually
store
data
in
reddis.
A
So
this
is
this.
This
kind
of
mechanism
where
we
are
using
postgresql
to
track
reddish
data
so
for
every
portion
of
a
build
log
we
stored
in
red
ease.
We
do
have
a
corresponding
entry
in
the
postgresql
that
ways
that
allows
us
to
track.
This
data
understand
where
it
is
what
amount
of
data
it
contains
when
to
actually
move
it
to
object,
storage,
to
avoid
inflating
the
memory
of
radius.
A
So
this
is
like
a
very
short
explanation
of
how
it
works.
Whenever
a
runner
sends
a
new
partial
trace,
we
are
going
to
either
find
or
create
a
build
trace
chunk
in
the
database,
and
once
we
do
have
this
tracking
entry
in
the
postgresql
database,
we
are
going
to
know
what
the
key
of
that
particular
portion
of
data
is,
and
we
can
append
data
in
redis
in
order
to
make
it
performant.
A
A
This
feature
had
some
history
of
data
loss
right
and
build
logs
are
kind
of
mission,
critical
data,
because
it
these
are
almost
as
important
as
a
build
status.
Sometimes
people
do
depend
on
what's
written
in
that
build
log
right,
so
we
wanted
to
avoid
the
situation
where
we
were
losing
data,
and
not
even
knowing
about
that.
A
When
a
runner
sees
that
a
build
is
complete,
that
there
is
an
exit
status
that
we
know
what
the
status
is,
the
build
is
either
successful
or
not.
The
runner
is
going
to
send
this
information
gitlab.
The
moment
we
receive
this
information.
We
are
storing
it
in
a
database
in
a
build
pending
states
table
this.
A
This
is
a
pending
scale
state
because
we
are
not
changing
a
build
status,
yet
we
are
recording
what
runner
thinks
the
status
should
be
and
the
runner
is
also
sending
a
checksum
of
a
build
log
that
is
on
a
runner
machine
after
build
is
done.
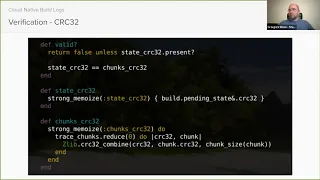
Runner
is
iterating
through
all
the
bytes
in
a
build
log
and
calculating
a
crc32
checksum
and
sending
it
to
gitlab.
A
We
store
it
in
a
pending
state,
a
a
ci
bill,
pending
state
table
and
and
then
after
we
migrate
all
the
trace
data
to
object
search.
We
can
calculate
a
checksum
of
each
individual
chunk
and
then
we
can
actually
compare
this
data
and
this
way
we
know
if
the
checks
matches
or
not.
If
it
doesn't,
then
we
can
actually
increment
a
metric
lock.
A
A
Then
you
know
the
verification
of
the
checksum
is
not
the
only
metric
we
have,
because
whenever
a
checksum
verification
fails,
we
are
logging,
this
invalid
trace
operation.
So
it
says
that
a
multi-form
built
race
has
been
detected
using
crc32,
but
you,
as
you
can
see,
we
we
do
have
much
more
matrix
whenever
a
new
trace
that
is
appended
to
a
chunk.
Chunking
readies.
We
also
increment
the
counter.
A
Whenever
runner
sends
partial
trace,
we
increment
the
promoting
with
counter
whenever
we
create
a
new
postgresql
row
that
is
tracking
this
redis
key
that
we
want
to
happen
to.
We
create
we
increment
from
use
counter
whenever
we
mutate
a
trace,
because
we
detect
secrets
that
shouldn't
be
there,
because
runners
somehow
was
unable
to
mask
them.
We
increment
the
prominent
use
counter
whenever
a
runner
requests
the
trace
override,
which
is
a
legacy
feature.
A
We
also
record
that
information
whenever
we
tell
runner
that
thanks
for
submitting
ci
bill
pending
state,
but
we
need
to
process
the
trace
migrate,
it
to
objects
or
do
something
with
it,
and
we
are
telling
runner
to
contact
us
again
in
a
few
seconds
from
now.
Whenever
this
happens,
we
also
increment
the
promotions
metric
whenever
all
the
build
times
all
the
trace
data
is
actually
persisted
in
the
object
storage
which
we
consider
to
be
a
safe
store
with
decent
durability.
A
We
increment
the
metric
whenever
we
detect
a
deadlock,
because
there
is
a
hyperlasement
concurrency
involved
in
build
blocks,
build
statuses
whenever
we
that
detect
a
lock
or
a
deadlock.
We
also
have
a
metric
for
this
now
when
we
are
unable
to
actually
migrate
data
to
object
storage
because
of
some
problems
with
object.
Search,
for
example,
object,
stored
performance
degradation.
We
also
do
increment
the
promoting
counter
and
it
is
all
visible
in
prompt
use
additional
metrics.
We
have
added
this,
for
example
the
trace
rate.
A
So
whenever
we
receive
a
partial
trace,
we
try
to
calculate
the
amount
of
bytes
sent
by
runner,
and
then
we
increment
the
promotions
counter
x
times
and
x,
equals
to
the
amount
of
bytes
in
a
lock.
So
this
way
we
can
go
to
the
promotions
and
see
the
bytes
per
second
rate
of
a
trace
flow,
and
then
we
also
measure
time
it
takes
to
move
data
from
radius
to
object,
storage
and
we
do
have
a
metric
called
immigration
duration
and
it's
actually
a
histogram.
A
So
we
can
see,
for
example,
99
percentile
of
requests
how
how
long
it
takes
to
actually
migrate
data
to
object,
storage.
So
there's
a
a
huge
amount
of
metrics
involved
and
we
do
record
them
on
the
back
end
and
then
we
can
access
all
of
them
in
promote
use.
We
do
not
have
grafana
dashboard
yet
for
things
like
that,
but
verify
profound
dashboard
is
on
my
radar
and
as
community
teams
working
on
this
I'm
going
to
work
on
this.
A
So
eventually
we
are
going
to
have
all
these
things
in
grafana,
so
engineers
and
sres
will
not
need
to
know
the
strange
prongql
query
with
all
the
labels
vectors
and
all
this
stuff.
Instead,
they
will
be
able
to
click
on
the
dashboard
and
see
recent
metrics
like
without
much
effort.
So
this
isn't,
you
can.
B
A
In
the
air,
I
think
most
of
them
are
thinking
not
all
of
them.
We
lock,
for
example,
locked
or
stalled
inside
kiku
when,
whenever
we
actually
schedule
a
worker,
that's
going
to
migrate
data
from
from
redis
to
object,
storage
right.
This
is
scheduled
by
the
request
to
up
and
traces
right,
but
it's
a
little
different.
B
Context
because
it
runs
in
yeah,
okay,
that
makes
sense
so
there's
a
there's,
an
endpoint
that
receives
the
payload
from
runner
and
a
lot
of
these
metrics
are
captured
there
and
then
there
is
a
probably
another
job
or
another
piece
of
code
that
interacts
with
sidekick.
That,
then,
does
the
batching
in
the
back.
A
So
yeah,
so
this
is
an
interesting
metric
because
it's
as
you
can
see
the
involved
label
and
that's
exactly
this
one
all
form
built
trace
has
been
detected
using
crc32
and
there
was
a
spike
here
and
it
was
a
quite
significant,
significant
increase
more
than
25
involved
built
logs
in
five
minutes
right.
So
I'm
not
sure
how
what's
like
the
time
span
in
here,
but
it
can
translate
to.
I
don't
know:
100
200
invaluable
logs
and
we
concluded
that
it's.
A
A
This
is
something
that
engineers
really
you
know
know
about.
That
replication,
like
might
be
problematic
when
you
are
writing
something
to
database,
but
when
you're
reading
something
in
front
of
the
base,
you
might
actually
be
reading
from
secondary,
and
that
does
not
have
recent
changes
in
there.
Of
course,
whenever
a
request
performs
a
right,
gitlab
will
prevent
prevent
your
code
from
reading
from
secondary
during
that
request,
but
like
it's,
not
that
simple,
but
it's
a
different
problem,
so
I'm
not
going
to
describe
it
anymore
now
so
yeah.
A
So
that's
the
involved
metric,
and
we
also
want
to
extend
this
metric
a
little
bit
and
build
alerting
based
on
that,
because
right
now
someone
needs
to
at
least
once
a
week
go
to
promote,
use
and
check
whether
we
are
seeing
invalid
logs
or
not.
There
is
no
other
way
to
actually
get
notified
about
that.
A
According
to
my
napkin
map,
we
do
have
around
30
60
minutes
before
total
outage
before
redis
reaches
like
consumes
all
the
memory
available
for
it
and
when
red
is
is
not
available.
It
basically
means
that
gitlab
is
not
working
at
all.
So
that's
a
complete
outage,
so
we
do
have
around
30
60
minutes
right
now.
In
case,
we
are
not
able
to
move
data
from
radius
to
object,
storage.
B
A
So
when
suddenly
we
are
going
to
write,
you
know
hundreds
of
megabytes
or
gigabytes
of
great,
but
that's
that's
a
different
story
as
well.
So
as
as
you
can
see,
when
we
exclude
the
label
operation
label
from
the
problem,
qrel
query,
we
can
see
much
more
data.
Of
course
there
is.
There
should
be
a
legend
below
that,
it's
not
on
a
screenshot,
but
every
color
like
corresponds
with
label.
A
A
When
data
suddenly
disappears
from
readys,
we
are
not
able
to
calculate
the
amount
of
data
we
have.
Runner
tries
to
append
something
to
a
build
log,
but
there
is
a
build
clock.
Content
mismatch
rather
things
that
we
should
have,
for
example,
first
100
bytes,
but
we
do
not
have
it
in
red
is
because
somehow
it
got
lost,
runner
is
able
to
recover
from
that.
A
Runner
is
going
to
rewind
and
send
the
missing
portion
of
data
again,
but
we
are
going
to
lock
this
exception
in
kibana,
and
this
is
a
very
interesting
case
because,
as
you
can
see,
we
added
additional
metadata.
In
this
case,
we
log
the
amount
of
chunks,
the
build
log
chunks
that
we
store
in
the
database.
That's
the
amount
of
possibly
square
procedure,
postgresql
tracking
countries.
A
A
A
So,
as
you
can
see,
this
particular
build
has
a
built
log
that
is
more
than
24
megabytes,
and
this
is
super
interesting
because
in
the
runner
we
do
have
a
limit
runner
shouldn't.
Allow
you
to
have
a
bigger,
build,
lockdown,
four
megabytes,
so
either
something
is
wrong
or
simply
this
is
an
unofficial
runner
and
we
know
that
we
do
have
a
bunch
of
unofficial
runners
connected
to
gitlab.
For
example,
there
is
a
community
runner
that
is,
that
behaves
better
in
kubernetes
environment.
A
We
know
that
a
bunch
of
customers
are
used
with
this
runner.
So
this
is
interesting
because
new
logging
allows
us
to
detect
problems
like
super
large
build
floor
right
this.
This
should
be
fixed
whatever,
so
then
the
rollout.
So
I
would
like
to
say
that
real
work
starts
the
moment.
You
deploy
code
production
right
and,
and
then
you
basically
discover
a
bunch
of
bugs
you
should
fix.
So
that's
the
reason
why
iteration
is
so
important
for
us
at
github.
A
You
can
spend
months
working
on
something,
but
until
you
deploy
this
to
production,
you
will
never
know
how
it
works,
how
it
behaves
and
then
it's
much
better
to
deploy
something
quickly
and
iterate
to
actually
move
forward
more
reasonably
within
a
decent
pace.
So
this
is
an
issue
about
the
rollout,
I'm
not
going
to
click
it
now,
but
you
can
look
at
look
at
the
issue
later
so
the
moment
we
deployed
all
the
mechanism,
verification
mechanism
and
improvements
to
gitlab.com.
A
As
you
can
see,
we
had
to
iterate
quickly
to
fix
all
the
problems.
For
example,
we
we
had
used
involved
label
in
the
build
trace
rate
metric,
so
it
was
not
working
well.
So
we
had
to
fix
that.
So
things
like
that,
you
cannot
predict
how
things
like
these
are
going
to
behave
until
you
deploy
production.
A
A
Yeah
and
that's
it-
I
guess
you
might
have
questions
so
it
was
like
an
overview
of
how
it
works,
what
we
have
done
to
actually
roll
it
out
successfully,
and
I
I
hope
that
it's
going
to
be
interesting
to
someone.
Perhaps
someone
would
like
to
start
working
on
cloud
native
bit
logs
because,
like
this
feature,
is
always
going
to
be
working
progress
like
everything
else,
we
need
to
maintain.
We
need
to
make
it
better,
so
I
will
be
happy
to
answer
all
the
questions
you
might
have.
A
A
A
A
A
So
I
was
wondering
why
it
why
it's
not
working
like.
Why
doesn't
it
work?
It
should
work
like
the
interface
matches.
What
the
ruby
client
exposes
here
so
then
I
found
out
that
we
are
actually
using
a
forked,
ruby,
client,
it's
a
github
maintained
gem
and,
as
as
you
can
see,
it's
quite
old
version
more
than
three
years
ago.
We
forked
it
and
that's
the
actually
that's
the
master.
A
So
that's
the
most
recent
version
when
we
are
using
and
as
you
can
as
you
can
see,
the
interface
is
totally
different
in
here,
so
previously
it
was
by
and
now
it
was
it
like.
In
this
case,
you
specify
labels
here
and
you
just
specify
the
amount
of
increments
on
the
second
projection
in
the
new
interface.
The
first
is
the
amount
of
increments,
and
the
second
is
labels.
A
You
know
so
this
way
we
introduced,
like
hundreds,
thousands
of
new
labels
in
in
the
prominent
use
and
promises
really
struggle
to
actually
process
this
amount
of
data.
So
it
was
very
interesting
bug
related,
commit
use
and
us
nudging
gems,
with
legacy
interfaces
that
are
not
very
comfortable
with
what
you
can
find
in
the
new.
B
A
B
A
And
the
most
interesting
bugs
the
more
difficult
to
fix,
where
bugs
are
related
to
concurrency
and
yeah.
It's
rather
changing
the
status
of
a
build
and
build
chunks
being
migrated
migrate
to
object,
storage
at
the
exactly
same
time
as
we
change
the
build
status
because,
as
I
told
you,
a
bunch
of
things
are
happening
in
the
background.
Asynchronously,
but
still
runner
is
communicating
through
the
api.
So
there
might
be
an
overlap
of
you
know
what
we
are
doing
in
the
background.
B
C
Do
you
think
it
is
kind
of
performance
intensive
to
have
such
amount
of
metrics
per
feature
on
promoters
like?
I
would
think
we
could.
We
probably
should
use
for,
like
in
general,
for
almost
all
the
features
that
we
we
we
implement
to
see
how
they
actually
perform
on
production
and
there's
a
lot
of
data
there.
That
is
just
not
the
end-to-end
time
of
the
worker
for
performing
this
action.
A
So
that's
that's
a
really
good
question
and
I
think,
like
the
answer
is
always
it
depends
right
in
this
particular
case.
We
know
that
incrementing
a
metric
is
really
cheap.
It's
in
in
whether
it's
being
done
in
google
or
in
room.
It's
just
a
matter
of
locking
threads
setting
a
mutex
incrementing,
something
in
the
memory,
and
then
it's
going
to
be
somehow
you
know
translated
into
a
prominent
use.
A
Endpoint
and
prompt
user
is
going
to
scrape
this
data,
so
parameters
is
very
efficient,
but
definitely
there
are
bottlenecks
and
I
think
it's
actually
something
that
sres
are
working
right
now,
because
we
do
have
a
lot
of
metrics,
it's
quite
difficult
to
aggregate
all
of
them.
We
do
have
a
lot
of
produce
instances.
A
There
is
this
project
called
tunnels
that
is
supposed
to
make
it
easier.
The
tunnels
is
a
project
that
aggregates
data
from
multiple
promoters
instances
and
tries
to
tries
to
merge
them
and
present
them
on
a
single
graph.
So
you
can
have
multiple
prominent
use.
What
makes
prominent
uses
what
makes
prompt
use
horizontally
scalable,
but
then
it's
also
kind
of
tricky.
A
When
you
have
to
retrieve
the
data
on
every
promote
use
and
note,
you
have
to
run
a
query:
thanos
is
going
to
collect
them,
merge
them
together
and
present
you
them
to
you
it's.
You
know
something
like
mapreduce
to
make
it
horizontal
horizontally
horizontally
scalable,
but
there
are
bottlenecks.
I
know
that
there
are
issues,
there's
an
issue
or
a
couple
of
issues
about
that.
A
But
sometimes
these
are
extremely
useful.
We
know
that
without
matrix
we
we
wouldn't
be
able
to.
You
know
roll
cloud
native
build
logs
out
on
production.
It
would
it
wouldn't
be
possible.
The
amount
of
fixes
and
insights
that
matrix
have
provided
like
it
was
a
significant
help.
So
so
I
will
try
to
find
the
issue
about
property
was
scalability
concerns,
I'm
pretty
sure
that
it's
somewhere
in
the
infrastructure
issue
tracker.
A
C
Yeah
yeah,
maybe
we
could
do
something
where
we
add
metrics
and
then
as
we
as
we
allow
the
feature
flag
and
we
eventually
remove
the
feature
flag.
We
scale
back
with
the
metrics
that
we
originally
created
in
a
way
that
have
something
that
helped
us
making
like
informed
decisions
about
the
future
flag,
because
sometimes
I
feel
like
with
existing
metrics.
We
have.
C
A
Yeah,
I
think
it
makes
sense,
however,
promote
use.
Metrics
are
not
the
only
help
we
can
have
well
like
we
can
use
kibana
to
lock
exception.
For
example,
right
kibana
has
a
much
different
data
retention
in
in
case
wikibon
metrics.
We
usually
remove
or
move
logs
to
a
different
location
after
seven
days
or
ten
days.
Something
like
that
so
yeah
this.
A
This
way
you
can,
you
can
add
a
metric
at
the
logging
of
an
exceptional
thing,
so
you
you
basically
raise
exception
in
an
exceptional
case
in
the
case
that
you
know
that
it
shouldn't
work.
This
way
that
your
feature
shouldn't
behave
this
way,
you
should
never
see
this
exception
right,
that's
why
we
do
have
exceptions
and
if
you
see
exceptions
in
kibana,
it
means
that
something
is
wrong
with
the
feature,
but
sometimes
it's
easier
to
use
metrics.
It
all
depends
on
the
context.
So
it's
hard
to
tell
without
looking
at
the
specific.
A
You
know
problem
whether
we
should
use
prometheus
or
or
kibana,
but
I
think
it
makes
sense
to
remove
metrics
that
are
not
being
used
right.
We
don't
have
like
a
lot
of
them
right
now,
but
if
there
is
a
metric
that
is,
I
like
collecting
a
ton
of
data
and
no
one
is
using
it
or
perhaps
it's
being
used
in
a
legacy
feature.
Then
it's
there's,
no
good
reason
to
keep
it.
A
Yeah,
so
there
is
an
epic
about
making
it
generally
available
and
there
is
an
epic
about
improving
observability
and
resiliency.
Even
more
so
one
improvement,
I'm
currently
working
on
is
that
there
is
a
difference
between
an
invalid,
build
lock
and
a
malformed
build
clock.
A
bit
low
can
be
invalid
when
we
are
removing
data
from
this
build
log,
because
it's
sensitive
data,
for
example,
registration,
tokens
or
build
tokens,
and
we
replace
a
token
that
might
be
eight
bytes
with
eight
characters
that
are
one
byte.
A
So
we
are
not
changing
the
size
of
the
log,
but
we
are
intentionally
changing
its
content,
so
the
build
lock
is
invalid,
because
checksum
no
longer
matches
right,
but
the
byte
size
does
not
change.
So
we
would
like
to
detect
cases
where
build.
Lock
is
an
is
invalid
and
it's
also
malformed.
So
it's
a
very
bad
situation.
We,
I
think
that
the
rate
it's
almost
impossible
right
now
to
detect
this
using
the
metrics
we
have
so
I'm
going
to
add
a
metric
to
a
runner.
A
A
runner
is
going
to
send
a
byte
size
of
a
build
log
to
github,
and
then
later
we
will
be
able
to
actually
compare
it
with
what
we
actually
have.
So
if
byte
size
and
build
log
checks
on
does
not
do
not
much,
then
we
are
going
to
have
a
totally
separate
metric
and
other
thing
based
on
that,
because
that
that's
a
very
bad
situation.
A
So
this
is
my
plan
to
improve
observability
and
then
the
parallel
track
is
to
making
this
feature
a
little
bit
more
resilient
to
a
replication
like
I,
I
show
you
you.
You
saw
this
prominent
use
graph
when
we
do
have
a
bunch
of
involved
build
logs
detected
when
a
replication
lag
happens.
So
we
would
like
to
we
remove
replication
like
from
the
equation
and
reduce
the
amount
of
errors
and
false
negatives.
A
So
this
this
is
my
like
plan
for
the
near
future
and
later
I
think
that
the
next
after
this
is
done,
we
will
need
to
think
about
making
it
generally
available
for
everyone.
But
it's
not
clear
how
to
do
that,
because
this
feature
kind
of
depends
on
object,
storage,
right
and
the
most
simple
installation
of
gitlab.
It's
just
a
docker
image.
You
run
on
your
machine
and
there
is
no
object.
Storage
available,
so
it's
not
clear
yet
how
this
feature
should
behave
in
such
case.
A
A
You
know,
instance
of
gitlab
and
has
everything
stored
on
disk.
They
don't
need
all
these
advanced
mechanisms
right
so
should
we
make
the
feature
generally
available,
and
this
way
we
maintain
only
one
mechanism
that
we
actually
use
on
github.com
all
the
time
or
should
we
maintain
two
mechanisms
knowing
that
it
might
be
better
for
users,
because
it
makes
installation
more
simple
and
stuff
like
that?
So
these
are
like
you
know,
questions
we
will
need
to
find
an
answer
for
and
it's
more
like
a
product
problem,
it's
more
like
a
distribution
team
problem.
A
D
D
D
I
saw
that
all
of
the
issues
for
that
work
identified
is
in
the
current
new
milestone
13.7,
except
for
one,
the
one
that
is
about
the
build,
lock
limits,
and
I
and
I
know
it's
it's-
it's
not
a
high
priority
one,
but
if
that
one
I
would
be.
I
don't
know
if
we
need
to
solve
for
that
before
we
move
on
to
the
epic
as
far
as
making
it
generally
available,
I
don't
know
how
big
of
a
risk
it
is,
but
if
needed,
I
would
be
okay.
A
A
So
that's
a
good
question.
Basically,
the
the
limits
are
not
really
connected
with
general
availability,
because
events
are
gitlab.com
specific
right
because
it's
the
problem
of
the
scale
and
this
problem
might
not
exist
everywhere
right,
but
I
I
removed
the
build
logs
mixed
from
with
backlog.
After
seeing
the
priority
and
severity
rating
posted
by
security
team.
A
Okay,
in
my
opinion,
might
be
a
little
bit
more
urgent
than
s3
and
priority
four
yeah,
but
yeah.
That's
that's!
You
know
this
kind
of
a
problem,
so
we
sometimes
know
about
security
problem
and
do
nothing
about
it
for
four
years
five
years
it
has
happened
in
the
past,
but
in
this
particular
case
I
think
we
should
work
on
this
in
perhaps
q1
or
q2
of
2001..
D
A
D
A
D
In
the
in
the
epic
for
making
it
generally
available,
I
was
I
noticed
that
there
is
an
issue
for
deprecating
the
trace
parameter
from
one
of
the
existing
endpoints
targeted
for
removing
it
in
14.0,
and
it
was
good
that
you
already
assigned
the
milestone
so
that
I
know
that
we,
I
need
to
include
start,
including
deprecation
notices
about
it.
Maybe
one
or
two
milestones
ahead
in
our
release
post
to
that
focus
in.
A
D
A
Yeah,
so
we
added
the
override
label,
so
one
of
the
labels
I
showed
you
include
the
overwrite
and
we
increment
this
label
whenever
a
runner
sends
a
payload
trace,
parameter
to
the
api,
so
that
it
should
not
happen
and,
as
you
can
see,
it
happens
like
around
one
time
every
two
seconds
yeah
at
most
like
so
it's
like
quite
significant
rate
right.
It
happens
almost
every
second,
so
it's
totally
unclear
what
runners
are
sending
this
data.
This
has
been
deprecated
in
a
runner
a
couple
of
years
ago.
A
So
is
it
possible
that
we
are
still
supporting
such
an
old
runners,
why
we
are
actually
seeing
this
data
being
sent?
So
this
was
you
know
interesting,
because
whenever
I
had
doubts
about
how
something
works
and
whether
it's
being
used
or
not,
I
added
the
metric,
and
this
actually
revealed
that
runners
are
sending
data
in
the
trace
parameter,
and
this.
D
D
D
D
A
A
A
I
wanted
to
also
invite
pipeline
authoring,
but
I
I
was
unable
to
do
that
because
you
need
to
have
access
to
access
the
alias
right
so
cheryl
and
twiki
made
the
alias
of
their
groups,
all
yes
of
their
groups
like
public,
but
the
pipeline
outward
is
still
not
public
and
I
cannot
use
it
to
invite.
Oh
interesting.