►
From YouTube: Group Code Coverage Data Speed Run
Description
Speed run explaining the Group Code Coverage Data feature.
Documentation: https://docs.gitlab.com/ee/user/group/repositories_analytics/#current-group-code-coverage
Feedback issue: https://gitlab.com/gitlab-org/gitlab/-/issues/231515
A
A
So
you
can
access
this
at
the
group
level
by
getting
into
the
analytics
and
repositories
same
as
you
can
for
test
coverage
or
code
coverage
at
the
project
level.
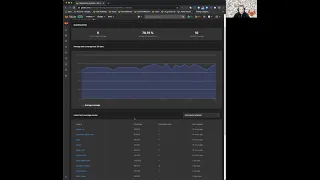
So
repository
analytics
here
we
show
the
number
of
projects
the
average
coverage
of
the
jobs
within
those
projects
and
then
how
many
jobs
make
up
that
average
as
well
as
then
a
graph
of
how
that
is
changing
over
time.
A
We
do
know
that
there
is
a
slight
bug
in
the
logic
where
it's
only
calculating
that
for
these
top
six
projects,
that's
six
numbers,
actually
the
number
of
projects
that
have
been
updated
within
the
last
24
hours,
but
you
can
still
see
a
full
list
of
the
projects
here,
so
you'll
be
able
to
click
in
and
navigate
to
a
project.
You
do
see
its
current
coverage
and
how
many
jobs
there
are
there
so
from
here.
It's
really
easy
to
jump
in.
A
A
Download
my
raw
csv
here,
if
I'm
going
to
look
at
it,
which
will
get
the
data
from
all
of
the
jobs
if
there
were
multiple
jobs
for
this
project,
and
you
can
also
get
the
full
csv
for
all
of
the
different
projects
and
all
of
their
different
jobs
and
coverages
over
time
with
the
csv
download
here.
So
we're
pretty
excited
about
this,
we're
working
on
that
bug
where
we
get
all
of
the
projects
calculated
into
this
average,
as
well
as
annotating,
this
a
little
bit
so
looking
forward
to
your
feedback.