16 Dec 2021
Monitoring your plants doesn’t need to come with a lot of wires or cost a lot of money. We’ll use the free Grafana Cloud plan to set up a monitoring system for our plants and learn (a bit) how Bluetooth Low Energy works.
Sign up for a free Grafana Cloud account:
Resources:
https://github.com/Elfo404/greenskeeper-observer
https://github.com/Elfo404/greenskeeper-broadcaster
Sign up for a free Grafana Cloud account:
Resources:
https://github.com/Elfo404/greenskeeper-observer
https://github.com/Elfo404/greenskeeper-broadcaster
- 2 participants
- 22 minutes
16 Dec 2021
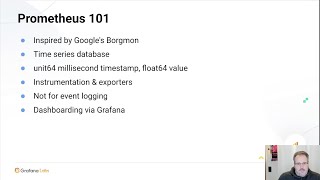
Cloud-native, observability, etc have become buzzwords. We will look at the kernels of truth of those buzzwords, why their underlying concepts are useful, all the relevant concepts and a good default set of tools, and how to apply all of this in cloud and more traditional environments alike. This talk is a 101 talk designed for new communities.
-------
Richard Hartmann (@TwitchiH), Director of Community at Grafana Labs, Prometheus team member, OpenMetrics founder, CNCF TAG Observability chair, and other things.
Learn more about observability with Prometheus and Grafana:
https://grafana.com/about/events/observabilitycon/2021/
-------
Richard Hartmann (@TwitchiH), Director of Community at Grafana Labs, Prometheus team member, OpenMetrics founder, CNCF TAG Observability chair, and other things.
Learn more about observability with Prometheus and Grafana:
https://grafana.com/about/events/observabilitycon/2021/
- 2 participants
- 25 minutes
16 Dec 2021
GitHub Copilot can suggest whole lines of code or entire functions right inside your editor. Trained on billions of lines of public code, GitHub Copilot puts the knowledge you need at your fingertips, saving you time. The technical preview works especially well for the more commonly used frameworks, like JavaScript - which is what you use to write scenarios in k6. Let’s try and script our load tests with this “AI programmer”.
Yusuf Tayman (@yusuftayman), Senior Software QA Engineer at OpenPayd
Learn more about load testing with k6 at https://k6.io/
Yusuf Tayman (@yusuftayman), Senior Software QA Engineer at OpenPayd
Learn more about load testing with k6 at https://k6.io/
- 2 participants
- 15 minutes

15 Dec 2020
The ability to easily understand how your system is behaving and quickly identify the root cause of a downtime is an important aspect to take into account when building and monitoring microservices in the cloud. In this session I will show some examples of which kind of information and data points can be utilised and displayed in your Amazon Managed Grafana dashboards to better assess the health of your microservice.
Sara Gerion, Senior Solutions Architect at Amazon Web Services
Sara Gerion (@sarutule) is a Senior Solutions Architect at Amazon Web Services (AWS), with a background in backend and cloud development. She is passionate about scalability, observability, and resilience in the cloud.
Learn more about Amazon Managed Grafana: https://grafana.com/blog/2020/12/15/announcing-amazon-managed-service-for-grafana/
- 2 participants
- 25 minutes
